

Reviewed August 2026 against USDA NASS’s 2023 Technology Use Report, USDA ERS’s precision-agriculture adoption research, and the U.S. Government Accountability Office’s January 2024 report on precision agriculture (GAO-24-105962).
Try it: Run your own numbers →
“Digital agriculture solutions” are the software, satellite, and sensor tools that replace guesswork with measured data: crop-health imagery, AI-driven advisory, blockchain traceability, and fleet management, sold as apps, APIs, or subscriptions rather than as physical equipment. As of the survey window running June 2022 through June 2023, only 27% of U.S. farms or ranches used any precision agriculture practice at all, and adoption splits sharply by farm size — a gap this article measures rather than just describes. It also answers a second question hiding in the same search traffic: what a “farming marketplace” or “premium agri marketplace” means for a U.S. grower, since Farmonaut supplies farm data and monitoring rather than operating a marketplace itself.
What “Digital Agriculture Solutions” Actually Cover
The category is broad enough that different vendors use it to describe five distinct products. Farmonaut’s platform maps to most of them; the table below lines each one up against the method it replaces and the data source behind it.
| Solution | Replaces | Data Source | Farmonaut Feature |
|---|---|---|---|
| Satellite crop-health monitoring | Manual field walks, visual scouting | Multispectral satellite imagery (NDVI, soil moisture) | Real-time vegetation and moisture layers |
| AI farm advisory | Fixed agronomy calendars | Satellite data + weather model outputs | Jeevn AI advisory engine |
| Traceability | Paper receipts, verbal chain-of-custody | Blockchain ledger entries | Farm-to-buyer product tracing |
| Fleet and resource management | Manual logbooks | GPS and telematics feeds | Vehicle and route optimization tools |
| Carbon footprinting | Estimated or self-reported emissions | Sensor- and satellite-derived emissions data | Real-time emissions reporting |
None of these five require owning new machinery — that’s the actual distinction between “digital solutions for agriculture” and the equipment-heavy version of precision farming most people picture. A subscription, an API key, or a smartphone is the entry point; the satellite, the model, and the ledger sit on the vendor’s side.
How Many US Farms Actually Use These Tools
Adoption is not evenly spread. The 27% national figure comes from USDA farm survey data cited in the GAO’s January 2024 precision agriculture report, and it hides a wide gap once you sort by farm size and by technology.
Which Technologies Farms Actually Use
Guidance and autosteer systems — the most-adopted category — were used on 52% of midsize crop farms and 70% of large-scale crop farms in 2023, per USDA ERS’s 2023 Chart of Note on farm-size adoption. Yield monitors, yield maps, and soil maps reached 68% of large-scale crop farms the same year. This size gap isn’t new: an earlier ERS chart shows 73% of the largest corn farms had already adopted guidance systems by 2016, against 10% of the smallest corn farms that same year. Variable-rate technology (VRT) moved more slowly and unevenly by crop: cotton acres using VRT rose from 5.4% in 2007 to 22.7% in 2019, winter wheat reached 18.8% of planted acres in 2017, and sorghum reached 13.9% in 2019, according to ERS’s February 2023 report on precision agriculture adoption.
Why Adoption Still Lags
The GAO’s January 2024 report names three specific barriers: high upfront equipment cost, which disadvantages resource-limited farms; concerns over who owns and can share farm data, which slow AI-tool adoption; and a lack of uniform standards, which limits interoperability between vendors’ systems. USDA and the National Science Foundation combined provided close to $200 million in precision-agriculture research funding across fiscal years 2017–2021. Connectivity is part of the same story: 85% of U.S. farms reported internet access in 2023, but only 51% of those connected farms used a broadband connection; 32% of all farms used the internet to purchase farm inputs, and 23% used it to market farm products or activities, per USDA’s 2023 Technology Use Report.
NASS re-issues the Technology Use survey on a recurring cycle (rounds published for 2019, 2021, and 2023 so far), and the Census of Agriculture every five years. NASS’s Quick Stats database holds whichever edition is newest, so a reader checking this in 2027 or 2028 should pull the current round rather than trust the 2023 numbers above.
The Digital Agriculture Market Is Growing — But Estimates Vary by Analyst
Globally, the digital agriculture market was valued at $24.32 billion in 2025 and $26.82 billion in 2026, with a projected climb to $43.71 billion by 2031 — a 10.26% compound annual growth rate for 2026–2031 — according to Mordor Intelligence’s Digital Agriculture Market report. North America held 37.8% of that market in 2025, the largest regional share, which Mordor attributes to large average farm sizes, high mechanization, and sustained USDA program funding.
Two adjacent terms show up in the same search traffic and mean narrower things. “Farming as a service market” — contracting out equipment, labor, or inputs on a per-use basis instead of owning them — was sized at $4.70 billion in 2024 and is projected to reach $11.78 billion by 2030, a 16.56% CAGR for 2025–2030, per Research and Markets’ Farming as a Service Market: 2026 Edition, published May 12, 2026. “Autonomous crop management market” is priced very differently: Market Research Future’s Autonomous Crop Management Market report puts it at $2.645 billion in 2024, rising to $3.62 billion in 2025 and a projected $61.29 billion by 2034 — a 36.93% CAGR, far steeper than either figure above. That gap is a definitions problem, not a typo: some analysts count only fully autonomous robots and drones, others fold in GPS autosteer and variable-rate controllers that are already running on most large U.S. farms. Before quoting a single number for this market, check what hardware category the report actually counts — the definition drives the gap between estimates more than the year does.
What “Farming Marketplace” Actually Means for a US Grower
Search interest in “farming marketplace,” “agriculture marketplace india,” and “premium agri marketplace” is really three different questions wearing the same phrase. In the United States, the closest official concept is USDA’s direct and intermediated marketing channels — farmers markets, CSAs, food hubs, and direct sales to restaurants, retailers, or institutions — tracked by NASS’s Local Food Marketing Practices Survey. Farmonaut does not operate a marketplace; it supplies the crop-health and traceability data that make produce easier to sell into one.
In 2020, the most recent full survey round, more than 147,000 U.S. farms sold food through these direct and intermediated channels for $9.0 billion in combined revenue, per the USDA NASS release of the 2020 Local Food Marketing Practices Survey (data collected for 2020, released April 2022): $4.1 billion through direct sales to institutions and intermediaries (40,000-plus farms), $2.9 billion direct-to-consumer, and $1.9 billion direct-to-retailers (24,000-plus operations).
Search phrases like “agriculture marketplace india” and “digital farming in india” point to the same shift happening in a different market, with different institutions, currency, and scale. Everything above is built on U.S. figures — USDA and GAO — and that stays true for the rest of this article. For a look at specific innovations being piloted in India, see our separate roundup of modern farming methods there; for any other country, the equivalent starting point is that country’s own national agricultural statistics agency — Statistics Canada, Defra, or Eurostat, for example.
Where does your own direct-sales mix land next to the 2020 national numbers above? Enter your revenue by channel below.
Run your own numbers
Precision Agriculture in Practice: Satellite Data, AI Advisory, and Traceability
Farmonaut’s platform runs on three linked layers. Multispectral satellite imagery produces NDVI vegetation-health scores and soil-moisture estimates for a mapped field boundary, refreshed on each new satellite pass. The Jeevn AI advisory engine takes that imagery plus weather-model data and turns it into a specific recommendation — irrigate, hold fertilizer, scout for pests — rather than a generic calendar. A blockchain ledger then records each step a batch of produce moves through, from harvest to buyer, so a claim about origin or handling can be checked against an entry instead of taken on trust.

That kind of remote crop-area verification matters beyond the field: lenders, insurers, and produce buyers increasingly want acreage and health data they didn’t have to take a farmer’s word for. It’s also the practical difference between “digital agriculture solutions” as a marketing phrase and as a working stack — imagery, an advisory layer, and a verifiable record, each doing a specific job.
Resource-Efficient and Sustainable Farming Techniques
Four practices make up most of what “sustainable digital farming” means in application: drip irrigation that targets water at plant roots instead of flooding a field; rainwater harvesting for use in dry stretches; soil-moisture monitoring that sets an irrigation schedule from measured data instead of a fixed calendar; and crop selection weighted toward water availability rather than habit. Verifying field boundaries and acreage — the same capability shown in the Egypt case study above — is a practical first step before sizing any irrigation plan, since an irrigation budget built on the wrong acreage is wrong before it starts.
Two related guides go deeper on the pieces that don’t fit in one section: a full walkthrough of water-scarcity solutions for row crops, and a cross-industry efficiency playbook — built for mining operations, but running on the same measurement principles — on sustainable water management.
Fleet Management, Labor Costs, and the Business Case for Going Digital
Labor is the other side of the “farming as a service” market discussed above. U.S. agricultural wage and salary employment, measured through BLS’s Quarterly Census of Employment and Wages, rose from 1.07 million jobs in 2010 to 1.18 million in 2024 — a 10% gain over 14 years. Real hired farm labor wages rose from $12.05 an hour in 1990 (in 2024 dollars) to $18.12 an hour in 2024, growing at an average 1.2% per year over that span and accelerating to 1.9% per year over the most recent decade, according to USDA ERS’s farm labor data. Rising, accelerating labor costs are a direct driver of the FaaS and contract-labor models sized in the market section above: renting a machine and an operator by the acre gets cheaper relative to owning one as wages climb.
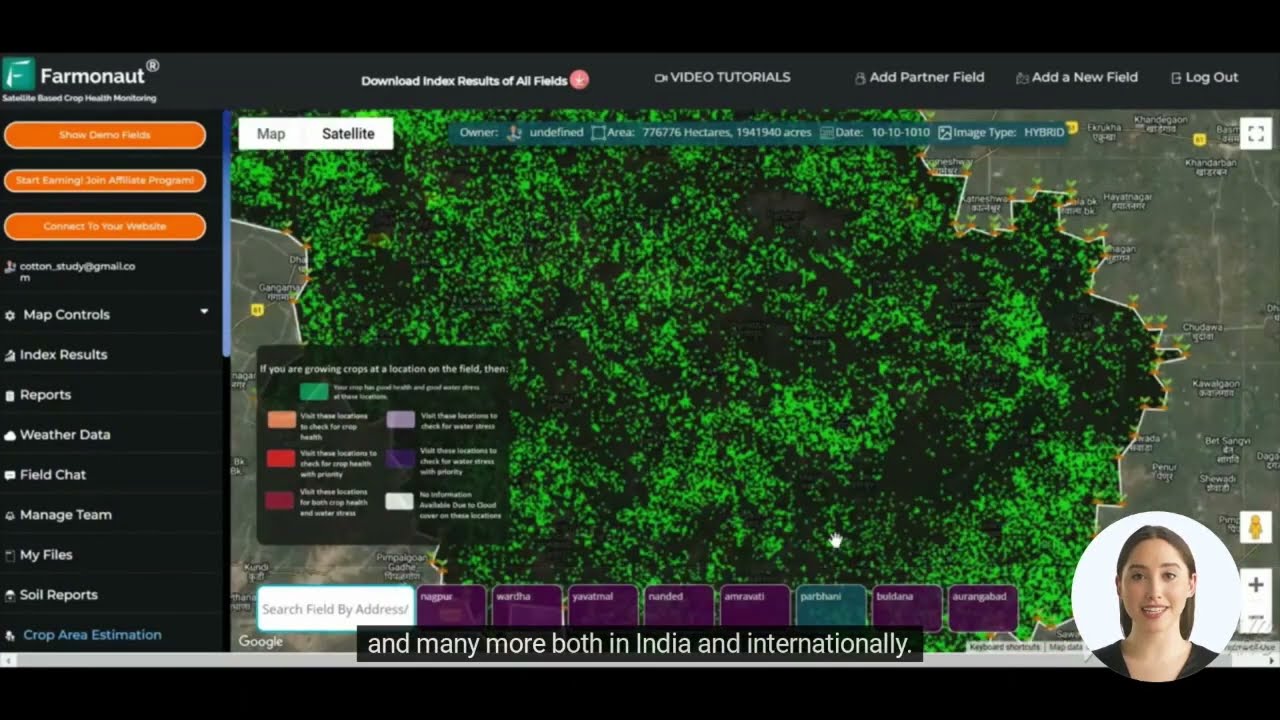
Farmonaut’s fleet and resource-management module — the same web app shown below — applies GPS and telematics data to route vehicles and log equipment use automatically, replacing the manual logbook line from the comparison table further down. It sits alongside crop-revenue tools: for growers weighing which crops actually pay, our guide to cash and tree crop economics and our deep dive on equipment efficiency and crop yield cover the decision in more detail than fits here.

Digital vs Traditional: A Side-by-Side Comparison
| Farm Function | Traditional Approach | Digital Agriculture Solution | What the Data Shows |
|---|---|---|---|
| Crop monitoring | Manual field walks | Satellite NDVI imagery | 27% of US farms used any precision practice, 2022-2023 (GAO) |
| Guidance / steering | Manual driving | Autosteer / guidance systems | 70% of large-scale crop farms vs. 52% midsize, 2023 (USDA ERS) |
| Input application | Uniform spreading | Variable-rate technology | Cotton VRT rose from 5.4% (2007) to 22.7% (2019) of planted acres (USDA ERS) |
| Buying inputs / selling produce | Local dealers and middlemen only | Online purchasing and direct-marketing channels | 32% of farms bought inputs online, 23% marketed online, 2023 (USDA NASS) |
| Traceability | Paper trail, verbal history | Blockchain ledger | No national adoption survey yet tracks this; check FDA’s FSMA Section 204 traceability rule timeline for your commodity |
| Fleet and resource management | Manual logbooks | GPS telematics + routing software | Ties to labor costs: real hired farm wages hit $18.12/hr in 2024 (USDA ERS) |
Frequently Asked Questions
- Q: What is Farmonaut?
A: Farmonaut is a satellite-based farm management platform — multispectral crop monitoring, the Jeevn AI advisory engine, blockchain traceability, fleet management, and carbon-footprint reporting — delivered through a web app, mobile apps, and a developer API rather than as a marketplace or an equipment brand. - Q: Does Farmonaut offer any “crop market capability” — data useful for market planning, not just field management?
A: Yes. Its satellite-based crop-area and yield-estimation outputs are exposed through the API, so third-party marketplaces, lenders, and insurers can pull crop-area and health data directly instead of relying on self-reported acreage. - Q: Is this the same as “aalu.info” or other agriculture-blog aggregator sites?
A: No. Aggregator sites republish or index farming content pulled from many sources. Farmonaut’s blog and product documentation are published directly on farmonaut.com and reflect the company’s own platform and data, not third-party syndication. - Q: What’s the difference between “farming as a service” and what Farmonaut sells?
A: Farming-as-a-Service (FaaS) usually means contracting out equipment, labor, or inputs on a per-use basis — the model sized in the market section above. Farmonaut instead sells the data layer — imagery, advisory output, traceability records — that a FaaS provider, a marketplace, or a farm’s own team can act on; it does not supply tractors, drones, or labor crews itself. - Q: Is Farmonaut an online marketplace for buying or selling crops?
A: No. As covered above, USDA tracks actual U.S. marketplace activity through its Local Food Marketing Practices Survey; Farmonaut supplies the crop-health and traceability data that make produce easier to sell into those channels, but it does not list or transact produce itself.
Get Started With Farmonaut
Every figure in this article is checkable, and most of the tools described are available to try directly:
- Web App: Access the platform from a browser for full farm management.

- Mobile Apps: The same monitoring and advisory tools on iOS and Android.


- API Access: Pull satellite, advisory, and crop-area data directly into a marketplace, lending, or insurance workflow.
Explore the API
API Developer Docs

None of the adoption gaps described above are permanent — they’re a snapshot from USDA’s 2022-2023 survey cycle. Whether they’ve narrowed by the time you’re reading this depends on the next Technology Use round and the next Census of Agriculture, both linked through NASS’s Quick Stats database; join the longer history of agricultural revolutions that this one is a part of, and check back against the sources above rather than this page’s numbers alone.

 Yutz Automation
 AgroGreen Dynamics
 Leher
Leher AgroRisk
 Oath Inc
 Reddane Farming
 Esri North East Africa
 Cresol
 Atur Kuliner
 MDCV UK
 Zerella Group
 Etech Consulting Madagascar
 Vestlandsforsking
 Delicio
 WB Dev
 Sama Premium
 Prochecker
 Tres Valles
 LACOS Geoinformation
 Magrifly
 LatConnect 60
 Blickwinkel
 Agricultural Credit Policy Council
