

Precision Farming Solutions: Adoption, Costs & ROI
Reviewed August 2026 against the USDA Economic Research Service (ERS), the USDA Agricultural Research Service (ARS), and the U.S. Government Accountability Office (GAO).
Try it: Precision Irrigation Savings Estimator →
Precision farming solutions combine satellite or drone imagery, GPS guidance, variable-rate application, and AI advisory tools so a grower can treat a field acre-by-acre instead of as one uniform block. As of 2023, only 27% of U.S. farms and ranches used any precision agriculture practice, per Agricultural Resource Management Survey (ARMS) data cited in a January 2024 U.S. Government Accountability Office report — meaning most of the productivity and water-saving gains documented below are still unclaimed by American farmland. This piece works through what these solutions include, what USDA’s own field trials say they actually save, what they cost to adopt, and where the technology is headed, with a calculator you can run against your own acreage.
USDA field trials have cut irrigation water use by double digits without hurting yield — one data point behind sustainable resource management across modern agricultural supply chains.
What Precision Farming Solutions Actually Include
The phrase covers a specific stack of tools, not a single product. In practice, precision farming solutions on a working farm usually mean:
- Satellite or drone-based crop health and soil-moisture monitoring
- GPS auto-steer and guidance for planting and spraying passes
- Variable-rate technology (VRT) that changes seed, fertilizer, or chemical rates within a single field
- AI advisory systems that turn imagery and weather data into an irrigation, fertilization, or pest-management recommendation
- APIs and farm-management software that connect field data to equipment and records
These are the same tools referenced under the broader umbrella of agritech solutions reshaping rural economies — precision farming is the field-level layer of that broader technology shift, focused specifically on what happens between planting and harvest on a given acre.
Agriculture and Agritech Solutions: The Technology Stack
Adoption of individual technologies varies enormously by farm size and by crop, which is why a single “adoption rate” headline number hides more than it reveals. USDA ERS’s December 2024 America’s Farms and Ranches at a Glance update found that 70% of large-scale crop-producing farms used automated guidance/autosteer systems in 2023, versus 52% of midsize farms; 68% of large-scale farms used yield monitors, yield maps, or soil maps. Adoption rises sharply with farm size — small family farms, defined by USDA as those with gross cash farm income under $350,000, lag well behind on every technology category.
Satellite and Remote-Sensing Monitoring
Farmonaut’s platform uses satellite imagery for field-level crop-health and soil-moisture tracking, the same category of remote sensing that USDA’s National Agricultural Statistics Service uses NASA’s Landsat and MODIS data for at the national scale. Targeted input application built on this imagery — variable-rate fertilizer, GPS-guided spraying, and drone-based application in hard-to-reach areas — is what turns a satellite picture into a field decision rather than a report nobody acts on.

AI-Driven Advisory and Nutrient Management
Farmonaut’s Jeevn AI Advisory System analyzes satellite data, soil conditions, and plant health indicators to recommend nutrient timing and rates, aiming to reduce fertilizer waste and runoff while holding or improving yield. This is the same direction USDA and land-grant researchers are moving in with AI-driven yield forecasting; see our roundup of current agritech innovations for the wider field.
Precision Farming in Agritech: How the Pieces Connect
“Precision farming” and “agritech” get used interchangeably, but the relationship is closer to nested categories: agritech is the whole technology stack touching agriculture — finance, supply-chain, labor, genetics, and field operations — while precision farming is specifically the field-operations layer. The connective tissue between them is data infrastructure: a farm’s satellite feed, weather station, and equipment telemetry only compound into a bigger agritech platform (traceability, insurance, lending) if they’re accessible through a common interface. That is the role Farmonaut’s own API and API Developer Docs play — letting a farm-management system, insurer, or cooperative pull the same field data a farmer sees, rather than re-collecting it.
How much of that data infrastructure is actually in place across U.S. row-crop acreage varies by both technology and crop. USDA ERS’s February 2023 report, based on ARMS surveys through 2019, found automated guidance systems used on well over 50% of the acreage planted to corn, cotton, rice, sorghum, soybeans, and winter wheat — but yield maps, soil maps, and variable-rate technology on wheat, cotton, sorghum, and rice specifically covered only 5% to 25% of planted acreage. Corn and soybean growers have had access to VRT and mapping tools longer and use them more; the other row crops are still catching up.
What Precision Irrigation Actually Saves — The USDA Trial Data
Water is where precision farming solutions have the most directly measurable payoff, and USDA’s Agricultural Research Service has run long-running field trials that put real numbers on it. In a subsurface drip irrigation (SDI) trial on corn at the USDA ARS research station in Bushland, Texas, switching from sprinkler to SDI cut overall corn water use by up to 6 inches per season, with evaporation losses reduced by 2 to 5 inches, while grain yields rose by up to 20% and crop water productivity improved by up to 46%, all reported in ARS’s FY2020 Annual Report on Science Accomplishments.
A separate 10-year deficit-irrigation study on peach orchards at the ARS station in Parlier, California, found water savings of up to 40% with no significant yield loss, and fruit quality — firmness, soluble solids, pH, malic acid, and phenolics — held steady. Both are multi-year field results, not lab estimates, and both come from the same FY2020 ARS report cited above.
Run your own numbers below. It uses the savings percentage you enter — informed by the ranges above, or by your own extension office’s figures — against your acreage, current water use, and local water cost.
Precision Irrigation Savings Estimator
Assumes a flat water cost and doesn’t account for equipment financing, pumping energy, or crop-specific stress thresholds. USDA ARS field trials cited above found savings ranging from single digits up to 40% depending on crop, the irrigation method being replaced, and management — set the percentage to a figure that fits your operation or crop advisor’s recommendation, not the default.
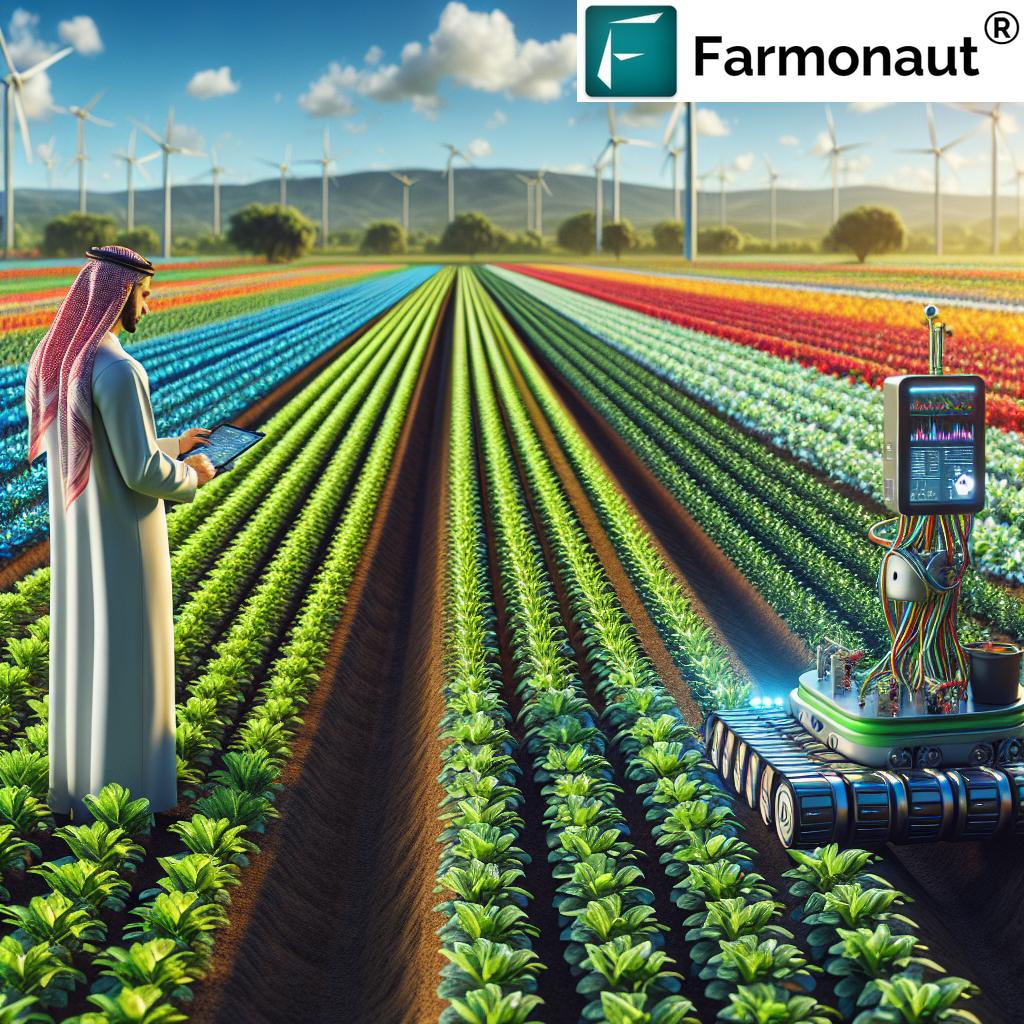
Agtech Solutions for Sustainable Farming
Sustainability claims in agritech are only as good as what they measure. The concrete, verifiable pieces are: reduced water and chemical use (covered above), soil-health tracking to flag erosion or nutrient depletion before it shows up in yield, carbon-footprint tracking for farms that need to report emissions or participate in carbon-credit markets, and blockchain-based traceability that lets a buyer confirm where a crop came from. None of these replace the underlying agronomy — they make it visible and auditable, which is what separates a genuine sustainable agriculture solution from a marketing label.
Reduced chemical runoff and more targeted land use also have a direct biodiversity angle: less drift and runoff means less pressure on pollinators and on soil microbiome health in and around treated fields. If you're evaluating an agtech vendor's sustainability claims, ask for the same thing a USDA ARS field trial would report — a baseline, a measured change, and the study's duration — rather than a percentage with no source attached.

Traditional vs. Precision Farming: A Side-by-Side Comparison
Rather than round percentages with no source, here is what the cited USDA field trials and surveys actually found, side by side:
| Metric | Conventional practice | Precision / data-driven practice | Source |
|---|---|---|---|
| Corn irrigation water use (SDI vs. sprinkler, Bushland, TX) | Sprinkler baseline | Up to 6 inches less per season; evaporation cut 2–5 inches | USDA ARS, FY2020 |
| Corn yield, same trial | Baseline | Up to 20% higher | USDA ARS, FY2020 |
| Water productivity, same trial | Index 100 | Up to index 146 (+46%) | USDA ARS, FY2020 |
| Peach orchard irrigation (Parlier, CA, 10-yr trial) | Full irrigation | Up to 40% less water, no significant yield loss | USDA ARS, FY2020 |
| Autosteer/guidance use, large-scale crop farms | Manual steering (implied) | 70% used autosteer, 2023 | USDA ERS, Dec. 2024 |
| Yield monitors/soil maps, large-scale crop farms | None | 68% used at least one, 2023 | USDA ERS, Dec. 2024 |
| Any precision ag practice, all U.S. farms/ranches | — | 27%, 2023 | GAO-24-105962, Jan. 2024 |
Costs, Funding, and Why Adoption Still Lags
If precision farming solutions save this much water and lift yield this reliably, the obvious question is why adoption sits at 27%. The GAO's January 2024 report names three specific barriers: high upfront equipment costs that price out farmers with limited access to capital, unresolved concerns over who owns and controls farm data once it's shared with a vendor, and a lack of interoperability standards that leaves equipment from different manufacturers unable to talk to each other. On the funding side, USDA and the National Science Foundation put nearly $200 million into precision agriculture research and development across fiscal years 2017 through 2021 — public money aimed squarely at closing that adoption gap, per the same GAO report.
Interoperability is precisely the problem an open API is meant to solve: a farm's satellite feed, weather data, and soil readings become usable by any farm-management system or lender that can call a documented endpoint, instead of being locked to one piece of hardware. That is the case for building agribusiness strategy around open data access rather than a single vendor's closed ecosystem.
Where the Technology Is Headed
Two developments are extending precision farming beyond field-level monitoring: blockchain-based traceability, which lets a buyer or regulator verify a crop's origin without trusting a paper trail, and machine-learning models that turn multi-year satellite and weather records into planting-window and disease-risk forecasts rather than descriptions of what already happened. Neither is science fiction — NASA's Landsat and MODIS programs already feed USDA's statistical reporting, and university researchers are combining that satellite data with ground sampling to refine fertilizer timing. For a broader look at what's coming next, see our roundup of agriculture breakthroughs.

You can try these tools directly through Farmonaut's Android App and iOS App, both of which carry the same satellite monitoring and AI advisory features referenced throughout this article.
FAQ
Q: What exactly counts as a "precision farming solution"?
A: Satellite or drone-based field monitoring, GPS auto-steer, variable-rate application of seed or inputs, and AI advisory tools that turn that data into a specific irrigation, fertilization, or pest-management recommendation. USDA ARMS surveys track these as distinct, separately measured technologies rather than one bundle.
Q: How is this different from "agritech solutions" generally?
A: Agritech is the broader category — finance, supply chain, labor, genetics, and field operations. Precision farming is specifically the field-operations layer: what happens to a given acre between planting and harvest.
Q: Do agtech solutions for sustainable farming actually reduce water and chemical use, or is that a marketing claim?
A: In USDA ARS's own field trials, yes, with specific figures: up to 40% less irrigation water in a 10-year peach-orchard trial, and up to 46% higher water productivity in a corn trial, both cited above with no significant yield loss in either case.
Q: Does precision farming in agritech work for small farms, or only large operations?
A: USDA data shows adoption rising sharply with farm size — 70% of large-scale crop farms use autosteer versus 52% of midsize farms — because upfront equipment cost is the barrier the GAO's 2024 report names first. Software-only tools like satellite monitoring and AI advisory carry a lower entry cost than hardware like autosteer kits or VRT sprayers.
Q: What crops can use these techniques?
A: USDA data covers corn, soybeans, cotton, rice, sorghum, and winter wheat specifically, with corn and soybeans furthest along in variable-rate and mapping adoption. The same satellite-monitoring approach extends to vegetables, orchards, and cash and tree crops as well.
Q: Where can I check for more current adoption or funding numbers?
A: USDA ERS republishes ARMS-based adoption data periodically at ers.usda.gov, and the GAO report linked throughout this article is GAO-24-105962 — search "precision agriculture" on gao.gov for any successor report.
Ready to see these numbers on your own fields? Explore Farmonaut's precision farming solutions:




 Farm Inc
 JJM Farms
 WeMe Global
 Pixxel
 Agrotoken
 Blue BearX
 Insignito
 Croptimum
 DnCubed
 Field Capacity
 Indosistim Teknologi
 Liquify Digital
 CU Foods
 BeyondTech Global
 Rouge VC
 AgroGreen Dynamics
 AgroRisk
 Oath Inc
 Reddane Farming
 Esri North East Africa
