

Reviewed September 2026 against USDA Economic Research Service and USDA National Agricultural Statistics Service data.
Try it: Run your own numbers →
Smart tractors — machines running guidance and autosteering systems — are now standard equipment on most large US crop farms: 70% of large-scale operations used guidance/autosteering in 2023, according to USDA’s Economic Research Service. That single number explains why “smart tractor” searches keep climbing: this is no longer a pilot technology, it’s the baseline for competitive fruit and row-crop production. Below is what the adoption data actually shows, how it applies to fruit growing specifically, and a calculator to size the payback on your own acreage.
Table of Contents
- Smart Tractor Adoption: The Real Numbers
- Fruit Production Technology in the US
- What “Smart Fruit Farming” Actually Involves
- Why Crop Management Discipline Still Matters
- Off-Season Cropping and the Zaid Question
- Precision Ag Savings Calculator
- Traditional vs. Smart Farming: A Side-by-Side
- FAQ
- Try it: Run your own numbers
Smart Tractor Adoption: The Real Numbers
“Smart tractor” usually means a tractor fitted with GPS-guided autosteering, yield monitors, and variable-rate control — either factory-installed or retrofitted. USDA’s ERS tracks adoption by farm size, and the pattern is clear: bigger farms adopt faster, but midsize operations aren’t far behind.
- 70% of large-scale crop farms used guidance/autosteering systems on tractors and equipment in 2023 (USDA ERS, Charts of Note).
- 52% of midsize crop farms used guidance/autosteering in 2023 (USDA ERS).
- 68% of large-scale farms used yield monitors and soil maps in 2023.
- 45% of large-scale farms used variable rate technology (VRT) for input application in 2023.
- Across all US farms, only 27% used at least one precision agriculture practice for crops or livestock in 2023 (USDA ERS, “Precision Agriculture in the Digital Era”).
That last figure is the real story: precision equipment is concentrated on large operations, and the gap between a 70% adoption rate on big farms and a 27% economy-wide rate is where most of the opportunity — and most of the search traffic behind “smart tractor” — actually sits. If you farm fewer than a few hundred acres, you are statistically in the majority that hasn’t adopted guidance systems yet, which is exactly why the economics below matter before the equipment does.
On the economic side, the Association of Equipment Manufacturers puts a number on what this equipment returns: precision agriculture generates approximately $118,000 in annual economic value per 1,000 acres of row crops (AEM, “The Benefits of Precision Ag in the U.S.”). That works out to roughly $118 per acre per year across guidance, VRT, and monitoring combined — the figure the calculator below uses as its starting point, adjustable to your own acreage.
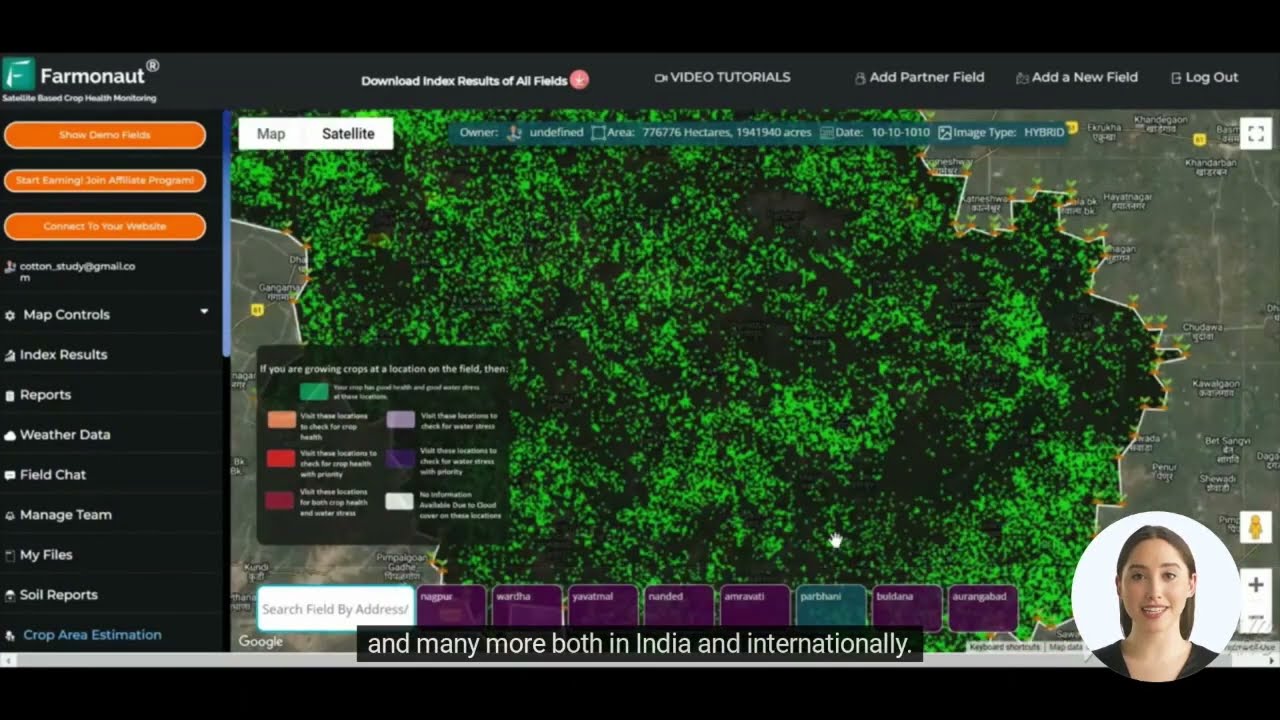
Smart tractors aren’t standalone tools. They’re one piece of a wider stack that includes satellite-based crop monitoring for the vegetation and soil-moisture data guidance systems act on — the kind of layer Farmonaut’s farming technology platform provides between field visits.
Explore Farmonaut’s Web App for Satellite-Based Crop Monitoring:

Fruit Production Technology in the US
US fruit production is large, concentrated, and increasingly technology-dependent. USDA’s National Agricultural Statistics Service reported 15.84 million tons of utilized noncitrus fruit production in 2025, valued at $18.97 billion (USDA NASS, Noncitrus Fruits and Nuts report). Apples alone illustrate how concentrated this industry is: Washington State produced 7.16 billion pounds of apples in 2025 — approximately two-thirds of the entire US apple crop — from a single state’s orchards (USDA NASS, Washington Fruit report).
That concentration is exactly why “fruit technology” and “fruit production” show up as distinct, high-intent searches: growers in a handful of states (Washington, California, Michigan, New York, Pennsylvania) are managing enormous acreage where a 1-2% efficiency gain translates into millions of dollars. The technology stack for fruit differs from row-crop tractors in one key way — orchards and vineyards need canopy-level and block-level data, not just field-average numbers, because yield and disease pressure vary tree-to-tree.
Three technology categories are doing the work in commercial fruit operations right now:
Satellite and remote-sensing monitoring
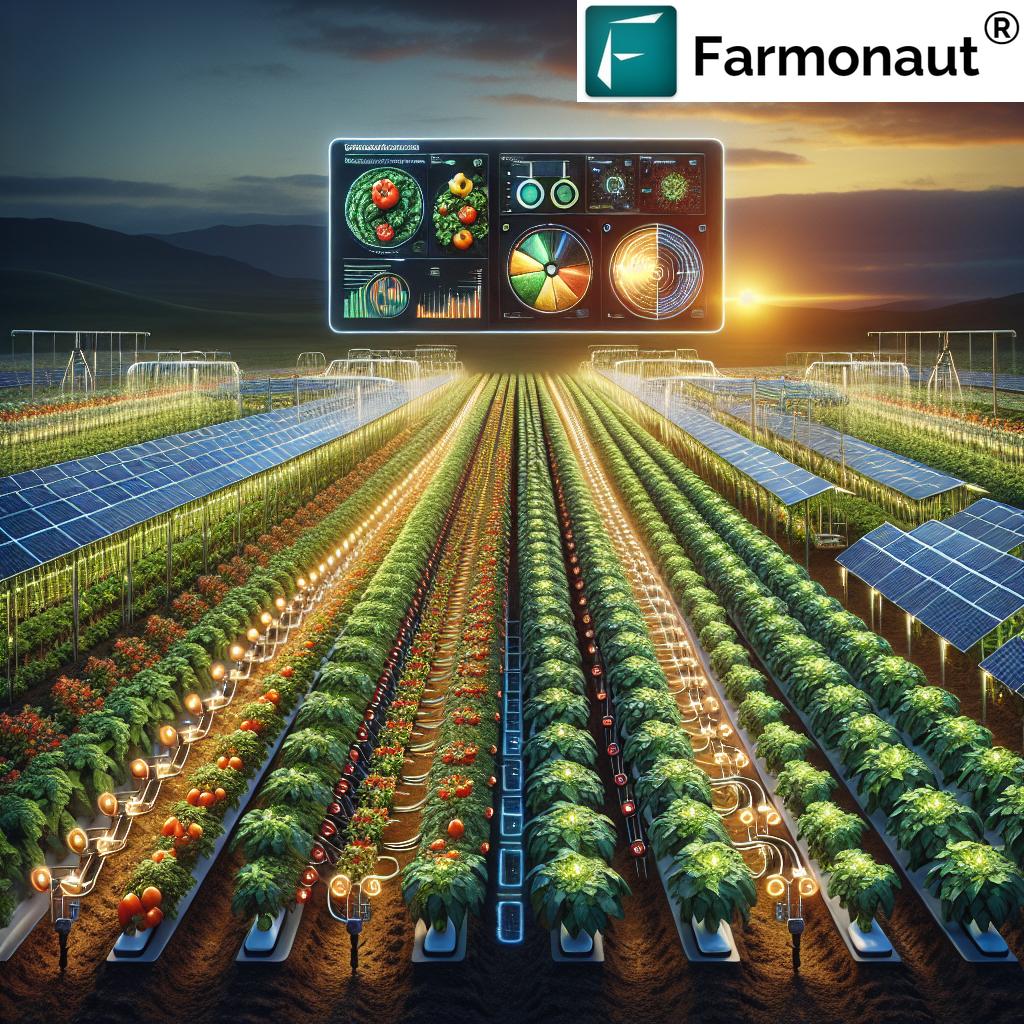
Vegetation-index imagery (NDVI and similar indices) flags stressed blocks before symptoms are visible from the row. This is where platforms like Farmonaut’s satellite monitoring tools sit — reading canopy health across an orchard block by block rather than relying on a single walk-through.
Variable rate and guided equipment
The same guidance/VRT systems used in row crops (45% adoption on large farms, per USDA ERS above) apply to orchard sprayers and mowers, cutting overlap and off-target application in tree rows where manual steering wastes more input than in open fields.
Soil and moisture mapping
Yield monitors and soil maps — used on 68% of large farms in 2023 — let fruit growers match irrigation zones to actual soil variation across a block instead of running one irrigation schedule for an entire orchard.
What “Smart Fruit Farming” Actually Involves
Smart fruit farming combines the satellite monitoring and equipment guidance above with fruit-specific decisions: bloom timing, thinning windows, harvest maturity, and cold-storage scheduling. None of that is generic “smart farming” — it’s fruit-specific because a tree crop carries multi-year capital (the orchard itself) that an annual row crop doesn’t, so a bad input decision compounds for years, not one season.
Farmonaut’s Jeevn AI advisory system applies this logic at the crop level: recommendations for irrigation, fertilization, and pest timing are generated from crop type, local weather, and historical field data rather than a generic calendar. Combined with GPS/GIS-guided input application, this is the practical form “smart fruit farming” takes on a working operation — not a single gadget, but monitoring plus guided equipment plus a decision layer that ties them together.

Sustainable practices are part of the same picture. Conservation and no-till approaches — a core piece of any sustainable farming program — showed a 7-17% increase in soil organic carbon over an eight-year study period compared with conventional tillage, based on USDA-linked Extension research. Higher soil organic carbon improves water-holding capacity, which matters directly to fruit blocks where irrigation timing is already tightly managed.
Discover Farmonaut’s API for Custom Agricultural Solutions:
Farmonaut API
API Developer Docs
Why Crop Management Discipline Still Matters
The “importance of crop management” query gets asked because growers already sense that hardware alone doesn’t produce yield — it’s the management process wrapped around it. Crop management is the discipline of monitoring, timing, and adjusting inputs across a growing season, and the data above shows what happens when it’s systematized: farms running guidance and VRT together are the same farms reporting the $118,000-per-1,000-acres value figure from AEM, because the equipment only pays off when it’s paired with a monitoring and decision process, not run as an isolated purchase.
Three things distinguish disciplined crop management from ad hoc input use:
- Continuous monitoring — checking crop health and soil conditions between visits rather than only at planting and harvest, via satellite indices or field sensors.
- Documented timing — recording when inputs were applied and comparing outcomes season over season, which is what makes yield-monitor data (68% adoption on large farms) actually useful rather than just collected.
- Adjustable, not fixed, input plans — variable rate application (45% adoption) responds to what a field needs zone by zone instead of a single blanket rate for the whole property.
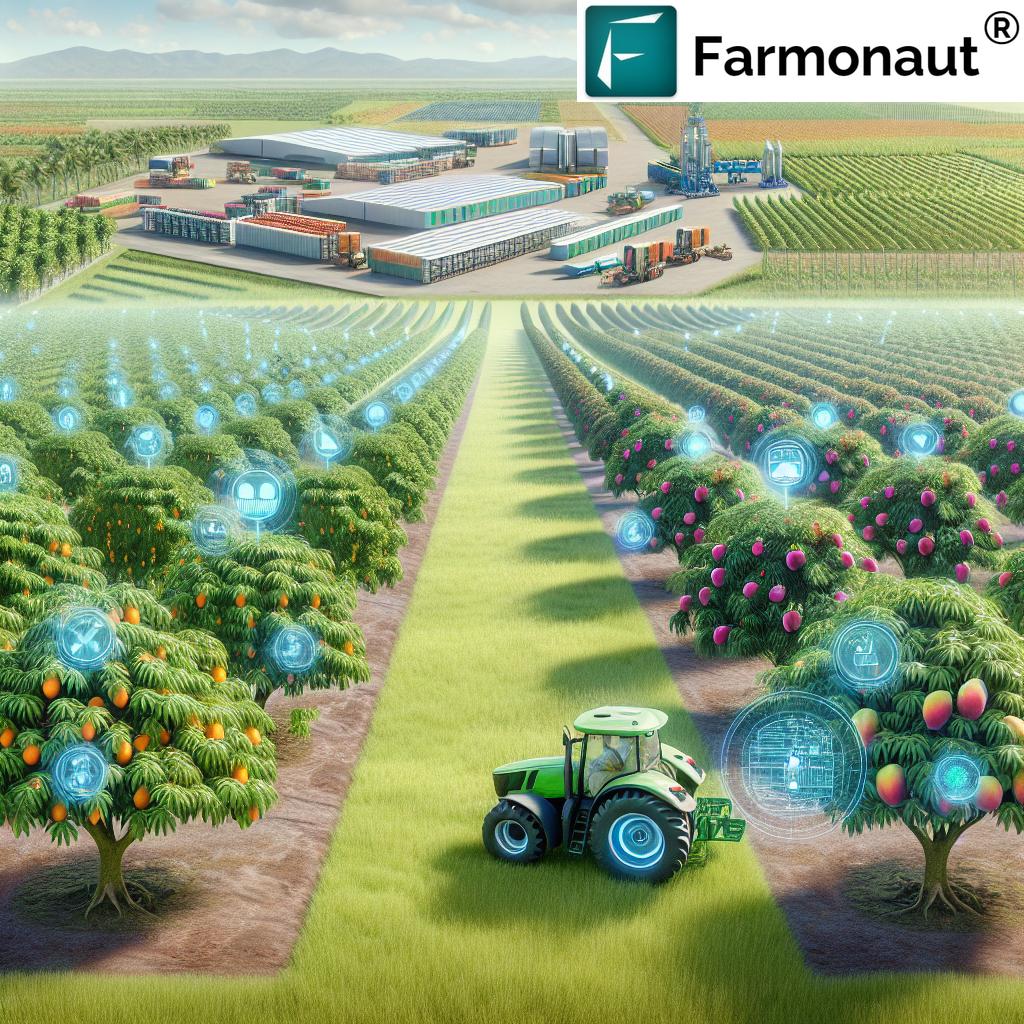
Solar-powered irrigation is one of the practical tools that supports this discipline in the field, particularly for pumping and monitoring equipment in locations without reliable grid power. See solar energy in agriculture for how these systems pair with smart irrigation scheduling.

Off-Season Cropping and the “Zaid Crop” Question
“Zaid crop examples” is a term from the South Asian cropping calendar (referring to the short summer season between the main growing seasons), and it appears in searches from readers researching cropping-calendar concepts generally. For US growers, the equivalent concept is the short-season or catch crop grown between a main harvest and the next planting — cover crops, quick-cycle vegetables, or a second planting window in longer growing zones. The management principle is the same regardless of what the season is called locally: a short window between primary crops still benefits from the same monitoring and guided-input approach described above, because a compressed season leaves less room to recover from a mistimed input application.
Precision Ag Savings Calculator
Use the figures above to estimate what guidance and variable-rate adoption could be worth on your own acreage, based on the AEM per-acre value benchmark.
Run your own numbers
Assumptions: the default $118/acre figure is AEM’s 2023 US average value from precision ag across guidance, VRT, and monitoring combined on row-crop farms — replace it with your own budget or agronomist’s estimate. This does not include equipment purchase, retrofit, or subscription costs, and results will differ for orchard/tree-fruit operations versus row crops.
Get Farmonaut on Your Mobile Device:


Traditional vs. Smart Farming: A Side-by-Side
| Farming Aspect | Traditional Method | Smart/Precision Approach | Adoption or Value Data Point |
|---|---|---|---|
| Tractor guidance | Manual steering by operator | GPS-guided autosteering | 70% of large farms, 52% of midsize farms (USDA ERS, 2023) |
| Yield tracking | Estimated at harvest by experience | Yield monitors + soil maps | 68% of large farms (USDA ERS, 2023) |
| Input application | Blanket rate across whole field | Variable rate technology (VRT) | 45% of large farms (USDA ERS, 2023) |
| Any precision practice | None | At least one precision ag method in use | 27% of all US farms (USDA ERS, 2023) |
| Soil health management | Conventional tillage every season | Conservation/no-till practices | 7-17% higher soil organic carbon over 8 years |
| Economic return | Not separately measured | Combined precision ag stack | ~$118,000 value per 1,000 acres/year (AEM, 2023) |
Modern agricultural implements extend this same logic beyond the tractor itself — harvesters, sprayers, and fruit-picking equipment increasingly carry their own guidance and monitoring layers, and planning their use around satellite-derived field data is where platforms like Farmonaut fit into daily operations.
Farmonaut Subscription Plans
Subscription plans are available for different farm sizes and monitoring needs:
Frequently Asked Questions
Q: What percentage of US farms use smart tractors with autosteering?
A: 70% of large-scale crop farms and 52% of midsize crop farms used guidance/autosteering systems in 2023, per USDA’s Economic Research Service. Across all US farms of every size, only 27% used any precision agriculture practice, so adoption is heavily weighted toward larger operations. Check the USDA ERS Charts of Note page for updated figures as newer survey years are released.
Q: How much fruit does the US produce, and what is it worth?
A: USDA NASS reported 15.84 million tons of utilized noncitrus fruit production in 2025, valued at $18.97 billion. Washington State alone produced 7.16 billion pounds of apples in 2025, roughly two-thirds of the national apple crop. For the current year’s figures, USDA NASS QuickStats (search “FRUIT, APPLES, PRODUCTION” by state and year) updates annually each summer with the prior year’s harvest data.
Q: What does a smart tractor actually cost to add to an existing tractor?
A: This isn’t centrally published — retrofit kit costs and subscription fees change seasonally with new equipment model years. Check current pricing directly through an equipment dealership’s guide or a manufacturer sales contact for your region and tractor model before budgeting.
Q: Does smart farming technology work for both row crops and tree fruit?
A: Yes, but the application differs. Row crops use field-average guidance and VRT data; orchards and vineyards need block-level or tree-level data because yield and disease pressure vary far more within a single fruit block than across an open row-crop field. Satellite vegetation-index monitoring works for both, applied at different resolutions.
Q: Is there published data on labor savings from automated harvest in orchards?
A: No centralized USDA dataset currently compares labor-hours between automated and manual harvest operations specifically for tree fruit like apples or citrus — only regional case studies exist. For a labor-cost comparison specific to your operation, track hours logged per acre across a season with and without guided equipment and compare directly.
Conclusion
The adoption numbers settle the “does this work” question: 70% of large US crop farms already run guidance systems, and AEM’s data puts a concrete value on it at roughly $118,000 per 1,000 acres annually. What the published data doesn’t yet cover — labor-hour savings in tree fruit, operator safety improvements from automated guidance, and long-term total cost of ownership by farm size — is exactly where a grower’s own record-keeping fills the gap, using the monitoring and documentation approach outlined above. Combining satellite crop monitoring with guided equipment and a documented input-timing process is what turns adoption statistics into results on a specific block or field.
From climate-adapted farming approaches to large-scale row-crop operations, the same core stack — satellite monitoring, guided equipment, and documented crop management — scales across farm sizes and crop types.


 Godrej Agrovet
 Hayleys Agriculture
 Linx Agritech
 Adinet
 Save Your Soils
 GalaxEye Space
 Grandstream Algérie
 XOS Realty
 Geospatial Lab Africa
 Agro La Gándara
 HIPSAC
 ZOL Zimbabwe
 Juligerm
 AdBio
AdBio MISE Maroc
 NWNS
NWNS Red August Group
 Farm Inc
 WeMe Global
 Agrotoken
 Blue BearX
 Insignito
 DnCubed
 Indosistim Teknologi
 Liquify Digital
 CU Foods
 BeyondTech Global
 Rouge VC
 AgroRisk
 Oath Inc
 Esri North East Africa
 MDCV UK
 Etech Consulting Madagascar
 Vestlandsforsking
 WB Dev
 Sama Premium
 Tres Valles
 Blickwinkel
 Agricultural Credit Policy Council
 eKGIS
eKGIS Mostas Tech
 Andex
Andex Deluxe Conseil
 WICO
WICO Chimera Innovation
 SkyHarvest
 Teledarbas
 Exurbia Geospatial
 FieldZero
