

Reviewed August 2026 against USDA NASS Land Values data, the NCREIF Farmland Index, and the Iowa State University Land Value Survey.
Try it: Mid-South Row Crop Value Gap & Income Calculator →
The best US farmland investment in 2025 was row crop (“annual cropland”) farmland, not permanent crop orchards and vineyards: the NCREIF Farmland Index recorded a 3.52% total return for annual cropland versus -5.43% for permanent cropland, per AgIS Capital’s March 2026 State of Returns report. National cropland averaged $5,830 an acre in 2025, up 4.7% from 2024, according to USDA figures summarized by the American Farm Bureau Federation. The rest of this guide breaks down where that gap comes from, what it means for Mid-South row crop farmland specifically, and how volatile farmland actually is once you look past the “safe asset class” pitch.
Table of Contents
- Row Crop vs. Permanent Crop Farmland Investment: What’s the Difference?
- How Much Does US Farmland Cost? 2025 Regional Values
- Best US Farmland Investment Options Compared
- Why Invest in Mid-South Row Crop Farmland
- Permanent Crop Investment: Higher Ceiling, Bigger Swings
- Farmland Investment Volatility: What the Data Shows
- Passive and Active Farmland Investment Services
- Technology, Sustainability, and Carbon Footprinting
- A Due-Diligence Checklist That Doesn’t Expire
- Farmonaut Satellite and AI Tools for Farmland Investors
- FAQ
- Conclusion
- Try it: Mid-South Row Crop Value Gap & Income Calculator
Row Crop vs. Permanent Crop Farmland Investment: What’s the Difference?
Row crop farmland investment means owning or leasing land planted in crops grown in mechanically-harvested rows — corn, soybeans, wheat, cotton, and rice are the dominant US examples — and replanted every season. Permanent crop investment means land carrying orchards, vineyards, or nut groves: almonds, pistachios, wine grapes, citrus, and similar crops that take several years to bear and then keep producing for decades. The distinction matters more than it sounds, because the two behave like different asset classes inside the same “farmland” label.
The NCREIF Farmland Index tracks them as separate sub-indices for exactly this reason. In 2025, the Annual Cropland sub-index (row crops) returned 3.52% — 2.99% from income (mostly cash rent) and 0.52% from land appreciation. The Permanent Cropland sub-index returned -5.43%, made up of a 3.24% income return and an -8.48% capital return, per AgIS Capital. That is the sixth straight year row crops have out-earned permanent crops on a total-return basis.
Both are still “farmland,” which is why generic articles lump them together. But an investor choosing between a Nebraska corn quarter-section and a California almond orchard in 2026 is making a genuinely different bet on income timing, price volatility, and water exposure — covered section by section below.
How Much Does US Farmland Cost? 2025 Regional Values
US farm real estate — all land and buildings on farms — averaged $4,350 an acre in 2025, up $180 from 2024 (a 4.3% increase), per USDA figures reported by the American Farm Bureau Federation. Cropland alone averaged $5,830 an acre (+4.7%), and pastureland averaged $1,920 an acre (+5%). Those are national averages; the state-by-state spread is what actually matters for an investment decision.
On the low end, Montana cropland averaged $1,320 an acre in 2025. On the high end, Rhode Island cropland averaged $32,900 an acre — a figure driven by development pressure on a tiny land base rather than row crop economics. Iowa, the closest thing the Corn Belt has to a benchmark, averaged $11,549 an acre statewide in 2025 (up 0.7%, or $83, from 2024), per the Iowa State University Land Value Survey, published December 9, 2025. Tennessee’s farm real estate value rose 7.7% in 2025 — the second-highest state-level growth rate that year, ahead of most of the Corn Belt.
The spread means a “best US farmland investment” answer has to be region-specific. Cheap-per-acre land in the Northern Plains carries different water and yield risk than expensive Corn Belt ground, and neither compares directly to permanent-crop California acreage priced for its water rights as much as its soil.
Best US Farmland Investment Options Compared
Investors reach US farmland through four broad vehicles, and each trades entry cost against liquidity differently:
| Vehicle | Typical Entry Point | Liquidity | Income Model | Example |
|---|---|---|---|---|
| Direct land purchase | $1,320-$32,900/acre depending on region (USDA NASS, 2025) | Low — private sale, months to close | Cash rent or crop share to a tenant farmer | A 160-acre Mid-South row crop tract bought outright |
| Farmland fund / platform | $1M-$3M per deal on institutional platforms, per the Purdue Center for Commercial Agriculture | Low-to-medium — fund lock-up, multi-year hold | Distributed cash rent plus exit appreciation | AcreTrader- or LandFund Partners-style syndications |
| Publicly traded farmland REIT | Price of one share | High — trades daily on an exchange | Dividends from portfolio-wide rent | Gladstone Land (NASDAQ: LAND) — 144 farms, 98,688 acres across 14 states as of its FY2025 10-K |
| Regional row crop partnership | Accredited-investor minimums, fund-specific | Low — multi-year fund term | Lease income across a pooled regional portfolio | Mid-South-focused managers such as LandFund Partners |
*Figures as cited above; confirm current terms directly with each named platform or filing before committing capital.
The Purdue Center for Commercial Agriculture’s March 2026 Delta series puts one platform’s portfolio at roughly 130 farms, with a target hold of 5-10 years and an underwritten internal rate of return of 7.5%-8% on standard deals — 15 properties had already exited ahead of that target hold window. That IRR target is a useful yardstick against the NCREIF Annual Cropland Index’s 3.52% one-year total return: the platform figure is a multi-year underwriting target across income and appreciation, while the NCREIF number is a single-year, broad-market result, so the two are not directly comparable, but both are worth checking before assuming either “farmland always returns X%.”
Farmland can also reach investors through an agricultural land REIT structure, which is covered in more depth in the passive-investment section below.
Why Invest in Mid-South Row Crop Farmland
The Mid-South — Tennessee, Mississippi, Arkansas, the Missouri Bootheel, Louisiana, and Kentucky — holds more than $100 billion of row crop farmland, according to LandFund Partners’ 2025 market commentary. Three things make the region distinct from Midwest row crop ground:
- Price gap to the Corn Belt. LandFund Partners’ own commentary states Mid-South row crop farmland trades for roughly 50% less than comparable Midwest farmland — a gap the firm says has persisted since at least 2013, when Midwest ground carried a 140% premium over Mid-South land.
- Water security. The Mississippi River Alluvial Aquifer underlies more than 70,000 square miles across six states and, at current use and recharge rates, is estimated to hold roughly 300 years of groundwater. LandFund Partners reports 92% of its own portfolio is irrigated from this system.
- Crop mix. Cotton, soybeans, rice, and corn dominate, giving the region a rice-and-cotton exposure that most Midwest row crop portfolios don’t carry, alongside the corn and soybeans it shares with the Corn Belt.
None of this is a guarantee — LandFund Partners is a Mid-South-focused manager describing its own market, and Tennessee’s 7.7% farm real estate growth in 2025 shows the region can outperform in a given year without proving it will every year. Treat the discount and the aquifer figures as a starting thesis to verify against current USDA NASS state-level data and, if you’re evaluating a specific tract, a local title and water-rights search.
Mid-South Row Crop Value Gap & Income Calculator
Permanent Crop Investment: Higher Ceiling, Bigger Swings
Permanent crop investment means buying land carrying an orchard, vineyard, or nut grove rather than row crops replanted each year. It behaved very differently from row crop ground through 2024 and 2025. The NCREIF Permanent Cropland Index returned -10.2% in 2024 (its worst year on record, per AgIS Capital) and -5.43% in 2025 -- two straight negative years, driven mainly by tree nuts. The 2024 decline included an almond return of -16.4% and a pistachio return of -16.5%. By 2025, the two commodities had diverged: the Almond Index posted -4.43%, its sixth consecutive annual decline, while the Pistachio Index returned to positive territory at +3.55%, its first gain after three straight losing years.
Almonds and pistachios aren't the whole permanent crop story, but tree nuts dominate the acreage and the index, which is why Gladstone Land's FY2025 10-K is a useful real-world check. The publicly traded REIT owned 144 farms totaling 98,688 acres across 14 states as of December 31, 2025, plus 55,532 acre-feet of water assets in California, with tenants growing a mix of annual row crops and permanent crops -- pistachios, almonds, blueberries, and wine grapes among them. A diversified permanent-crop portfolio like that spreads single-commodity risk (an almond downturn doesn't sink the whole REIT), but it doesn't remove the sector-wide capital-return pressure the NCREIF numbers show.
The practical takeaway: permanent crop investment carries a materially higher income return than row crops in some years (3.24% vs. 2.99% in 2025) but a far larger and more persistent capital-return risk, tied to commodity-specific gluts, water costs, and the multi-year lag before new plantings bear fruit at all.
Farmland Investment Volatility: What the Data Shows
Farmland is marketed as a low-volatility, inflation-hedging asset, and the long record supports part of that: the NCREIF Farmland Index's own multi-decade history puts its average annual return at 10.15% for 1992 through 2024, and the index posted its first-ever negative annual total return only in 2024, per AgIS Capital's State of the Market Report. That is not the same as saying farmland doesn't move. It does -- just on a different scale and timeline than equities.
The 2024-to-2025 swing shows the volatility directly. The Total Farmland Index went from -1.0% in 2024 to +0.20% in 2025. Row crops swung from a strong 5.7% in 2024 down to 3.52% in 2025. Permanent crops went from -10.2% in 2024 to -5.43% in 2025 -- an improvement, but still a second consecutive losing year.
Two things temper the "farmland is stable" pitch further. First, NCREIF is an appraisal-based index -- values come from periodic appraisals, not daily trades, which structurally smooths out short-term swings compared with a security that reprices every second. Second, the crop-type divergence above shows "farmland volatility" is really at least two different volatility profiles bundled under one label: row crops swinging in a roughly 2-6% annual band in 2024-2025, and permanent crops swinging through double-digit losses in the same window. Anyone citing a single farmland volatility number without specifying crop type is quoting a blend that no individual investor actually holds.
Passive and Active Farmland Investment Services
Most US investors access row crop or permanent crop farmland through one of two service models, and the right pick depends on how hands-on you want to be:
Passive Farmland Investment
- REITs and fund structures: An agricultural land REIT or a fund-style platform lets you buy exposure without operating the farm. Gladstone Land is the clearest public example, trading on NASDAQ under the ticker LAND against its 98,688-acre portfolio.
- Managed farmland partnerships: Regional managers like LandFund Partners or platforms like AcreTrader source the land, negotiate the lease, and handle tenant relationships; you supply capital and receive a share of rent and eventual sale proceeds.
- Income structure: Cash rent and flex-rent leases are the most common income model in the Mid-South and Midwest; profit-share and crop-share arrangements are more common on owner-operated or smaller managed tracts.
Active Farmland Investment
Direct ownership with a hired operator or your own management gives full control over crop choice, lease terms, and capital improvements, but it also means carrying the title work, water-rights verification, and tenant sourcing yourself -- or paying a management fee to a firm that does it for you. Whichever model you choose, monitoring farm-level satellite data through a satellite data API and coordinating logistics through fleet management tools reduces the oversight gap between passive capital and active operators.
Technology, Sustainability, and Carbon Footprinting
Regardless of crop type or ownership vehicle, three technology layers are increasingly part of underwriting a US farmland deal:
- Satellite crop monitoring: Multispectral imagery and vegetation indices let an investor check a tenant's actual in-season crop health and stress against the yields claimed in a lease pitch, rather than taking the seller's word for it.
- Carbon and sustainability tracking: Carbon footprinting tools quantify sequestration and input use on a given tract, which increasingly feeds into carbon-credit eligibility and, on some deals, lender or buyer sustainability requirements.
- Traceability and financing: Blockchain-based traceability tools support export-market premiums for row crop output, while satellite-verified crop loan and insurance services can speed up financing and claims on a leveraged purchase.
Integrating agroforestry practices on field margins is one of the more common ways row crop operations are adding a secondary income stream and soil-health buffer without converting productive row crop acreage to permanent crops outright.

Watch on YouTube: Regenerative Agriculture -- Carbon Farming, Soil Health & Climate-Smart Solutions
A Due-Diligence Checklist That Doesn't Expire
Prices, returns, and discounts in this guide will move every time USDA and NCREIF publish new data. The checklist below is the part that stays useful regardless of what next year's numbers say:
- Verify title and water rights through a county recorder and title company before signing anything -- unclear title is the single most common way a farmland deal turns expensive.
- Pull the current USDA NASS Land Values Summary for the state and county in question, and cross-check it against your state land-grant university's own survey where one exists (Iowa's, for instance, goes granular to the county level).
- Match crop type to your income timeline. Row crops pay out annually; permanent crops take years to bear and can swing through multi-year losing streaks, as 2024-2025 almond and pistachio data show.
- Check the current NCREIF Farmland Index release for the specific crop-type sub-index before assuming last year's return will repeat -- row crop and permanent crop performance have diverged for six straight years and there's no guarantee that continues.
- Confirm irrigation source and water-right seniority, especially on Mid-South tracts drawing from the Mississippi River Alluvial Aquifer or on any Western permanent-crop ground.
- Decide your lease structure -- cash rent, flex rent, or crop share -- before you decide your ownership vehicle, since some fund structures are built around one lease type by default.
- Use satellite monitoring and a farm management platform to verify a tract's actual multi-season performance, and pull live feeds through the satellite and weather API if you're managing more than one property.

Watch on YouTube: The Future of Farming -- Satellites, AI, and Geotagging

Watch on YouTube: Land Cover Classification and Farm Land Types
Farmonaut Satellite and AI Tools for Farmland Investors
Farmonaut's platform is built for exactly the oversight gap described above -- the distance between capital and the field it's invested in.
- Satellite-based monitoring: Multispectral imagery tracks row crop and permanent crop health (including NDVI), helping flag stress or disease before it shows up in a yield report.
- Jeevn AI advisory: On-platform advisory adjusts recommendations to weather and market conditions across a portfolio of leased or managed tracts.
- Blockchain traceability: Supply-chain traceability supports export-market access and premium buyer relationships for row crop output.
- Fleet and resource management: Logistics tools cut operating costs for multi-site managed or active farmland positions.
- Carbon tracking: Carbon footprint monitoring supports sustainability reporting and carbon-credit eligibility for both row crop and permanent crop operations.
These tools sit alongside Farmonaut's broader precision agriculture stack, accessible via web, mobile, and API.




Watch on YouTube: Farmonaut Affiliate, Passive Income & Recurring Commission

Watch on YouTube: How AI Drones Are Saving Farms & Millions

Watch on YouTube: How Soil & Water Shape Agricultural Success
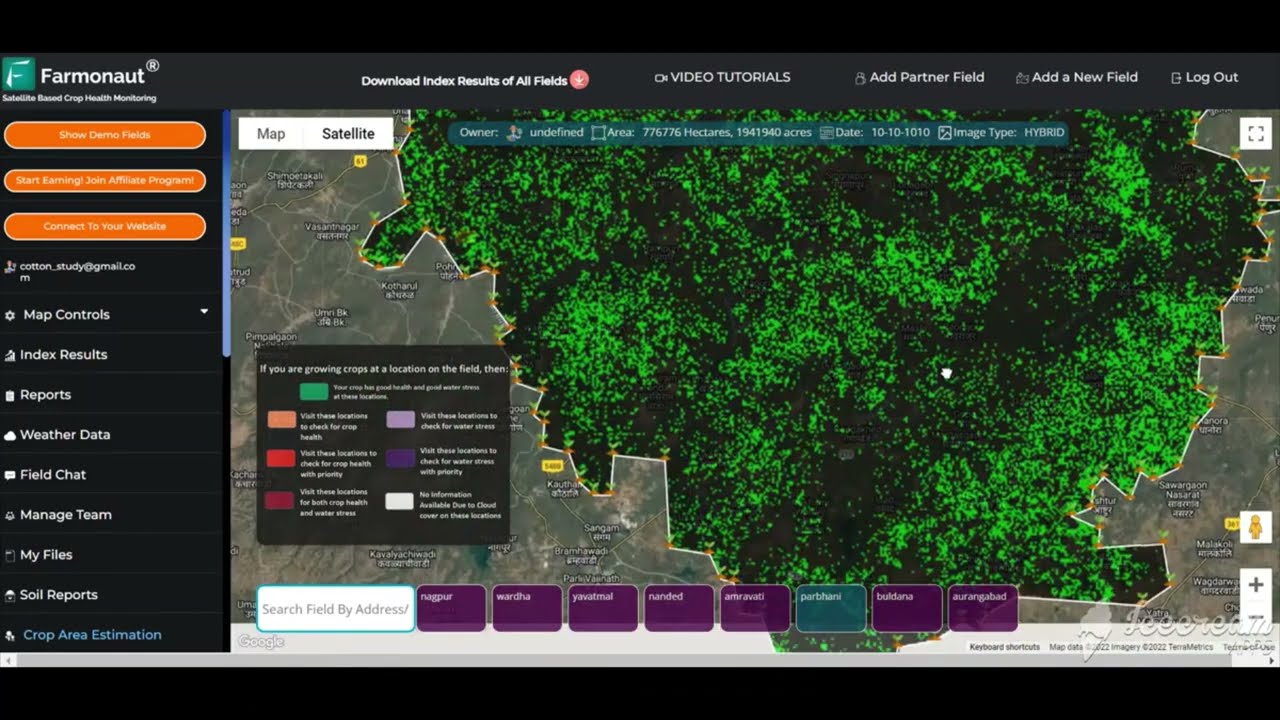
Watch on YouTube: Farmonaut for Crop Area Estimation
FAQ
What is the best US farmland investment right now?
It depends on what you're optimizing for. On 2025 total return, row crop (annual cropland) beat permanent cropland by nearly 9 points on the NCREIF Farmland Index (3.52% vs. -5.43%). On liquidity, a publicly traded REIT like Gladstone Land beats direct land purchase or a fund. On price relative to the Corn Belt, Mid-South row crop farmland carries the discount described above. There is no single answer that covers all three.
Is row crop farmland investment better than permanent crop investment?
On total return, row crops have out-earned permanent crops for six consecutive years through 2025, per the NCREIF Farmland Index. Permanent crops carried a higher income return in 2025 (3.24% vs. 2.99%) but a much larger capital-return loss (-8.48% vs. +0.52%), driven mainly by almond and, in prior years, pistachio price weakness.
How volatile is farmland as an investment?
Less volatile than equities on the published index, but not flat. The NCREIF Total Farmland Index posted its first-ever negative annual return in 2024 (-1.0%) before recovering to +0.20% in 2025. Row crop and permanent crop sub-indices moved on different, and sometimes opposite, tracks across those two years -- treat "farmland volatility" as at least two separate profiles, not one number.
Why invest in Mid-South row crop farmland?
Mainly price and water: LandFund Partners' 2025 commentary puts Mid-South row crop farmland at roughly half the per-acre price of comparable Midwest ground, sitting above the Mississippi River Alluvial Aquifer, an irrigation source estimated to hold around 300 years of groundwater at current use rates.
What is permanent crop investment?
Buying or leasing land carrying an orchard, vineyard, or nut grove -- almonds, pistachios, wine grapes, and citrus are the largest US categories -- rather than land replanted with row crops each season. It trades a multi-year wait for bearing age against a higher long-run income ceiling once established.
How much does US farmland cost per acre?
USDA figures put the 2025 national cropland average at $5,830 an acre, ranging from $1,320 in Montana to $32,900 in Rhode Island. Iowa, a Corn Belt benchmark, averaged $11,549 an acre statewide in 2025. Check the current USDA NASS Land Values Summary for your specific state, since these figures update annually.
How can I invest in US farmland without buying a whole farm?
Publicly traded farmland REITs (like Gladstone Land), farmland investment platforms, and regional managed partnerships all let investors buy fractional or pooled exposure. See the comparison table above for entry points and liquidity trade-offs, and Farmonaut's REIT guide for more on the fund-based route.
Where can I access Farmonaut's monitoring tools?
Via Web App, Android App, iOS App, and the satellite data API.






Conclusion
The data supports a specific, non-obvious answer to "best US farmland investment": row crop farmland has out-earned permanent crop farmland on total return for six straight years, national cropland prices keep climbing (up 4.7% in 2025 alone), and the Mid-South offers a real, if unproven-forever, price discount against the Corn Belt backed by a genuinely large irrigation reserve. None of that makes farmland volatility-free -- the index's first negative year on record came in 2024, and permanent crops are on their second straight losing year through 2025.
What holds up regardless of which way next year's NCREIF release or USDA summary moves is the checklist: verify title and water rights, match crop type to your income timeline, check the current sub-index before assuming last year repeats, and use satellite monitoring to confirm a tract's actual performance rather than a seller's pitch. Revisit the USDA NASS Land Values Summary and the NCREIF Farmland Index directly before acting on any figure in this guide -- both update on a regular published schedule, and by the time you're reading this, newer numbers likely exist.
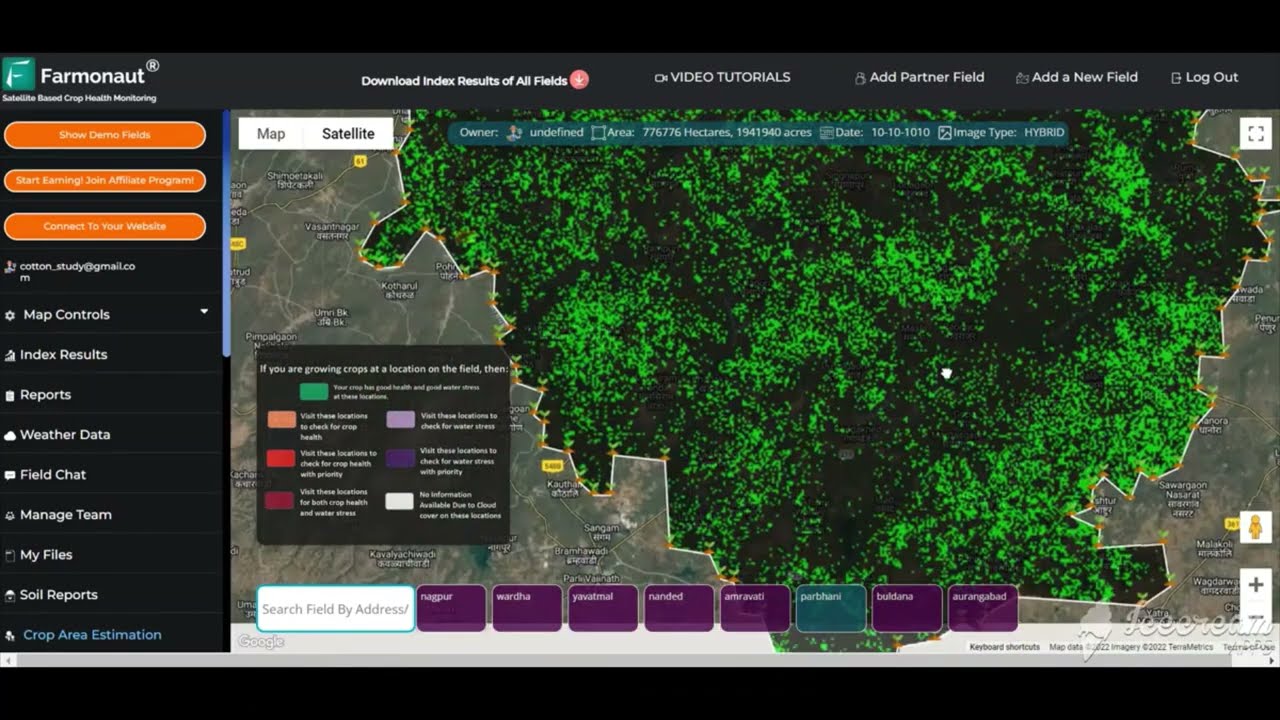
Watch on YouTube: Farmonaut for Crop Area Estimation

 Godrej Agrovet
 Hayleys Agriculture
 Linx Agritech
 Adinet
 Save Your Soils
 GalaxEye Space
 Grandstream Algérie
 XOS Realty
 Geospatial Lab Africa
 Agro La Gándara
 HIPSAC
 ZOL Zimbabwe
 Juligerm
 AdBio
AdBio MISE Maroc
 NWNS
NWNS Red August Group
 Farm Inc
 WeMe Global
 Agrotoken
 Blue BearX
 Insignito
 DnCubed
 Indosistim Teknologi
 Liquify Digital
 CU Foods
 BeyondTech Global
 Rouge VC
 AgroRisk
 Oath Inc
 Esri North East Africa
 MDCV UK
 Etech Consulting Madagascar
 Vestlandsforsking
 WB Dev
 Sama Premium
 Tres Valles
 Blickwinkel
 Agricultural Credit Policy Council
 eKGIS
eKGIS Mostas Tech
 Andex
Andex Deluxe Conseil
 WICO
WICO Chimera Innovation
 SkyHarvest
 Teledarbas
 Exurbia Geospatial
 FieldZero
