

Farmland Management Services: What They Cost, and What Farmland Is Worth
Reviewed August 2026 against USDA NASS land-value data, the NCREIF Farmland Index, and Soil Health Institute/NACD farm economics research.
Try it: Manager Fee vs. Self-Managed: Run Your Own Numbers →
Farmland management services are fee-based businesses — farm management companies, in industry language — that run leasing, tenant selection, compliance checks, and crop-marketing decisions for an owner, for a fee of 5% to 10% of gross rent or crop-sale revenue, according to the Farmland Investor Center. Farmland has also become a wealth-management asset class in its own right: U.S. farm real estate averaged $4,350 per acre in 2025, up 4.3% from 2024, and pension funds track its performance through the same NCREIF Farmland Index used to benchmark institutional real-estate holdings. This page breaks down what a management service does, what farmland has returned as an asset, and where soil health data changes both figures.
Cropland moved faster than the national average: it averaged $5,830 per acre in 2025, up $260 (4.7%) from 2024, while pastureland rose 5% to $1,920 per acre — the fifth straight annual increase — per the American Farm Bureau Federation’s reading of the USDA NASS survey. The chart below plots both figures across the two years most relevant to a management decision made today.
Table of Contents
- What Farmland Management Services Include
- Farmland as a Wealth-Management Asset
- Soil Health Management Systems: The Foundation Under the Numbers
- Why the Management Decision Is Getting More Urgent
- The Technology Layer: Satellite and AI Monitoring
- Calculator: Manager Fee vs. Doing It Yourself
- FAQs
- Conclusion
- Try it: Manager Fee vs. Self-Managed: Run Your Own Numbers
What Farmland Management Services Include
A farmland management company folds together a specific set of jobs an absentee or first-generation owner would otherwise have to learn: selecting and vetting a tenant, negotiating the lease itself (cash rent, crop-share, or a flex arrangement), verifying farm-program compliance on site, reviewing input purchases and insurance, marketing the crop, and producing a year-end financial statement. That is the breakdown given by the Farmland Investor Center’s landowner guide to hiring a manager. For that bundle, the fee runs 5% to 10% of gross rent revenue or net crop-sale proceeds — the exact rate set by local competition among managers, the lease type, and how many of those jobs are included.
Not every owner wants to hand over that many decisions. A growing number keep the decisions and pay only for the data layer — a satellite and AI monitoring subscription that flags nutrient stress, tracks soil moisture, and forecasts weather by field, without taking a cut of revenue. The table below lines up the four structures owners actually choose between.
| Approach | Cost Structure | Who Makes Day-to-Day Calls | Data You See | Best Fit |
|---|---|---|---|---|
| Full-service farm manager | 5%–10% of gross rent or crop-sale revenue | Manager, within owner-set guardrails | Lease terms, compliance records, annual statement | Absentee, inherited, or out-of-state owners |
| Self-managed + satellite/AI app | Flat subscription, not a share of revenue | Owner | NDVI, soil moisture, weather, nutrient-stress alerts | Owner-operators who want the data but keep control |
| Hybrid: part-time consultant + tech platform | Consultant day rate or reduced fee, plus subscription | Owner, advised | Both a manager’s judgment and the raw field data | Owners transitioning out of day-to-day farming |
| Farmland investment fund or REIT | Fund management fee, disclosed in that fund’s own filings | Fund manager | NCREIF-benchmarked portfolio return | Investors who want farmland exposure without holding title |
Farmland as a Wealth-Management Asset
“Wealth management” and “farmland” intersect in a specific way: institutional investors already hold farmland inside pension-fund and endowment portfolios, and they benchmark it through the NCREIF Farmland Index, which the index’s own methodology page describes as tracking properties “acquired, at least in part, on behalf of tax-exempt institutional investors — the great majority being pension funds.” For 2025, that index posted a 0.20% total annual return, made up of a 3.05% income return and a −2.80% capital return, according to AgIS Capital’s March 2026 read of the full-year NCREIF data.
Those two data sources answer different questions, and knowing which is which is the actual durable skill here. NCREIF marks a defined pool of institutionally held cropland and permanent-cropland parcels to market every quarter — it is a return measure. USDA NASS surveys a much broader sample of all U.S. agricultural land once a year and reports an appraised value level, not a return. That is why the same year can show NCREIF income and capital returns nearly offsetting each other while NASS still records farm real estate up 4.3% nationally: one measure is a narrower, income-weighted return series; the other is a broad appraisal snapshot. Whenever a newer NCREIF or NASS release comes out, checking which of the two you are looking at will keep you from comparing the wrong numbers.
The practical read for a wealth-management conversation: farmland’s 2025 return leaned almost entirely on rent income rather than price appreciation inside the NCREIF pool, even as the broader NASS-surveyed land market kept climbing. A soil-health program that lifts net farm income per acre — covered next — moves the income side of that equation directly, which is the lever an owner actually controls between now and the next land re-appraisal.
Soil Health Management Systems: The Foundation Under the Numbers
A soil health management system is a three-step method, not a single product: test the field’s physical, chemical, and biological properties; match nutrients, organic matter, and tillage to what that test actually shows; and repeat the test on a schedule instead of applying the same input every season by default. That framework is what the term means whether the field is in the U.S. Corn Belt or anywhere else the phrase gets searched.
The National Association of Conservation Districts’ 2023 executive summary of the Soil Health Institute’s economics research, covering 30 U.S. producers (25 of them NACD Soil Health Champions), found it cost $14 less per acre to grow corn and $7 less per acre to grow soybeans after adopting a soil health system, with average net farm income across all 30 farms and crop types up $65 per acre.
That $65-per-acre income gain is exactly the kind of figure a farm manager’s annual statement or a NCREIF income-return calculation would pick up — it is a wealth-management input, not a separate topic from the fee and return numbers above. Cover cropping and reduced tillage, two of the practices behind those figures, overlap heavily with organic and sustainable farming practices, though a field does not need formal organic certification to adopt either one.


Why the Management Decision Is Getting More Urgent
The reason management quality matters more with each passing appraisal cycle is supply. From 2001 through 2016, the U.S. lost or compromised 2,000 acres of farmland and ranchland every day, according to American Farmland Trust. Its Farms Under Threat 2040 modeling projects that trend converting another 18.4 million acres of farmland and ranchland between 2016 and 2040 under a business-as-usual scenario — an area comparable to South Carolina — rising past 24 million acres under an accelerated-sprawl scenario, or falling by up to 13.5 million fewer acres converted if development follows a smart-growth path instead.
Fewer convertible acres means the working farmland that remains carries more of the country’s agricultural capital, which is the structural reason both farm-management fees and monitoring-tech subscriptions have grown alongside land values rather than shrinking as a share of them.

The Technology Layer: Satellite and AI Monitoring
Whether or not an owner hires a fee-based manager, the monitoring layer beneath the decision has shifted from windshield surveys to satellite data. Farmonaut’s platform applies multispectral imagery to track NDVI-based vegetation health, soil moisture, and nutrient stress by field, pairs it with a weather-driven advisory (Jeevn AI) for irrigation and amendment timing, and logs input history on a blockchain ledger for downstream buyers or lenders who want to verify it.




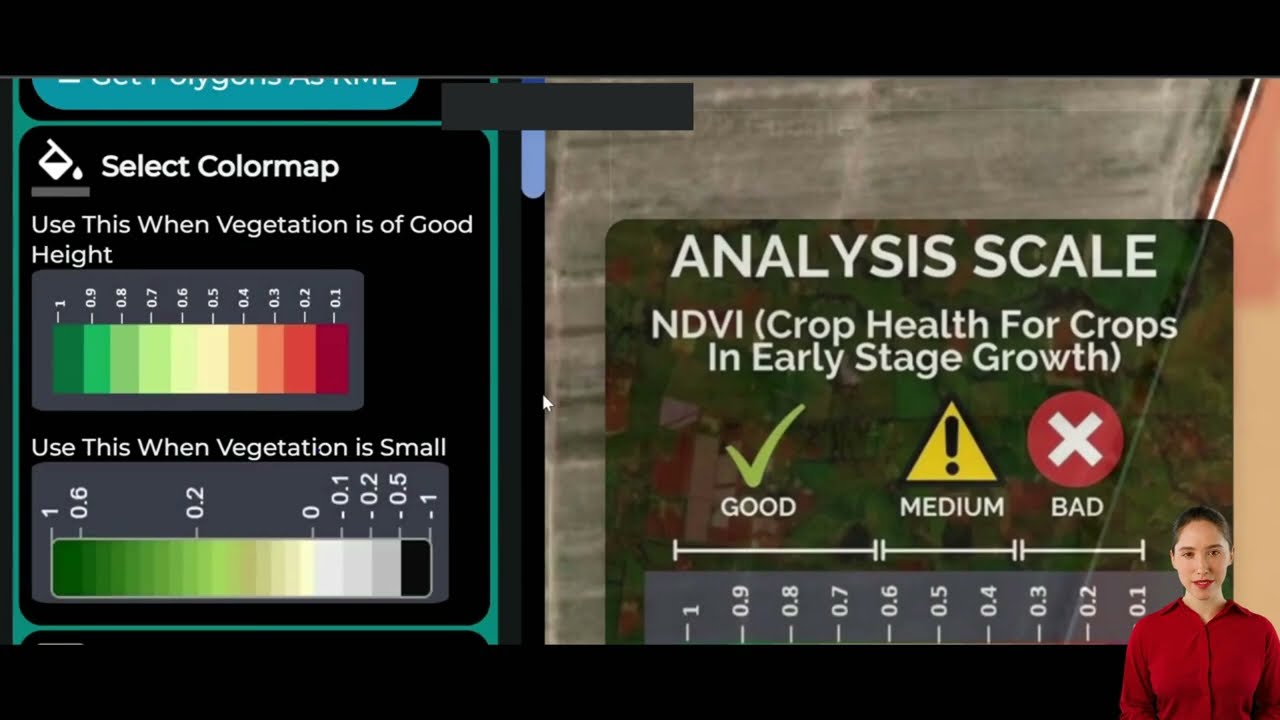
Beyond field monitoring, several Farmonaut products map directly onto the services a fee-based farmland manager would otherwise bundle:
- 🌍 Carbon Footprinting — tracks and reports emissions data that increasingly feeds into land-value and lender assessments.
- 🔗 Traceability Solution — documents input and handling history for buyers who verify supply chains before purchase.
- 💲 Crop Loan & Insurance — uses satellite field verification to speed up credit and claims processing.
- ⚙️ Fleet Management — schedules machinery and reduces operating costs across multi-field operations.
For operations too large for a single dashboard, Farmonaut’s large-scale farmland and forestry management suite centralizes multi-field oversight — the same coordination job a full-service farmland management company sells, delivered as software. Developers and agri-tech businesses can pull the underlying imagery and AI outputs directly through the Farmonaut API, documented at the developer docs.

Calculator: Manager Fee vs. Doing It Yourself
Run your own acreage and revenue through the numbers above to see where a percentage-fee manager and a soil-health income gain land relative to each other before you sign anything.
Manager Fee vs. Self-Managed: Run Your Own Numbers
Assumes the Soil Health Institute/NACD 30-farm average of $65 per acre net income gain as a default; your own result will differ by soil type, crop mix, and region. Excludes land appreciation, taxes, financing costs, and any one-time cost of switching practices.
FAQs
Q1: What do farmland management services cost, and what's included?
Full-service farm management companies charge 5% to 10% of gross rent revenue or net crop-sale proceeds, covering tenant selection, lease negotiation, compliance verification, input and insurance review, crop marketing, and annual financial reporting, per the Farmland Investor Center's landowner guide cited above. The rate within that range depends on local competition among managers and how many services are bundled in.
Q2: Is farmland a good wealth-management asset compared with stocks?
Farmland behaves differently from equities: it is held inside pension-fund and institutional portfolios and benchmarked through the NCREIF Farmland Index, which posted a 0.20% total return for 2025 (3.05% income, −2.80% capital) — a return profile driven mostly by rent income rather than price swings, unlike a typical equity index. USDA's separately calculated NASS appraisal survey still showed nationwide farm real estate values up 4.3% over the same period, since it measures level, not return.
Q3: What is a soil health management system?
It is a three-step method: test soil's physical, chemical, and biological properties; match nutrients, organic matter additions, and tillage to what the test shows instead of applying a flat input program; and retest on a schedule. The National Association of Conservation Districts' 2023 summary of Soil Health Institute research found this raised net farm income by an average of $65 per acre across 30 U.S. farms.
Q4: Is a "soil health management system" the same everywhere, including places like Bihar?
The diagnostic method itself — test, then match inputs to the result, then retest — is universal and is what the phrase means wherever the field is. What differs by country is the policy and subsidy layer wrapped around it. This page focuses on U.S. figures (USDA NASS, NCREIF, the Soil Health Institute) rather than any other country's programs, so readers outside the U.S. should confirm local numbers with their own agricultural extension service.
Q5: What does Farmonaut do for farmland management?
Farmonaut provides the monitoring and advisory layer — satellite-based NDVI and soil-moisture tracking, AI-driven irrigation and nutrient advisories, blockchain input records, and tools for carbon footprinting, traceability, crop loan/insurance verification, and fleet management — available as a subscription rather than a percentage-of-revenue fee, through its web, Android, and iOS apps and its developer API.
Q6: How much U.S. farmland is actually at risk of disappearing?
American Farmland Trust recorded 2,000 acres of farmland and ranchland lost or compromised per day between 2001 and 2016, and its Farms Under Threat 2040 model projects 18.4 million more acres converted by 2040 under current trends, rising past 24 million under accelerated sprawl, or falling by up to 13.5 million fewer acres converted under smart-growth land-use policy.
Q7: Should I hire a manager, use software myself, or both?
That depends on how much of the six-job bundle above you want to hand off versus keep. Absentee or first-generation owners typically value a full-service manager's on-the-ground judgment enough to pay the 5%–10% fee; owner-operators who already handle leasing and compliance often keep that fee and pay only for the monitoring subscription; a hybrid — part-time consultant plus a platform — suits owners mid-transition. The calculator above runs your own acreage and revenue through both structures.
Conclusion: Treat Farmland Management as a Numbers Decision
Farmland management services, farmland as a wealth-management asset, and soil health data are one decision, not three separate topics. A management fee, an NCREIF-style return, and a soil-health income gain all move the same bottom line — what the land throws off in a given year and what it appraises for the next time USDA or a private appraiser looks at it. The figures above (USDA NASS via the American Farm Bureau Federation, the NCREIF Farmland Index via AgIS Capital, American Farmland Trust, and the Soil Health Institute via NACD) are each on their own publication cycle — NASS republishes land values every August, NCREIF reports quarterly, and AFT and the Soil Health Institute update their research periodically — so check the linked sources directly before using any of these numbers in a lease negotiation or investment memo.
Start with the calculator above using your own acreage, then explore Farmonaut's farmland monitoring tools on Android, iOS, or the web to see the field-level data behind the numbers.

 CGIAR
CGIAR Hayleys Agriculture
 Linx Agritech
 Adinet
 Save Your Soils
 GalaxEye Space
 Grandstream Algérie
 XOS Realty
 Geospatial Lab Africa
 Agro La Gándara
 HIPSAC
 ZOL Zimbabwe
 Juligerm
 AdBio
AdBio MISE Maroc
 NWNS
NWNS Red August Group
 Farm Inc
 WeMe Global
