

Reviewed September 2026 against SARE (Sustainable Agriculture Research and Education), USDA NRCS, and University of Wisconsin Extension.
Try it: Enter your field data above to see estimated reduction. →
Slope Runoff Management: 10 Practices, Ranked by Data

Slope runoff management works when it changes two measurable things on a field: how much water leaves as surface runoff, and how much sediment that water carries. Cover crops alone cut runoff volume by 50% on average across 82% of the experiments reviewed by SARE, and cut sediment loss by 20.8 tons/acre on conventional-till fields compared with bare soil. Combine conservation tillage with cover crops and soil loss drops 89% versus conventional tillage. Those are the numbers this article is built around, and they hold up regardless of what an AI summary tells you “generally” happens.
This is also the place to address a specific search that keeps landing here: readers looking for ABARES “experimental farmlands” data — the Australian Bureau of Agricultural and Resource Economics and Sciences farm survey program covering the northern cropping region — will not find that dataset published in the sources reviewed for this piece. ABARES runs its own farm survey database separately from the runoff literature cited below, and that database is the correct place to pull region-specific experimental farmland results; it is not summarized in SARE, USDA NRCS, or Wisconsin Extension publications. If you need the northern cropping region figures specifically, go to ABARES directly rather than a US-focused runoff comparison — treat this paragraph as the honest answer to that query, not a redirect that pretends to have the data.
For farmers in the US and New Zealand asking the practical question — “how do I manage runoff and what does the fix actually cost me in yield, labor, or dollars” — the rest of this article answers that with USDA, SARE, and Extension figures, a comparison table, a runoff-reduction calculator, and the 10 practices ranked by what they actually change.
Table of Contents
- The Scope of Farm Runoff
- 10 Runoff Management Practices, Ranked
- Runoff Reduction Calculator
- Comparison Table
- Best Management Practices: What the Term Actually Means
- Where Satellite Monitoring Fits
- FAQ
- Try it: Enter your field data above to see estimated reduction.
The Scope of Farm Runoff
Farm runoff — water moving across cropland surface rather than infiltrating — carries three things off a field: topsoil, dissolved nutrients, and whatever crop protection product was recently applied. The mechanism is well studied because it is expensive on both ends: the farmer loses fertile soil and the input dollars invested in it, and downstream water bodies absorb the sediment and nutrient load. In the northern cropping regions of the US corn belt and the equivalent slope-cropped ground in New Zealand’s North Island, the trigger conditions are the same: bare or lightly-covered soil, a slope steep enough to concentrate flow, and a rainfall event that exceeds the soil’s infiltration capacity at that moment.
Two thresholds from Wisconsin Extension’s 2024 review put numbers on when cover crop biomass actually changes the outcome: fields need roughly 1,200 lb/acre of cover crop dry matter before erosion reduction becomes significant, and roughly 2,500 lb/acre before runoff volume itself drops. Below those thresholds, a cover crop is still building soil biology, but it is not yet doing the mechanical job of slowing water. That is a concrete planning number for a farmer deciding whether a late-planted cover crop will do anything before the ground freezes.
On slope itself, SARE’s soil-building guidance sets a practical row-gradient target: keep crop rows on a 1.5–2% slope gradient where possible, and treat anything above 4–5% as needing a structural intervention — terracing, contour rows, or a permanent grassed waterway — rather than relying on cover and rotation alone. That threshold is the actual answer to “slope runoff management”: below roughly 2% grade, biological practices (cover crops, residue, rotation) carry most of the load; above 4–5%, water moves fast enough that only earthwork and permanent vegetation reliably hold it.
10 Runoff Management Practices, Ranked
These are ordered by the strength of the evidence behind each one, not by popularity. Numbers 1 and 2 have the most direct field-trial support cited in this brief; numbers 8–10 are structural practices that are effective but whose specific reduction percentages were not in the sources reviewed here.
1. Cover Crops
Cover crops are grown specifically to hold ground between cash crop cycles, and they carry the strongest evidence base of any practice in this list. Across the SARE studies reviewed, cover crops reduced runoff volume by an average of 50% in 82% of the experiments; reduced sediment loss by 20.8 tons/acre on conventional-till fields; reduced nitrogen loss by a median of 48% across 10 studies; and reduced sediment loading by 75% compared with bare soil. University of Wisconsin Extension separately measured a delay in runoff timing of 10–40 minutes during precipitation events where cover crop biomass was established — meaning the same storm produces a later, often smaller peak flow.
Species selection for cash crop rotations depends on your climate window and whether nitrogen fixation is a goal (legumes) or erosion control alone is the goal (cereal rye, oats). The dry-matter thresholds above (1,200 lb/acre for erosion, 2,500 lb/acre for runoff volume) are the numbers to plan a seeding rate and termination date against.
2. Reduced Tillage / No-Till
Reduced tillage preserves surface residue and soil structure instead of disturbing them every season. On its own it improves infiltration and reduces erosion; combined with cover crops, SARE’s reviewed studies found an 89% reduction in soil loss compared with conventional tillage. That combination — not either practice alone — is the figure worth planning around if soil loss is the primary metric you’re trying to move. See no-till farming benefits for the mechanics of transitioning a rotation.
3. Contour Farming
Planting and cultivating along the contour rather than up-and-down slope keeps water moving slowly across the field instead of channeling it straight downhill. It is most effective at the 1.5–2% row gradient SARE identifies as optimal, and becomes progressively less sufficient on its own as slope approaches the 4–5% threshold where structural measures take over. Full mechanics and layout guidance: contour farming benefits.
4. Crop Rotation
Rotating crop species changes root architecture, residue type, and pest pressure year to year, which indirectly supports the infiltration gains covered below. It is the lowest-cost practice on this list to implement since it requires no new infrastructure or annual seed cost beyond the rotation crop itself, but its runoff-specific reduction was not isolated as a standalone figure in the sources reviewed — its main measured benefit here is structural and biological (soil health, pest cycle disruption) rather than a direct sediment or volume number. Broader system design context: farming systems innovations.
5. Soil Health Management (Infiltration-Focused)
USDA NRCS-tracked soil health management practices — cover cropping, reduced disturbance, and diversified rotation in combination — produced a mean infiltration rate increase of 34.8% in the 2022 study published via NCBI/PMC, with some systems reaching up to a 6.5-fold infiltration improvement where cover crops were paired with the most aggressive soil health management. Infiltration is the other half of the runoff equation: every gallon that soaks in is a gallon that does not carry sediment downstream.
6. Riparian Buffer Zones
Permanent vegetation strips along watercourses filter sediment and nutrients out of runoff before it reaches a stream, pond, or drainage ditch. They double as wildlife corridors and provide stream shading that moderates water temperature — relevant for any farm near a fish-bearing waterway subject to state water-quality rules.
7. Filter Strips
Filter strips do the same job as riparian buffers but sit at the field edge rather than along a watercourse specifically, catching sediment before it leaves cultivated ground at all. They are comparatively cheap to establish since they use existing field margins.

8. Vegetated Waterways
Grassed or vegetated channels carry concentrated flow across agricultural land without cutting a gully. They are the standard fix wherever contour rows or terraces funnel water to a low point that would otherwise erode.

9. Terracing
Terracing is the structural answer once slope exceeds the 4–5% threshold where row-based practices stop being sufficient on their own. It requires the largest upfront capital investment of any practice on this list but converts unfarmable steep ground into a series of level, croppable platforms.
10. Sediment Basins and Constructed Wetlands
These are last-line structures: engineered basins or wetland cells that catch whatever sediment escaped every upstream practice. They are the most expensive and highest-maintenance items on this list, appropriate where a farm sits directly upslope of a sensitive waterway and the earlier nine practices need a backstop, not a replacement.
Runoff Reduction Calculator
Enter your field size and current ground cover situation to see an estimated runoff volume and sediment loss reduction, based on the SARE and USDA figures cited above (50% average runoff volume reduction, 20.8 tons/acre sediment reduction on conventional-till fields, 89% soil loss reduction when cover crops are paired with reduced tillage).
Enter your field data above to see estimated reduction.
Assumptions: figures are drawn from SARE’s 2024 cover-crop meta-analysis and apply to conventional-till baseline fields; results on fields already using reduced tillage, no-till, or existing conservation practices will differ from these averages. This calculator does not account for local soil type, slope, or rainfall intensity, and does not estimate yield or dollar cost — it estimates physical runoff and sediment reduction only.
Comparison Table
| Practice Name | Implementation Difficulty | Cost Effectiveness | Soil Health Impact | Water Quality Improvement | Erosion Control Effectiveness |
|---|---|---|---|---|---|
| Cover Crops | Easy | Medium | High | Medium | Medium |
| Reduced Tillage | Moderate | High | High | Medium | High |
| Contour Farming | Moderate | High | Medium | Medium | High |
| Crop Rotation | Easy | High | High | Medium | Low |
| Soil Health Management | Moderate | High | High | Medium | Medium |
| Riparian Buffer Zones | Moderate | Medium | Medium | High | High |
| Filter Strips | Easy | High | Low | High | Medium |
| Vegetated Waterways | Moderate | Medium | Medium | High | High |
| Terracing | Difficult | Low | High | Medium | High |
| Sediment Basins / Constructed Wetlands | Difficult | Low | Low | High | High |
Best Management Practices: What the Term Actually Means
“Best management practices” (BMPs) in US and New Zealand agriculture is not a single fixed checklist — it is a regulatory and technical term for the set of practices a given state, catchment authority, or extension service has identified as effective for a specific pollutant or resource concern in a specific region. In the US, individual state departments of agriculture and NRCS field offices publish region-specific BMP guidance tied to their own soil surveys and watershed priorities; in New Zealand, regional councils publish freshwater farm plan requirements under the National Policy Statement for Freshwater Management, with the specific practices required varying by catchment.
What is consistent across every BMP program reviewed here is the underlying physics: reduce bare soil exposure, slow water velocity, and increase infiltration. Every practice ranked above is a BMP in some jurisdiction’s published guidance. The number that should anchor a farmer’s BMP conversation with a local agency is the 1.5–2% optimal row slope and the 4–5% threshold above which structural practices become necessary — those SARE-published figures are jurisdiction-independent because they describe hydrology, not policy.
If you are asked to document BMP compliance, the two things worth having on file are: (1) cover crop dry matter estimates against the 1,200 lb/acre and 2,500 lb/acre thresholds above, and (2) a slope map of your fields showing which acres sit above the 4–5% gradient line. Both are things a satellite-based monitoring platform can help track over a season, which is where the next section picks up.
Where Satellite Monitoring Fits
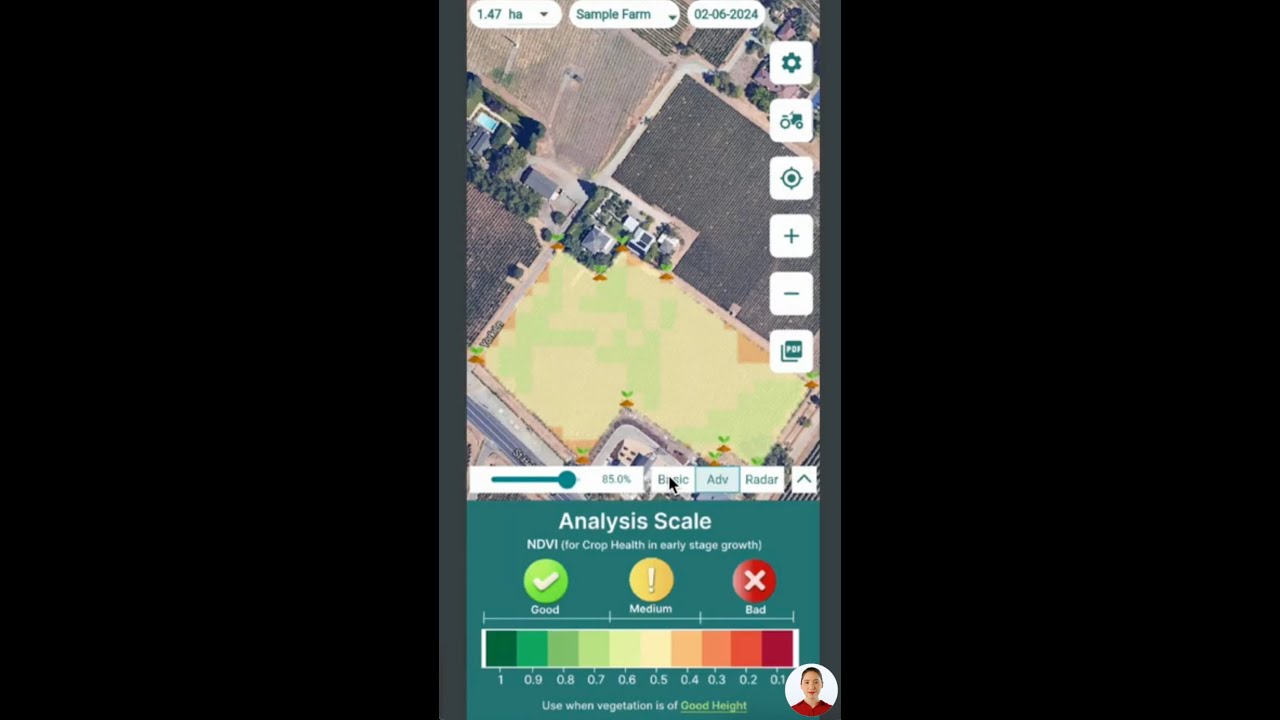
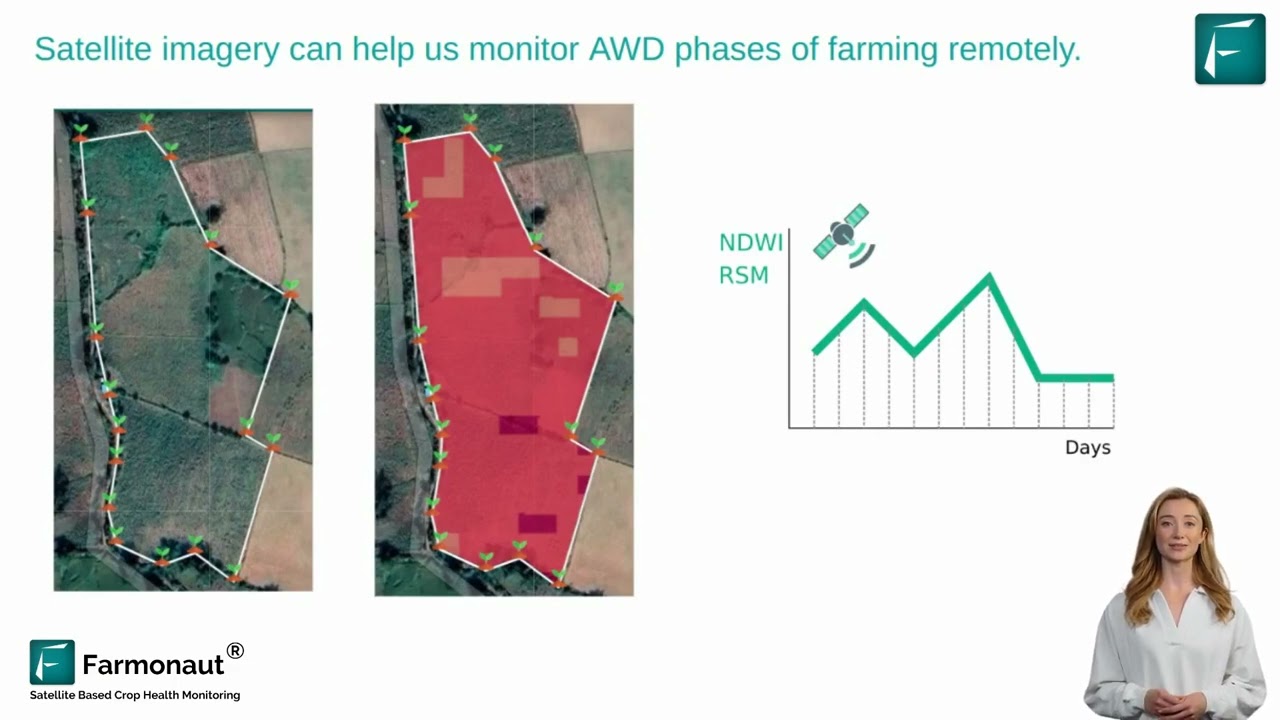
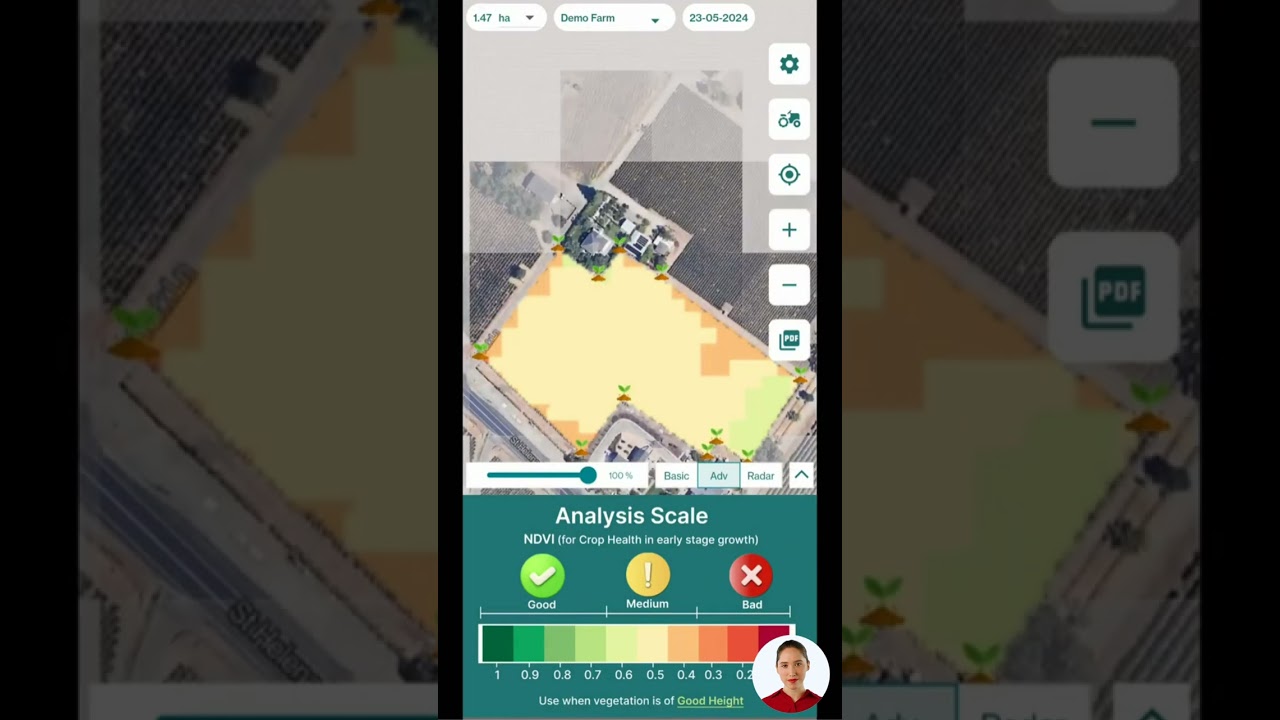
None of the ten practices above work if you can’t see, mid-season, whether cover crop biomass is actually approaching the thresholds that matter, or whether a specific slice of a field is eroding faster than the rest. Farmonaut’s satellite-based monitoring tracks vegetation health and soil moisture across a field through the season, which is the practical way to check cover crop establishment against the 1,200–2,500 lb/acre dry-matter benchmarks without walking every acre with a biomass sampler.
The Jeevn AI Advisory System layers recommendations on top of that imagery — flagging where residue cover looks thin heading into a storm season, or where a rotation change might address a persistent soil health gap identified in soil nutrient monitoring. For operations evaluating whether a runoff practice is paying off, satellite monitoring is also the only practical way to track infiltration-adjacent proxies — standing water after rain events, soil moisture recovery time — across an entire operation rather than a handful of test plots.
Ways to get started:
- Web App:

- Mobile Apps:


- API Access: for developers integrating satellite and weather data directly, see the API page and the API Developer Docs.
How These Figures Get Refreshed
The cover crop runoff figures cited throughout (50% runoff reduction, 20.8 tons/acre sediment reduction, 48% nitrogen loss reduction) come from SARE’s published meta-analysis of field trials; SARE updates this synthesis as new growing-season trial data completes, so check SARE’s cover crops and water quality publication directly for the current version. University of Wisconsin Extension similarly updates its runoff and water quality findings each season — the current data lives at agwater.extension.wisc.edu. For row slope and structural erosion control guidance, SARE’s soil-building series is the source to recheck: Building Soils for Better Crops: Reducing Runoff and Erosion.
Soil testing costs, if you’re budgeting for a soil health assessment to establish your baseline before implementing any of the above, run in the $50–$110 range depending on the panel — but that figure moves by state and lab, so check your regional extension office (for example, extension.missouri.edu or extension.wisc.edu) for current local pricing rather than relying on a single national number.
Two things this article deliberately does not claim, because the sources reviewed don’t support a number: first, there is no published bushel-per-acre or tonne-per-hectare yield lift directly attributable to runoff management practices in the sources reviewed — the research base measures water retention and erosion reduction, and yield outcomes are confounded by variety, weather, and input decisions in the same season. Second, New Zealand-specific adoption rates or Ministry for Primary Industries quantified runoff-reduction studies were not found in the sources reviewed here; a New Zealand farmer wanting a regional figure should check MPI’s published freshwater and farm environment plan guidance directly.
Further reading:
Frequently Asked Questions
- What are ABARES “experimental farmlands” and does this article cover them?
ABARES (the Australian Bureau of Agricultural and Resource Economics and Sciences) runs a farm survey program that includes experimental farmland data for regions including the northern cropping region. That specific dataset is not part of the SARE/USDA/Wisconsin Extension evidence base this article draws from — it sits in ABARES’ own farm survey database. If that Australian dataset is what you need, go directly to ABARES rather than a US/NZ-focused runoff comparison; this article’s figures come from North American field trials and Extension research instead. - What is slope runoff management, specifically?
It’s the set of practices that reduce water volume and velocity moving across sloped cropland. SARE’s guidance sets 1.5–2% as the optimal crop row gradient, with slopes above 4–5% needing structural measures like terracing or contour rows rather than cover crops and rotation alone. - What counts as “best management practices” (agriculture) in the US and New Zealand?
BMPs are region-specific practice sets published by state agencies, NRCS, or (in New Zealand) regional councils under freshwater farm plan rules. The specific list varies by jurisdiction, but the underlying goals — reduced bare soil, slower water, higher infiltration — are consistent, and every practice in this article’s comparison table qualifies as a BMP somewhere. - How much do cover crops actually reduce farm runoff?
SARE’s reviewed field trials found an average 50% reduction in runoff volume across 82% of experiments, a 20.8 tons/acre sediment loss reduction on conventional-till fields, and a 10–40 minute delay in runoff onset during precipitation events (University of Wisconsin Extension). Reaching those effects requires roughly 1,200 lb/acre of dry matter for erosion control and 2,500 lb/acre for runoff volume reduction. - How long does it take to see results from these practices?
Cover crops and reduced tillage can show measurable infiltration and erosion benefits within a single growing season once the biomass thresholds above are met. Riparian buffers, terracing, and constructed wetlands take multiple seasons to reach full effectiveness because they depend on vegetation establishment or structural settling. - Are these practices suitable for all farm types?
The physics is universal, but the specific mix depends on slope, soil type, and crop; see the comparison table above for how each practice trades off cost, difficulty, and effectiveness before choosing one for your operation, including non-row-crop systems where runoff dynamics differ. - Can these practices help with regulatory compliance?
Yes — most align directly with USDA NRCS conservation practice standards and, in New Zealand, freshwater farm plan requirements. Keeping records of cover crop biomass against the thresholds above and a slope map of fields above 4–5% gradient is a practical starting point for a compliance file.
Discussion
Questions, corrections or field experience? Share them below. First-time comments are reviewed before they appear, and your email is never published.
No comments yet. Be the first to add a question or your experience.

 SFX
SFX BACF Africa
 Nivia
Nivia Doodlakine
 Exurbia Geospatial
 FieldZero
 Indico Company
 Kubota
 FFBS
FFBS Jontra
 Tucor
Tucor Hayleys Agriculture
 Licence holder · Niger · Gold
 Licence holder · Nigeria · Gold + lithium










