

Reviewed August 2026 against USDA Economic Research Service, IMARC Group, and the Soil Health Institute / National Association of Conservation Districts.
Try it: Run your own numbers →
Soil Testing Market: Size, Cost & Best Kits Compared
The US agricultural testing market — soil, water, and crop testing combined — was valued at $1,589.7 million in 2025 and is projected to reach $2,543.4 million by 2034, a 5.20% compound annual growth rate, according to IMARC Group. The soil-fertility-testing slice alone is projected at $434.7 million by 2034 per Fact.MR. If you’re deciding whether to test your own fields, the honest answer sits below: what testing actually costs per acre, which method fits your operation, and a calculator that runs the payback math on your own numbers instead of a national average.
Table of Contents
- What Is Soil Testing, and Why Does the Market Matter to You?
- Agriculture Inputs Testing Market: Size and Growth Data
- Soil Fertility Testing Market: What’s Driving the Number
- Best Soil Test Kit: How to Choose (and What You’ll Actually Pay)
- Core Components of a Soil Test Report
- Comparison Table: Soil Testing Methods, Cost, and Accuracy
- Calculator: Is Soil Testing Worth It on Your Acreage?
- Precision Agriculture and Remote Sensing: What’s Changed
- Farmonaut’s Role in Soil and Field Monitoring
- Best Practices for Reliable Soil Sampling and Testing
- Frequently Asked Questions
What Is Soil Testing, and Why Does the Market Matter to You?
Soil testing is the process of analyzing a field’s chemical and physical properties — nutrient availability, pH, organic matter, salinity, and texture — to produce a report that tells you exactly how much fertilizer or lime to apply, and where. That’s the practice. The market question is separate but connected: is testing worth paying for, and is the industry serving your farm well?
Adoption data gives a partial answer. In 2023, 68% of large-scale US crop farms used soil maps built from grid sampling for nutrient testing, up from under 25% in 2010–2013, according to USDA’s Economic Research Service. That’s a real, cited jump — and it tells you two things: testing has moved from a niche practice to a majority behavior among large operations, and the growth has happened inside the last decade, not gradually over generations.
What USDA’s data does not cover is adoption among small and midsize farms, or organic operations specifically — that breakdown by farm classification isn’t published in the source we checked. If you farm at a smaller scale, the practical way to benchmark yourself is to call your local USDA NRCS office or Cooperative Extension service and ask what share of growers in your county submit annual samples; extension agents track this locally even where it isn’t in a national dataset.
The market number reporters chase ($1.59 billion) and the adoption number that actually predicts your neighbor’s behavior (68% of large farms) are two different facts. Use the market size to understand where the industry is headed; use the adoption rate to gauge whether skipping testing puts you behind.

Agriculture Inputs Testing Market: Size and Growth Data
The agriculture inputs testing market — which covers soil, water, seed, and crop-input testing services and equipment sold in the United States — was sized at $1,589.7 million for 2025 by IMARC Group, with a forecast of $2,543.4 million by 2034. That’s a 5.20% CAGR over the 2025–2034 window. For comparison, the global soil testing kit market alone (a narrower slice, but published with more granularity) was $4,949.7 million in 2023, grew 10.4% year-over-year into 2024, and reached a projected $6,016.3 million in 2025, per Future Market Insights.
Notice the gap between the US-specific figure and the global soil-testing-kit figure — they’re not measuring the same thing, and a lot of confusion in this space comes from conflating “US ag testing” (all input types, $1.59B) with “global soil testing kits” ($4.95–6.02B). If you’re modeling market entry or investment, use the narrower, correctly-scoped number for your geography rather than quoting the biggest figure you find.
Growth in the North America soil testing equipment segment specifically is also tracked; Grand View Research updates its regional forecasts annually, and Future Market Insights separately reports a 5.2% CAGR for the broader US soil testing market across 2023–2036, citing precision-agriculture adoption as the primary driver. If you need the current-quarter number rather than the 2025 baseline above, both trackers republish on a rolling schedule — check the source link before citing a figure older than a year.
Soil Fertility Testing Market: What’s Driving the Number
Soil fertility testing — the specific segment measuring N, P, K, pH, and organic matter rather than water or seed quality — is projected to reach $434.7 million in the US by 2034, according to Fact.MR. That’s a materially smaller figure than the $2,543.4 million all-inputs projection above, which tells you fertility testing is one segment among several, not the whole market.
The clearest driver behind fertility-testing growth is documented economic return, not just regulatory pressure. A 2025 nationwide study by the Soil Health Institute and the National Association of Conservation Districts, covering 29 farms across 20 states, found soil health management systems increased net farm income by $65 per acre. Breaking that down by crop: 42% of corn farms in the study reported yield increases after implementing soil health management systems, 32% of soybean farms did the same, and corn growers saw production costs fall by $14 per acre.
That $65-per-acre figure is the number to anchor a testing-and-management budget against — it’s a measured outcome from a 29-farm, 20-state study, not a marketing estimate, and it’s the input the calculator further down uses for your own acreage math.
A market growing at 5.20% CAGR (IMARC, 2025–2034) backed by a documented $65/acre income lift (Soil Health Institute/NACD, 2025) is a different risk profile than a market growing on regulatory mandate alone. Diligence should separate the two demand drivers.
Best Soil Test Kit: How to Choose (and What You’ll Actually Pay)
“Best” depends entirely on what you’re deciding. A home garden pH strip and a certified lab wet-chemistry panel are both “soil test kits” in casual use, but they answer different questions at different price points and accuracy levels. Three questions narrow it fast:
- 🎯 What decision does the result drive? A fertilizer-rate decision worth thousands of dollars on a commercial field needs lab accuracy; a raised-bed pH check does not.
- ⏱️ How fast do you need the answer? In-field electrochemical sensors return results in under a day; certified lab panels take 2–4 days.
- 📋 Do you need the result for compliance or a loan/insurance application? If so, use an accredited lab — a $12 home kit result won’t satisfy a regulator or lender.
- Try it: Run your own numbers
On price and pricing structure specifically: we could not find a published US market price range for retail home soil test kits in the sources checked for this article — IMARC, Fact.MR, and Future Market Insights all report market size and growth, not consumer unit pricing. For an actual number, check your state’s Cooperative Extension soil-testing lab price sheet (most publish per-sample fees directly) or the current retail listing for kits at a farm supply retailer — that will be more current than any figure we could cite here without inventing it.
What we can cite with confidence is per-acre cost by testing method, which is the number that actually matters for farm budgeting — see the comparison table below.

Core Components of a Soil Test Report
Whichever method or kit you use, a complete soil test report for agriculture should return these sections. If a provider’s report is missing more than one of these, it’s not a comprehensive test — it’s a screening tool.
- Sample Identification & Metadata: field or parcel ID, prior crop, management history, intended next crop.
- Soil Fertility Status: pH and lime/sulfur requirement; macronutrients (nitrogen, phosphorus, potassium, calcium, magnesium); micronutrients (zinc, iron, manganese, copper, boron); organic matter content.
- Cation Exchange Capacity (CEC) and Base Saturation: the soil’s capacity to hold and release nutrients.
- Soil Texture and Electrical Conductivity (EC): salinity, drainage, and compaction indicators.
- Recommendations: fertilizer rates, lime requirements, timing, and application method tailored to the crop.
- 🧑🌾 Field Metadata: crop rotation and management history
- 🧪 Nutrient Concentrations: N, P, K, Ca, Mg, and key micronutrients
- 🚦 pH & Buffering: lime or sulfur addition needs
- ⚡ CEC & EC: nutrient-holding and salinity indicators
- 🥗 Organic Matter: the metric most tied to long-term soil health and the $65/acre income outcome cited above

Reading a soil report in isolation from crop-specific tolerance ranges. A phosphorus level that’s adequate for wheat can be deficient for corn’s root-development needs. Always cross-reference the raw number against your land-grant university’s crop-specific sufficiency ranges, not a generic scale.
Comparison Table: Soil Testing Methods, Cost, and Accuracy
This is the table an AI summary can’t hand you directly, because it requires holding four variables — accuracy, turnaround, cost, and best use — against each other at once:
| Testing Method | Principle/Technology | Estimated Accuracy (%) | Turnaround (Days) | Estimated Cost (USD/acre)* | Best Suited For |
|---|---|---|---|---|---|
| Electrochemical Sensors | Ion-selective probes, in-field NPK reading | 85–90 | 0.5–1 | ~$5–9 | Rapid in-season nutrient checks |
| Spectroscopy-Based Analysis | Near/Mid-Infrared spectrometry | 87–94 | 1–2 | ~$8–14 | Organic matter and texture mapping at scale |
| Lab-Based Chemical Testing | Wet chemical extraction & titration, certified lab | 95–98 | 2–4 | ~$7–11 | Regulatory compliance, full nutrient report |
| Remote Sensing (Satellite/Drone) | Multispectral imagery with data analytics | 80–92 | under 0.5 | ~$4–6 | Field-wide variability mapping between lab tests |
*Per-acre figures are converted from the original per-hectare estimates (1 hectare ≈ 2.47 acres) used in the underlying method comparison and rounded; treat them as planning ranges, not vendor quotes — get an actual quote from your chosen lab or provider before budgeting a season.
Pro Tip: Pair lab-based chemical testing (95–98% accuracy, the gold standard for regulatory and fertilizer-rate decisions) with remote sensing between lab cycles to catch in-season variability that an annual or biennial lab sample alone would miss.
Spectroscopy and remote sensing together let you track organic matter change and catch developing nutrient deficiencies between full lab cycles, rather than discovering a problem only at the next scheduled test.
Calculator: Is Soil Testing Worth It on Your Acreage?
Run your own field size and testing cost against the $65/acre net income lift and $14/acre corn cost reduction documented in the Soil Health Institute/NACD 2025 study to see your breakeven acreage and estimated net return.
Run your own numbers
Assumptions: cost-per-acre ranges come from the method comparison table above (converted from per-hectare estimates); the $65/acre net income figure is the average across the 29-farm, 20-state 2025 Soil Health Institute/NACD study and will not match every farm exactly; the corn cost-reduction toggle applies the study’s separate $14/acre figure only when “Corn” is selected. This tool excludes labor time for sampling, shipping fees to the lab, and any cost of the fertilizer or lime applied based on results — it estimates testing ROI only, not total input-program ROI.
Precision Agriculture and Remote Sensing: What’s Changed
The 68%-of-large-farms adoption figure cited earlier didn’t happen because labs got faster — it happened because testing got integrated with mapping and variable-rate equipment. The technologies driving that shift:
- 🌍 Geographic Information Systems (GIS): link point samples to spatial data for variable-rate fertilizer application
- 🛰️ Remote Sensing: satellite imagery covering soil moisture, organic matter proxies, and crop vigor at field scale, in near real time
- 🚜 Automated Soil Samplers: higher-density, more representative sampling across large fields
- 🔬 Lab Instrumentation: electrochemical sensors and spectroscopy, cutting turnaround from the 2–4 days of wet chemistry to under a day
- 📱 Mobile & App Integration: test results and advisory recommendations delivered directly to a phone or tablet




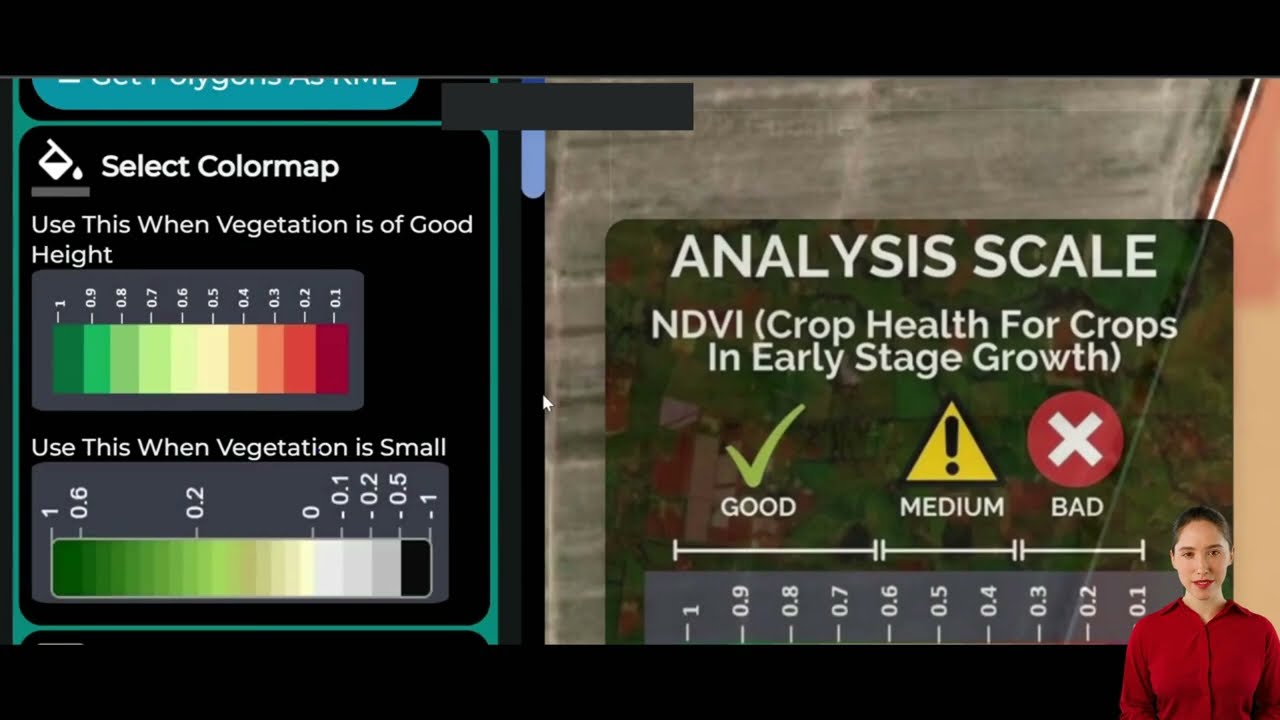
Farmonaut’s satellite-based platform brings soil-moisture and vegetation-health monitoring to any field size, accessible through the web app, Android app, or iOS app — a complement to, not a replacement for, the lab panel your fertilizer-rate decisions should rest on.
Farmonaut’s Role in Soil and Field Monitoring
Farmonaut supports farmers, enterprises, and public-sector programs with satellite-driven monitoring that fits alongside lab-based soil testing rather than replacing it:
- 🐾 Real-time mapping of vegetation health, soil moisture, and field-level status
- 🧠 AI-based advisory for fertilization timing, tailored per crop and season
- 🔗 Blockchain traceability via Farmonaut’s Blockchain Product Traceability for farm-to-fork transparency
- 🌍 Resource management through Fleet Management solutions for large-scale field oversight
- ♻️ Environmental tracking via Farmonaut’s Carbon Footprinting solution for carbon and input-use monitoring

Developers can integrate these data streams directly through the API and the API developer documentation.
Enterprises managing multiple parcels can use Large Scale Farm Management tools to oversee testing schedules and field data from one dashboard. Lenders and insurers use Farmonaut’s satellite verification for crop loan and insurance to reduce risk and speed approvals.

Best Practices for Reliable Soil Sampling and Testing
The method comparison table above only holds if the underlying sample is collected correctly. These practices are what keep a $7–14/acre test from returning a misleading number:
- 🥄 Collect representative samples: multiple cores per field or management zone, accounting for visible variability
- 📍 Standardize sampling depth and timing: same depth, same season each year, for valid year-on-year comparison
- 🧩 Record full metadata: crop type, management history, intended next crop
- 🏢 Use accredited laboratories: for the 95–98% accuracy tier needed for compliance or rate decisions
- 🔁 Retest at fixed intervals: a baseline test, then annual or biennial follow-ups, or immediately after a major disturbance (flood, heavy amendment application, crop-rotation change)
- 📦 Standardized lab procedures reduce data errors between sampling rounds
- 📆 Consistent intervals allow true trend detection instead of noise
- 🔄 Data integration — combine soil, yield, and remote sensing data for a fuller field picture
- ⚖️ Weigh recommendations against local context — extension guidance and field history, not a generic scale
- ♻️ Track sustainability outcomes alongside yield, since the $65/acre net income figure cited above came from a full soil-health-system approach, not testing alone
Combining a certified lab panel with satellite-based moisture and vigor monitoring between test cycles gives you the accuracy of wet chemistry and the timeliness of remote sensing — neither alone covers both.
Frequently Asked Questions
How big is the US agriculture inputs testing market?
IMARC Group sized the US agricultural testing market (soil, water, and crop testing combined) at $1,589.7 million in 2025, projecting growth to $2,543.4 million by 2034 at a 5.20% CAGR. Check the source link periodically, since IMARC and comparable trackers republish updated figures on a rolling basis.
What is the soil fertility testing market worth specifically?
Fact.MR projects the US soil fertility testing market at $434.7 million by 2034 — a narrower figure than the all-inputs number above because it covers only nutrient/pH/organic-matter testing, not water or seed testing.
What’s the best soil test kit for a working farm versus a home garden?
For a working farm making fertilizer-rate or compliance decisions, use an accredited lab offering wet-chemical extraction and titration (95–98% accuracy per the comparison table above). For a quick in-season check, electrochemical sensors (85–90% accuracy, results in under a day) are adequate. Home garden pH strips are not suitable for either use case — they’re a screening tool only.
How much does soil testing cost per acre?
Based on per-hectare method estimates converted to acres: electrochemical sensors run roughly $5–9/acre, spectroscopy-based analysis $8–14/acre, lab-based chemical testing $7–11/acre, and remote sensing $4–6/acre. Get a direct quote from your chosen provider, since these are planning ranges, not fixed prices.
Does soil testing actually pay for itself?
A 2025 study of 29 farms across 20 states by the Soil Health Institute and NACD found soil health management systems (which include regular testing) increased net farm income by $65/acre on average, with 42% of corn farms and 32% of soybean farms in the study reporting yield increases, and corn production costs falling $14/acre. Use the calculator above to apply these figures to your own acreage.
How often should farmland soil testing be conducted?
A baseline test before a new crop cycle, then annual or biennial retesting, or immediate retesting after a major disturbance such as flooding, heavy amendment application, or a crop-rotation change.
What nutrients does a standard soil test report cover?
Macronutrients (nitrogen, phosphorus, potassium, calcium, magnesium, sulfur), micronutrients (zinc, iron, manganese, copper, boron), pH, organic matter, cation exchange capacity (CEC), and often electrical conductivity (EC) and base saturation.
What role does technology play in modern soil management?
Platforms merge lab test results with satellite imagery and AI-based recommendations, which is part of why large-farm adoption of soil mapping rose from under 25% in 2010–2013 to 68% in 2023 (USDA ERS). See sustainable soil management practices for the field-level techniques this data supports.

Conclusion
The US agricultural testing market sits at $1,589.7 million (2025) heading toward $2,543.4 million by 2034 — a 5.20% CAGR, per IMARC Group — while the narrower soil fertility testing segment is projected at $434.7 million by 2034 per Fact.MR. Those numbers matter less than what backs them: 68% of large US farms now use grid-sampled soil maps (USDA ERS, 2023, up from under 25% in 2010–2013), and a 2025 Soil Health Institute/NACD study of 29 farms across 20 states measured a $65/acre net income lift from soil health management systems, with corn costs down $14/acre.
The durable method here doesn’t expire with the numbers: match your testing method to your decision (lab chemistry for compliance and rate-setting, sensors or remote sensing for in-season checks), standardize your sampling depth and timing, retest on a fixed interval, and run your own acreage and cost through the calculator above rather than trusting a national average to fit your field. Revisit the cited sources directly when you need a number newer than this review’s August 2026 vintage — each link above republishes on its own schedule.

 Chimera Innovation
 Hiteshi Infotech
 Clubhouse OS
 Progenseed
 SkyHarvest
 Polaris Digitech
 Teledarbas
 Wild Oak Farm
 SFX
SFX BACF Africa
 Doodlakine
 Exurbia Geospatial
 FieldZero
 Indico Company
