

Argentina · Exports and production
What Does Argentina Produce and Export? Soy, Oil, Corn
Soy products earned 24.6% of Argentina’s goods exports in 2025, followed by oil and petrochemicals (13.5%) and vehicles (10.1%). Corn, beef, wheat, gold and lithium complete the picture.
Key takeaways
- Soy was 24.6% of 2025 goods exports of US$87,111 million (INDEC).
- USDA puts 2025/26 crops at 64.0 Mt of corn, 49.3 Mt of soybeans and 27.9 Mt of wheat.
- Crude oil was the top single export product in the first half of 2026, at 9.5% (INDEC data via Rio Times).
- Agriculture was 5.53% of GDP in 2025, while agro-industrial goods were 59.3% of export value (World Bank; Agriculture Secretariat).
- The soybean export tax was 24% in June 2026, with cuts planned for 2027-2028 (USDA).
In this article
- What does Argentina produce and export? The short list
- Crops: what Argentina grows, and how much it ships
- Beef and livestock
- Oil, gas, lithium and gold
- Argentina's major industries
- Argentina's GDP by sector: agriculture, industry, services
- How export taxes shape a farmer's price
- Pricing and payment: how a sale gets settled
- Trade with the United States
- The wider economy behind these exports
- How to read Argentina's export numbers
- What this means for growers and grain buyers
- FAQ
Argentina produces soybeans, corn, wheat, sunflower, beef, cars, crude oil, gold and lithium. Its largest export group is soy products: the soy complex earned US$21,442 million in 2025, or 24.6% of goods exports, according to a report on the INDEC export figures. Oil and petrochemicals came second at 13.5%, and vehicles third at 10.1%.
So what does Argentina produce and export in practice? Mostly food, processed food and, more and more, energy. This page ranks the main export groups, shows crop volumes and export tax rates, breaks down GDP by sector, and gives a calculator that turns an export price into a net price per tonne.
What does Argentina produce and export? The short list
INDEC, the national statistics agency, groups exports into “complexes”. A complex counts a raw product and the goods made from it, so soybeans, soybean meal and soybean oil sit together. Goods exports reached US$87,111 million in 2025, up 9.3% on 2024. Volume drove that rise: quantities grew about 10%, while the price index fell 0.6%.
| Export group | Share of 2025 exports | What it includes |
|---|---|---|
| Soy | 24.6% | Meal and pellets, oil, beans |
| Oil and petrochemicals | 13.5% | Crude oil, fuels, chemicals |
| Vehicles | 10.1% | Cars, light trucks, parts |
| Corn | 7.6% | Grain and corn products |
| Beef and hides | 5.4% | Beef, leather |
| Sunflower | 2.5% | Oil, meal, seed |
| Dairy | 1.7% | Milk powder, cheese |
The ten largest complexes made up 77.7% of exports. Besides the groups above, they include gold and silver (5.6%), wheat (4.2%) and fishing (2.4%). The table leaves these out, although gold and silver and wheat each earned more than sunflower. The soy, corn, beef, sunflower and dairy shares come from the INDEC report on export complexes, 2025.
The table measures value, not tonnes. A tonne of soybean oil earns far more than a tonne of corn, so volume rankings look different. Farm goods make up an even larger share by weight. Argentina’s Agriculture Secretariat counts agro-industrial goods at 59.3% of export value and 79.1% of export volume in 2025.
Chart
Argentina’s largest export groups
Share of goods exports by value, 2025, selected complexes
Crops: what Argentina grows, and how much it ships
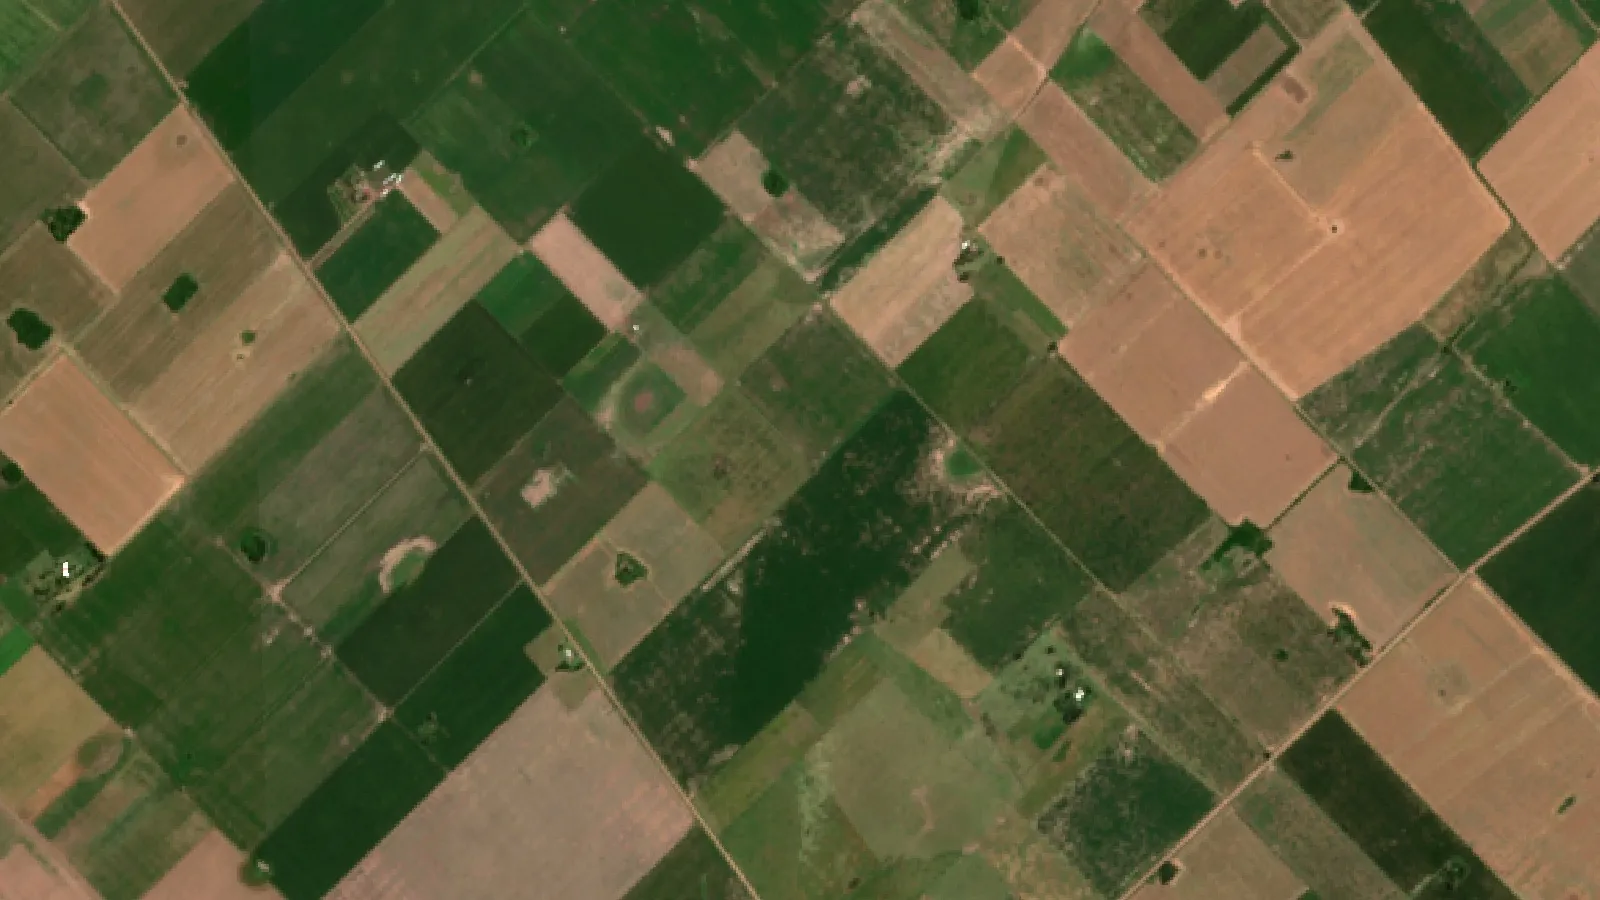
The main crop belt is the Pampas, the flat and fertile plain across Buenos Aires, Córdoba, Santa Fe and La Pampa provinces. Corn, soybeans and wheat rotate across this land, often with sunflower and barley in the mix. USDA’s October 2026 tables put the 2025/26 crops at 64.0 million tonnes of corn, 49.3 million tonnes of soybeans and 27.9 million tonnes of wheat.
Chart
Argentina’s three largest crops
Million tonnes, 2025/26 marketing year
Those numbers can swing hard. Corn output was 37.0 million tonnes in USDA’s series for 2022/23, and soybeans were 25.0 million tonnes in that season. For 2026/27, USDA’s October 2026 grain tables forecast 55.0 million tonnes of corn and 21.5 million tonnes of wheat, so 2025/26 is not a normal base. Forecasts change each month.
Why Argentina ships soy as meal and oil
Argentina crushes most of its soybeans at home and sells the products. USDA’s October 2026 oilseed tables show about 43 million tonnes crushed in 2025/26, against 8.9 million tonnes of whole beans exported. Meal exports reached 29.8 million tonnes and oil exports 6.75 million tonnes. INDEC’s split matches this picture: meal and pellets were 39.9% of soy complex value, oil 33.7% and beans 22.9%.
The large crush also explains an odd fact. Argentina imports soybeans too, about 7.5 million tonnes in 2025/26 on USDA’s figures, to feed its plants.
Corn and wheat
Corn is mostly shipped as grain. USDA puts 2025/26 corn exports at 39 million tonnes, and wheat exports at about 19 million tonnes. The Agriculture Secretariat’s 2025 report ranks Argentina third in the world for corn exports in 2025.
Where Argentina ranks in world trade
The Secretariat’s 2025 ranking shows how wide the farm list is, well beyond soy and corn:
- First: lemon juice and essential oil, peanuts, soybean oil.
- Second: soybean by-products, yerba mate.
- Third: corn, sorghum, garlic.
- Fourth: honey, pears, sunflower by-products.
- Fifth: whole milk powder, prunes, soybeans, pecans, beans and chickpeas, frozen shrimp and prawns.
These ranks come from a government report and cover exports only. Wine, fruit and timber also matter in their home regions, such as Mendoza for wine and Misiones for tree plantations, though they are small in the national total.
Sunflower, barley and peanuts
Smaller crops still earn real money. USDA’s oilseed tables put sunflower exports of oil and meal among Argentina’s regular lines, and INDEC counted US$2,175 million for the sunflower complex in 2025. Sunflower carries a lower export tax than soy, at 4.5% in June 2026. Barley is a regular export crop too and shares wheat’s 5.5% rate. Peanuts are a niche with weight: the Secretariat ranks Argentina first in world peanut exports, even though peanuts sit outside the ten largest complexes.
Who buys Argentine soy
INDEC’s 2025 data show soybean meal and pellets going to Southeast Asia (US$2,333 million), the European Union (US$2,232 million) and the Middle East (US$1,340 million). North America took US$412 million of soybean oil across Mexico, the US and Canada, behind larger buyers in Asia and Latin America. China was the main buyer of whole beans (US$4,586 million). The soy complex also ran a trade surplus of US$18,897 million, because it imports far less than it sells.
How Argentina compares with Brazil
Brazil grows more soybeans and ships most of them whole. Argentina does the reverse. These USDA figures for 2025/26 show the gap:
| Product | Argentina exports | Brazil exports |
|---|---|---|
| Soybean meal | 29.8 million tonnes | 25.5 million tonnes |
| Soybean oil | 6.75 million tonnes | 1.95 million tonnes |
| Whole soybeans | 8.9 million tonnes | 114.5 million tonnes |
For a meal or oil buyer in Europe or Southeast Asia, Argentina is a core origin. For a whole-bean buyer, it is a much smaller one. This is why Rosario-area crush plants and river ports get so much market attention when low water or strikes slow shipments.
Regional products at a glance
| Region | Main farm products |
|---|---|
| Pampas | Soybeans, corn, wheat, barley, sunflower, beef, dairy |
| Northwest | Lemons, sugar cane, beans |
| Northeast | Yerba mate, rice, tree plantations |
| Cuyo (Mendoza, San Juan) | Wine grapes, garlic, fruit |
| Patagonia | Pears, apples, sheep, shrimp from the coast |
This pattern helps when reading export news. A frost in the northwest moves lemon products. A dry spell in the Pampas moves the national trade balance.
Forestry is concentrated in the northeast, mainly Misiones and Corrientes, and supplies timber, pulp and paper. It is counted with farming and fishing in the World Bank’s 5.53% figure.

▶ Six plain steps to start precision agriculture on a working farm. · 4:18
Beef and livestock
Beef is the product many readers think of first, and it is still large. USDA’s October 2026 livestock tables show 3.145 million tonnes of production in 2025 (carcass weight) and 773,000 tonnes of exports. So most Argentine beef is eaten at home, which sets it apart from soy. The USDA report forecasts production near 3.1 million tonnes in 2027.
INDEC’s beef complex, which includes hides and leather, earned US$4,727 million in 2025. Argentina’s cattle herd stood near 51.6 million head at the start of 2025, in USDA’s series. Dairy added US$1,522 million in the same year.
Oil, gas, lithium and gold
Energy is growing fast in the export table: crude export earnings rose 47.7% on the year in the first half of 2026. Crude oil became the single largest export product in the first half of 2026, at US$4.693 billion or 9.5% of goods sold abroad, according to Rio Times, using INDEC trade data. Corn followed at 8.4%, and soybean meal also at 8.4%. Farm goods and processed farm goods together still made up 57.5% of the half-year total.
Much of the oil growth comes from the Vaca Muerta shale in Neuquén province. The oil and petrochemical complex reached US$11,772 million in 2025.
In minerals, the USGS country profile ranks Argentina fifth in world lithium output in 2024, with 6% of the total. Argentina also shows up as a silver, boron and gold producer there. The USGS Mineral Commodity Summaries 2026 counts four brine operations among those that accounted for most world lithium output, and lists 28 million tons of lithium resources in Argentina. The deposits sit in the high salt flats of Salta, Jujuy and Catamarca. Gold and silver were among the ten largest export complexes in 2025.
Argentina’s major industries
A common list of industries, from IndexMundi’s Factbook-based profile (last updated 2021), is food processing, motor vehicles, consumer durables, textiles, chemicals and petrochemicals, printing, metallurgy and steel.
| Industry | Main output | Link to farming |
|---|---|---|
| Food processing | Soy crush, meat, milling, dairy | Direct buyer of crops and cattle |
| Motor vehicles | Cars, light trucks, parts | Pickups and farm transport |
| Chemicals | Plastics, fertilizer, fuels | Supplies farm inputs |
| Metallurgy and steel | Steel, aluminum | Silos and farm machinery |
| Textiles | Fabric, apparel | Uses cotton and wool |
| Oil and gas | Shale oil, gas, refining | Diesel and gas for inputs |
| Mining | Lithium, gold, silver | None directly |
The farm-to-factory link is strong. The soybean crush alone counts as manufacturing in the trade data, even though every tonne starts on a farm. INDEC said 74.8% of soy complex sales were manufactured goods of farm origin.
Argentina’s GDP by sector: agriculture, industry, services
World Bank data for 2025 put agriculture, forestry and fishing at 5.53% of GDP, industry including construction at 22.87%, and services at 56.15%. The three add up to 84.55%. The remaining share is mostly net taxes on products, which the World Bank does not assign to a sector.
| Year | Agriculture | Industry | Services |
|---|---|---|---|
| 2018 | 4.54% | 23.72% | 56.37% |
| 2019 | 5.32% | 23.16% | 55.44% |
| 2020 | 6.36% | 22.41% | 54.86% |
| 2021 | 7.29% | 23.50% | 52.83% |
| 2022 | 6.54% | 24.11% | 53.53% |
| 2023 | 5.85% | 25.17% | 53.20% |
| 2024 | 5.81% | 24.00% | 53.65% |
| 2025 | 5.53% | 22.87% | 56.15% |
You can check these yourself in the World Bank series for agriculture and services, with the world services series for comparison. The world average was 63.30% services in 2024, the newest world figure for that sector.
The farm share looks small, yet it hides how much the economy depends on crops. It leaves out crushing, meatpacking, trucking, ports, finance and inputs. It also moves with prices and weather: the share ranged from 4.54% in 2018 to 7.29% in 2021 within the years shown. In the export table, by contrast, agro-industrial goods are more than half of the total.
Chart
Agriculture’s share of GDP: Argentina and the world
Agriculture, forestry and fishing value added, % of GDP
How export taxes shape a farmer’s price
Argentina taxes farm exports, and locals call these taxes retenciones. Rates are set by decree, so they can change quickly. Soybeans stood at 33% in December 2023 and 24% in June 2026, according to a USDA report on Decree 423/2026. Wheat and barley fell from 7.5% to 5.5% in June 2026.
Chart
Argentine export tax rates
Percent of export value
The same decree sets a step-down from January 2027 to December 2028. It has soybeans reaching 15%, soy by-products 14%, corn and sorghum 5.5%, and sunflower 3%. USDA notes these later cuts depend on the economic situation, so treat them as a plan, not a promise.
Beef has its own rate. USDA’s August 2025 report listed steer beef and poultry meat at 5%. Check the current rate before using it.
The tax is charged on the export value, and buyers build it into what they pay at the farm gate. Freight matters too, because much of the crop moves by truck to the river ports near Rosario. Before you price a real sale, check the current decree and get professional tax advice.
Export taxes are not new. USDA says they were first introduced in 1955 and have moved a lot under different governments. It also cites a Bolsa de Cereales de Córdoba estimate that farmers paid about US$150 billion in these taxes on soybeans, corn and wheat alone between 2002 and 2024. The current cut is what USDA calls effectively the third round since December 2023.
A quick worked example shows the scale. On a US$420 export price, a 24% tax takes about US$101 per tonne before any freight. At 15%, the planned December 2028 soybean rate, it would take US$63. Use the calculator below with your own price and today’s rate. Prices move daily, and this example price is not a quote.
Try the numbers for your own farm below.
Calculator
What is left per tonne after tax and costs?
Enter your own price, tax rate and costs. All values start as examples.
- Net price at the farm, US$/t: $250
- Export tax paid, US$: $50,400
- Margin per tonne, US$: $0
Example values only, set near break-even, not benchmarks or forecasts. Price input is an example, use today’s price. The tax rate is an input because rates change by decree; check the current rate. A flat tax and commission are applied to the export value. Quality discounts, drying and exchange-rate spreads are left out.
Pricing and payment: how a sale gets settled
Three things decide what reaches a grower’s account.
- Forward pricing. Growers can lock in a dollar price before harvest with futures and options. Matba Rofex, a farm futures market, merged with MAE to form A3 Mercados. The A3 Mercados site lists its futures, options and market data.
- Export tax. The rate above comes off the export value before the price reaches the farm.
- Bank settlement. Account ownership in Argentina more than doubled in the decade to 2021, as a World Bank analysis of Global Findex data describes. The same analysis says digital use grew more than 60% over three years. It also found gaps: 45% of private-sector workers were paid into an account, against 82% in the public sector.
Trade with the United States
The direct US link is smaller than Argentina’s world trade. The Office of the US Trade Representative estimates total goods and services trade with Argentina at US$29.9 billion in 2025, up 14.7% from 2024. Services exports were US$8.9 billion and services imports US$2.8 billion.
For goods, the US Census Bureau shows US exports of US$9,969.1 million and imports of US$8,283.6 million in 2025, a US$1,685.5 million surplus. From January to September 2026, exports were US$7,512.3 million and imports US$7,362.2 million, a US$150.1 million surplus for those nine months.
The wider economy behind these exports
The World Bank’s Argentina overview gives GDP of US$640 billion, with growth of 4.4% in 2025 and 3.6% projected for 2026. It credits macroeconomic stability, energy investment and agribusiness. Monthly inflation fell from over 20% to around 2.5%–3%, though the fall slowed from late 2025. Country risk dropped from more than 2,000 basis points at the end of 2023 to around 570 in March 2026.
The IMF program agreed in April 2025 is US$20 billion, with about US$14.4 billion disbursed, and the World Bank added US$1.5 billion in budget support. For an exporter or grain buyer, these figures matter because financing costs and tax policy both follow the wider economy.
How to read Argentina’s export numbers
Different pages give different “top exports”, and they can all be right. Before you quote one, check these points:
- Group or product. INDEC complexes bundle related goods, so soy leads easily. A product ranking splits meal, oil and beans, which is how crude oil reached first place in the first half of 2026.
- Full year or part year. Grain exports are seasonal. A first-half ranking can differ from the full-year one.
- Calendar or marketing year. INDEC uses calendar years. USDA uses marketing years, so 2025/26 will not match a 2025 trade figure.
- Value or weight. Farm goods were 79.1% of export volume but 59.3% of value in 2025, in the Secretariat’s count.
- Who counts farm goods. The Secretariat’s agro-industrial total and INDEC’s product categories use different definitions, so 59.3% for 2025 and 57.5% for the first half of 2026 are not a direct comparison.
For one more check, compare the export share with the GDP share. Agriculture’s 5.53% of GDP measures value added in farming, forestry and fishing. Export shares measure the full sale value, including what factories and ports add. That is why the two numbers look so far apart, and why neither one alone tells you how much Argentina depends on its farms.
What this means for growers and grain buyers
A grower in Canada, Australia or the US meets Argentina mostly as a competitor in world meal, oil, corn and wheat markets. Three things are worth tracking:
- Crop size. A swing of tens of millions of tonnes, as USDA’s series shows, moves global supply. Watch the monthly USDA tables.
- Tax steps. Each cut lifts farm-gate prices in Argentina and can change planting choices. USDA said the June 2026 cut could limit a drop in wheat and barley area.
- Season timing. Southern Hemisphere corn and soybeans are planted late in the year and harvested around March to June, so news reaches markets during the northern planting season.
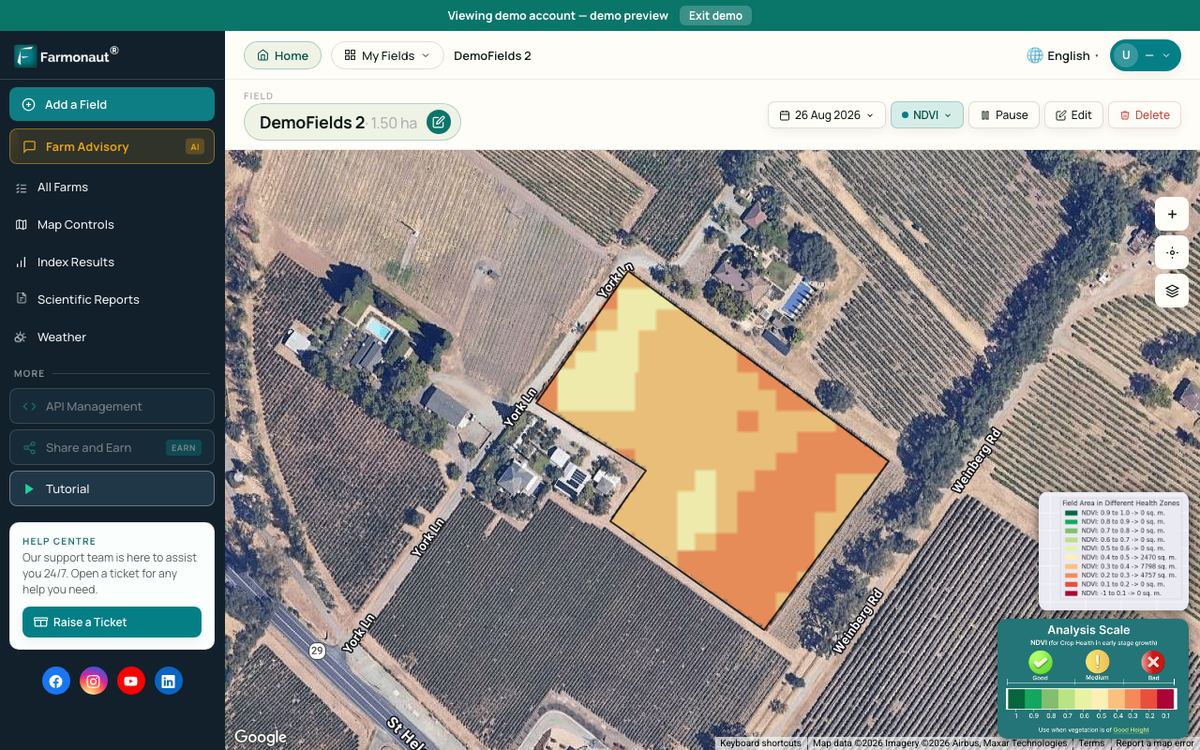
Satellite images can help you follow a field in season. Farmonaut, a US-based company, offers vegetation maps for your own fields. The walkthrough below shows how to read them. For national crop numbers, use USDA.
Related pages on our site: satellite mineral detection, mining site mapping, mining project enquiries, crops and inputs in Argentina, contact page.
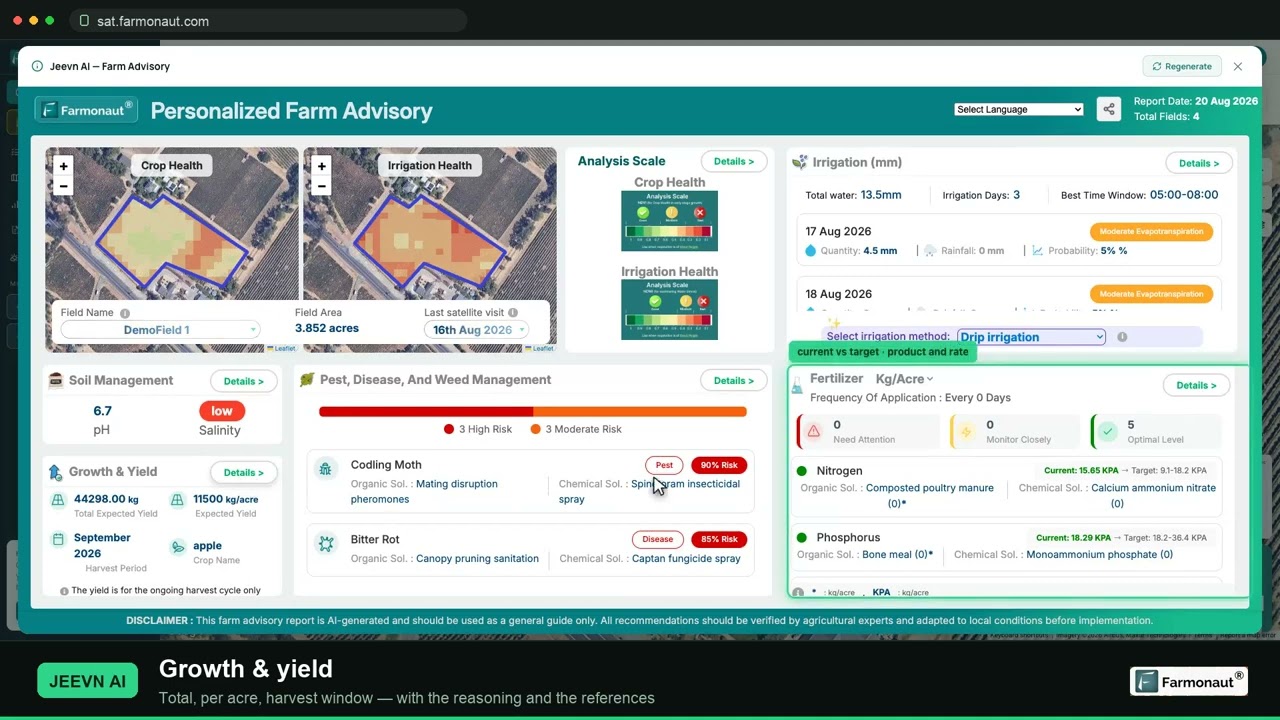
▶ A walkthrough of satellite crop monitoring and how to read NDVI for your own field. · 19:36
FAQ
What is Argentina’s main export?
By group, soy: 24.6% of 2025 goods exports, per INDEC. By single product, soybean meal led a year earlier, and crude oil took first place in the first half of 2026.
What does Argentina produce the most of?
By tonnes among crops, corn at 64.0 million tonnes in 2025/26, ahead of soybeans at 49.3 million tonnes and wheat at 27.9 million tonnes, per USDA’s October 2026 tables.
What is Argentina’s GDP by sector?
In 2025, World Bank data show services at 56.15%, industry at 22.87% and agriculture, forestry and fishing at 5.53%. The rest is mostly net product taxes.
What are Argentina’s major industries?
Food processing, motor vehicles, consumer durables, textiles, chemicals and petrochemicals, printing, metallurgy and steel, plus oil and gas and mining.
What is the export tax on Argentine soybeans?
24% in June 2026, per USDA, with cuts planned from January 2027 that depend on the economic situation. Check the current decree.
Does the US buy much from Argentina?
US goods imports were US$8,283.6 million in 2025, per the Census Bureau, compared with Argentina’s total goods exports of US$87,111 million (INDEC).
Farmonaut crop monitoring
See your own fields from space
Outline your fields once and see satellite vegetation maps for them through the season, on web, Android or iOS.



Keep reading

Sources
- INDEC, Complejos exportadores, 2025 (March 2026): indec.gob.ar
- Bichos de Campo, report on INDEC export complexes (2026): bichosdecampo.com
- Memo, Argentine exports in 2025, INDEC data: memo.com.ar
- Rio Times, crude oil tops exports, INDEC data (August 2026): riotimesonline.com
- Argentina Agriculture Secretariat, Comex report no. 10 (2026): magyp.gob.ar
- USDA FAS, Oilseeds: World Markets and Trade (October 2026): apps.fas.usda.gov
- USDA FAS, Grain: World Markets and Trade (October 2026): apps.fas.usda.gov
- USDA FAS, Livestock and Poultry: World Markets and Trade (October 2026): apps.fas.usda.gov
- USDA FAS GAIN AR2026-0008, export tax cuts (June 2026): apps.fas.usda.gov
- USDA FAS GAIN AR2025-0012, export tax cuts (August 2025): apps.fas.usda.gov
- USGS, Argentina country profile: usgs.gov
- USGS, Mineral Commodity Summaries 2026: Lithium: pubs.usgs.gov
- World Bank, Argentina overview (2026): worldbank.org
- World Bank, agriculture value added, Argentina: api.worldbank.org
- World Bank, services value added, Argentina: api.worldbank.org
- World Bank, services value added, world: api.worldbank.org
- World Bank blog, Argentina bank accounts: blogs.worldbank.org
- USTR, Argentina trade summary (2025): ustr.gov
- US Census Bureau, trade in goods with Argentina (2026): census.gov
- A3 Mercados, futures and options: a3mercados.com.ar
- Oaklins, Matba Rofex and MAE merger: oaklins.com
- IndexMundi, Argentina industries: indexmundi.com
Discussion
Questions, corrections or field experience? Share them below. First-time comments are reviewed before they appear, and your email is never published.
No comments yet. Be the first to add a question or your experience.

 Reddane Farming
 Esri North East Africa
 Farmer Amigo
 Cresol
 Atur Kuliner
 MDCV UK
 Zerella Group
 Etech Consulting Madagascar
 Vestlandsforsking
 Agritein
 Delicio
 WB Dev
 Sama Premium
 Prochecker
 Tres Valles
 LACOS Geoinformation
 Magrifly
 LatConnect 60
 Blickwinkel
 Agricultural Credit Policy Council

 Exploration consultancy · South Africa · Gold
 Licence holder · Niger · Gold
 Licence holder · Nigeria · Gold + lithium
 Client · Tanzania · Gold










