

Reviewed September 2026 against USDA Farm Service Agency, Defra Environmental Land Management, and Carbon Balance and Management (peer-reviewed).
Try it: Run your own numbers →
A carbon farming initiative pays farmers to store carbon in soil and vegetation instead of releasing it — through direct government payments (USDA conservation programmes, the UK’s Sustainable Farming Incentive) or through voluntary carbon credit sales. In the US, USDA carbon farming payments averaged $33 per acre in 2024. In the UK, the Sustainable Farming Incentive pays £20 per hectare for the first 50 hectares under its management payment, and Defra raised Sustainable Farming Incentive and Countryside Stewardship rates by 10% in 2024, a change that reached 30,000 Countryside Stewardship agreement holders. That is what a farmer or land manager can expect to be paid — this article covers what for, how much it costs to deliver, and how the numbers compare across five practices.
“Eco farming” and “carbon farming” get used almost interchangeably in search, but they answer slightly different questions. Eco farming describes a general low-input, biodiversity-friendly approach to growing food. Carbon farming is narrower and more measurable: it is specifically about practices that increase carbon stored in soil or biomass, verified well enough to qualify for a payment or a credit. Every practice in this article is carbon farming; most carbon farming practices are also eco farming, but not every eco farming practice (say, avoiding synthetic pesticides) is carbon farming unless it also changes how much carbon the land holds.
- What Carbon Farming Actually Pays — US and UK
- Costs and Yield Effects by Practice
- Five Practices That Move the Needle
- Comparison Table: Practice, Cost, Sequestration
- Carbon Credit Markets and Verification
- Calculator: Your Practice Mix, Your Numbers
- Getting Started Without Losing a Season
- How Farmonaut Supports Monitoring and Verification
- FAQs
- What Would Change These Numbers
What Carbon Farming Actually Pays — US and UK
In the United States, carbon farming payments run through USDA Farm Service Agency climate-smart agriculture programmes, including EQIP (Environmental Quality Incentives Program), CSP (Conservation Stewardship Program), and CIG (Conservation Innovation Grants). The USDA Farm Service Agency reported an average annual payment of $33 per acre in 2024 across these climate-smart programmes. That figure is an average across practices and regions — a farm running cover crops on marginal ground and a farm doing full agroforestry conversion will land on different sides of it. FSA rates are set at the county level and revised annually or semi-annually, so confirm your specific rate at your local FSA office or fsa.usda.gov before budgeting against it.
In the United Kingdom, the Defra Environmental Land Management scheme pays £20 per hectare per year as a management payment under the Sustainable Farming Incentive, for the first 50 hectares of enrolled land — a flat payment on top of action-specific payments for individual practices. In January 2024, Defra raised payment rates for both the Sustainable Farming Incentive and Countryside Stewardship by 10%, a change Defra said benefited roughly 30,000 existing Countryside Stewardship agreement holders. Defra reviews these rates annually from 2025 onward; check defrafarming.blog.gov.uk or gov.uk/countryside-stewardship for the current year’s figures before applying.
Two things worth being blunt about. First, neither the US nor the UK publishes a single “carbon farming payment” — both are a patchwork of per-practice and per-hectare or per-acre payments layered together, so your actual cheque depends on which actions you stack. Second, we could not find a published dataset combining yield change and payment income into one net profitability number for either country — US and UK studies isolate costs, yields, and payments separately (see the gap noted below). Treat the figures in this article as inputs you combine yourself, not a single verified bottom line.
Costs and Yield Effects by Practice
Cover crops and reduced tillage are the two most common entry points into carbon farming, and both have been costed directly. A 2023 peer-reviewed study in Carbon Balance and Management put the annual implementation cost of cover cropping in the US at $202.87 per hectare, versus $55.30 per hectare for no-till. No-till is cheaper to run because it removes tillage passes rather than adding a seeded crop, but it delivers less soil carbon gain per hectare than cover cropping in the same study.
On adoption: as of the 2017 USDA Census of Agriculture, only 3.9% of cropland across the contiguous United States carried a cover crop, while 104 million acres were under no-till management — no-till is already mainstream, cover cropping is not. The Census is conducted every five years; USDA’s National Agricultural Statistics Service (NASS) publishes the next round on that cycle, so check nass.usda.gov for a more current adoption figure than 2017 if your work depends on it.
On what adoption actually buys in carbon terms: existing US cover crop adoption already sequesters an estimated 5.5 million metric tons of CO₂ annually, according to the same USDA/Purdue analysis. And carbon accumulates with time under the practice — the Carbon Balance and Management study found 10.3% greater soil organic carbon in fields under 10 years of continuous cover cropping compared with control fields with no cover crop. That is a decade-long field comparison, not a one-season result, which matters for anyone expecting a fast payback.

Five Practices That Move the Needle
These five are the practices with cost, adoption, or sequestration data attached in the research above. Each is usable on its own; most farms combine two or three.
1. Cover Cropping
At $202.87 per hectare per year in the US and adopted on only 3.9% of contiguous US cropland as of the 2017 Census, cover cropping is the highest-cost, lowest-adoption practice on this list — and also the one with the clearest long-term soil carbon evidence (10.3% higher soil organic carbon after 10 years, per Carbon Balance and Management). It is the practice most USDA and UK advisers point to first because the measurement base is the strongest.

2. Reduced or No-Till
No-till costs $55.30 per hectare annually in the US — roughly a quarter of cover cropping’s cost — and is already used on 104 million acres of US cropland. It is the practical starting point for a farm that wants to enter carbon farming without a large upfront outlay, though its per-hectare carbon gain in the Carbon Balance and Management study trails cover cropping’s.

3. Agroforestry and Shelterbelts
Agroforestry — integrating trees with crops or livestock — adds a carbon sink above ground as well as below it, plus a second income stream from timber, fruit, or nut production. It also underpins land reclamation work on degraded or arid sites; Farmonaut’s desert farming soil solutions case work applies the same soil-and-cover principles to aridity-stressed land. Neither USDA nor Defra publishes a single national cost-per-hectare for agroforestry conversion comparable to the cover-crop and no-till figures above, since establishment cost depends heavily on species mix and site prep — get a site-specific quote from a local extension service or Farm Woodland Officer rather than relying on a national average.

4. Enrolling in a Payment Programme (USDA or Defra)
This is the step that converts a practice into income. In the US that means applying through your county FSA office for EQIP, CSP, or CIG; in the UK it means enrolling in the Sustainable Farming Incentive or Countryside Stewardship through Defra, where the 2024 rate increase lifted payments for roughly 30,000 existing agreement holders. Both systems require you to document baseline conditions and report on practices adopted — verification is the gate, not a formality.
5. Selling Into the Voluntary Carbon Market
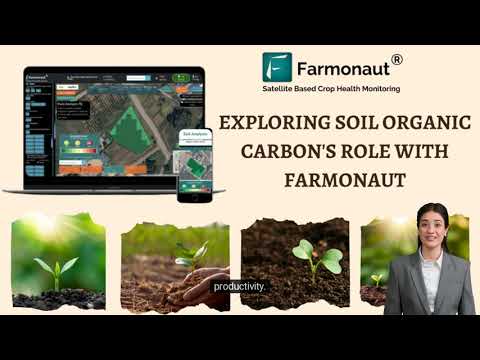
Alongside government payments, nature-based soil and forest carbon credits sold on the voluntary market priced at $7–$24 per ton in 2024–2025, according to GM Insights‘ market analysis. That range reflects genuine price variation by credit type, verification standard, and buyer — not uncertainty in the data. A farm selling verified soil credits at the low end of that range earns roughly a third of what it could earn at the high end for the same ton, so which verifier and buyer you use matters as much as the practice itself. GM Insights and Ecosystem Marketplace publish updated quarterly pricing; SDSU Extension also tracks monthly agricultural carbon market movements if you need a more current figure than the range above.
Comparison Table: Practice, Cost, and Sequestration
| Practice | Annual Cost (USA) | US Adoption (2017 Census) | Carbon Evidence | Source |
|---|---|---|---|---|
| Cover cropping | $202.87/hectare | 3.9% of contiguous US cropland | +10.3% soil organic carbon after 10 years vs. control | Carbon Balance and Management, 2023 |
| No-till / reduced tillage | $55.30/hectare | 104 million acres | Lower per-hectare gain than cover cropping in same study | Carbon Balance and Management, 2023 |
| Existing US cover crop adoption (aggregate) | — | 3.9% baseline | 5.5 million MT CO₂ sequestered annually | USDA/Purdue Center for Commercial Agriculture |
| Agroforestry / shelterbelts | Not nationally published — site-specific quote needed | Not separately tracked in 2017 Census | Adds above-ground carbon sink + secondary income | See local extension / Farm Woodland Officer |
Notice what is missing from this table on purpose: a single “% yield increase” column. No dataset in the research base ties a specific yield percentage to a specific practice for US or UK conditions with a citable figure — most published yield claims for carbon farming trace back to US Corn Belt or Australian trial conditions that do not transfer directly to UK arable or US regional contexts. Where you see a bare “yields improve” claim elsewhere without a number attached, treat it as unverified.
Start with no-till at $55.30/hectare before adding cover cropping at $202.87/hectare — it is the lower-cost entry point with 104 million acres of US precedent to draw on. Track your own baseline with Farmonaut’s Carbon Footprinting module so you have documented evidence before you apply for a payment programme.
Carbon Credit Markets and Verification
Government payments and voluntary carbon credits are not the same money and are not always stackable — check your specific programme’s rules before assuming you can claim both an FSA or Defra payment and sell a credit for the same acre. What both systems share is a hard requirement for verification: no baseline measurement, no practice documentation, no payment.
- 💵 Performance-based payments through EQIP, CSP, and CIG in the US, or Sustainable Farming Incentive and Countryside Stewardship in the UK
- 🔍 Third-party verification underpins both government payments and the $7–$24/ton voluntary credit price range reported by GM Insights
- 🔗 Farmonaut’s traceability tools support the documentation chain buyers and programme administrators ask for
- 📶 Carbon footprint monitoring gives you a dated, reproducible baseline rather than a one-off estimate
- Try it: Run your own numbers
Calculator: Your Practice Mix, Your Numbers
Enter your acreage or hectares and choose your practice mix to estimate annual implementation cost against the US payment average or the UK Sustainable Farming Incentive rate.
Run your own numbers
Assumptions: implementation costs are drawn from a 2023 US-based peer-reviewed study (Carbon Balance and Management) and may not reflect UK input or labour costs. The payment figures are 2024 averages/rates from USDA and Defra and are not guaranteed for your specific holding, soil type, or programme year — confirm current rates with your FSA county office or Defra before budgeting. This calculator excludes voluntary carbon credit income, agroforestry, and any yield change.
Getting Started Without Losing a Season
1. Baseline First
Both USDA and Defra programmes require documented baseline conditions before payments are approved. Map existing soil carbon, cover, and any erosion or nutrient-loss risk zones before you change a single practice — a baseline taken after adoption already begins cannot prove the improvement.
2. Match Practices to Land and Budget
No-till at $55.30/hectare is the lower-cost entry; cover cropping at $202.87/hectare costs roughly 3.7 times as much but carries the stronger long-term soil carbon evidence (10.3% gain after 10 years). Most farms phase in no-till first, then layer cover cropping on higher-value ground once the first practice is generating verified results.
- 🔎 Baseline mapping: document soil and cover conditions with dated records before enrolling
- 🌾 Practice selection: match cost tolerance and land condition to no-till, cover cropping, or both
- 🔗 Verification: keep continuous, timestamped records — this is what both government and voluntary-market reviewers ask for first
- 🚀 Scale up: add agroforestry or additional acreage once your first practice has a verified track record
3. Monitoring
Continuous soil sampling and satellite-based monitoring build the evidence trail both FSA and Defra reviewers, and voluntary-market verifiers, ask for. For large-scale or multi-field operations, Farmonaut’s large-scale farm management tools track land condition across a portfolio rather than field by field.
4. Financing the Transition
Cover cropping’s $202.87/hectare cost is a real cash-flow gap before payments or credits arrive. Crop loan and insurance products can bridge that gap, particularly for a first-year no-till or cover-crop transition where the payment or credit lands after the growing season’s costs are already spent.
Applying for an EQIP, CSP, Sustainable Farming Incentive, or Countryside Stewardship payment without a documented baseline is the single most common reason applications are rejected or delayed. Baseline records are not paperwork — they are the evidence the payment is conditioned on.
How Farmonaut Supports Monitoring and Verification
Farmonaut provides satellite-based monitoring and reporting tools that support the documentation carbon farming payments and credits require, across web, Android, and iOS:
- 🌍 Field-level monitoring of crop condition and land cover changes over time, timestamped for baseline and verification records
- 🔗 Blockchain-based traceability supporting supply-chain documentation for certified or credit-linked production
- 💨 Carbon footprinting tools for building the emissions and sequestration baseline a programme or buyer will ask to see
- 🚚 Large-scale farm management for operations tracking multiple fields or holdings under one carbon farming plan
Developers integrating these capabilities directly can connect through Farmonaut’s API — see the developer documentation for endpoints and authentication.
Satellite-driven insights and monitoring tools for carbon farming documentation — delivered through web, Android, iOS, and API.



Developers: Connect via Farmonaut’s API
(Developer Docs).
Frequently Asked Questions
What is the Carbon Farming Initiative?
In practice, “carbon farming initiative” describes the combined set of US and UK policy programmes — USDA’s EQIP, CSP, and CIG, and the UK’s Sustainable Farming Incentive and Countryside Stewardship — that pay farmers for practices that increase carbon stored in soil or biomass. There is no single unified US or UK “Carbon Farming Initiative Act”; each country runs its own programme structure, and this article covers the actual payment mechanisms in both.
What is a carbon neutral farm, and does the UK have a specific programme for it?
A carbon neutral farm is one where sequestration and emissions reductions offset the farm’s own greenhouse gas output. The UK does not run a single certification called “carbon neutral farming” — the practical route is enrolling in the Sustainable Farming Incentive or Countryside Stewardship (both administered by Defra) and layering practices like cover cropping and reduced tillage until sequestration offsets your farm’s measured emissions, verified through your own carbon footprint tracking.
What are carbon farming payments actually worth?
In the US, $33 per acre on average across USDA climate-smart programmes in 2024. In the UK, £20 per hectare on the first 50 hectares under the Sustainable Farming Incentive management payment, plus separate action-specific payments, with a 10% rate increase applied in January 2024. Both figures are set annually — confirm the current rate with FSA or Defra before applying.
What is eco farming?
Eco farming is a broad term for low-input, biodiversity-supportive farming generally — not a specific programme or payment. Carbon farming is a subset of eco farming focused specifically on measurable carbon storage. If you are searching for eco farming because you want a payment, the programmes that actually pay are the carbon-specific ones covered in this article: USDA’s EQIP/CSP/CIG and the UK’s Sustainable Farming Incentive.
How much does it cost to switch to carbon farming?
In the US, cover cropping costs $202.87 per hectare annually and no-till costs $55.30 per hectare annually, per a 2023 study in Carbon Balance and Management. Neither figure includes payment income, so compare your own cost against your expected USDA or Defra payment using the calculator above before committing acreage.
Can I sell carbon credits and receive a government payment on the same land?
It depends on the specific programme’s rules — some prohibit stacking, others allow it for different practices on the same land. Check your enrollment terms with FSA or Defra directly; this is not standardized across programmes and we could not find a single published rule covering both countries.

What Would Change These Numbers
Three things move the figures in this article, and each has a named way to check it. USDA payment rates are set at the county level and revised annually or semi-annually by the Farm Service Agency — a rate change shows up at fsa.usda.gov or your county office, not in a press release. UK Sustainable Farming Incentive and Countryside Stewardship rates are reviewed annually by Defra from 2025 onward, published at defrafarming.blog.gov.uk. Voluntary carbon credit prices move faster — GM Insights and Ecosystem Marketplace publish quarterly updates, and SDSU Extension tracks monthly agricultural carbon market movements, so the $7–$24/ton range in this article should be treated as a 2024–2025 snapshot, not a permanent price.
What does not change with the payment cycle: the underlying method. Baseline first, then a documented practice, then continuous verification — that sequence is what both USDA and Defra require regardless of what the rate happens to be in a given year, and it is what a voluntary buyer will ask for too. A farm that keeps that sequence intact can slot in a new rate the moment one is published; a farm that skips the baseline has nothing to update.

 Godrej Agrovet
 Hayleys Agriculture
 Linx Agritech
 Adinet
 Save Your Soils
 GalaxEye Space
 Grandstream Algérie
 XOS Realty
 Geospatial Lab Africa
 Agro La Gándara
 HIPSAC
 ZOL Zimbabwe
 Juligerm
 AdBio
AdBio MISE Maroc
 NWNS
NWNS Red August Group
 Farm Inc
 WeMe Global
 Agrotoken
 Blue BearX
 Insignito
 DnCubed
 Indosistim Teknologi
 Liquify Digital
 CU Foods
 BeyondTech Global
 Rouge VC
 AgroRisk
 Oath Inc
 Esri North East Africa
 MDCV UK
 Etech Consulting Madagascar
 Vestlandsforsking
 WB Dev
 Sama Premium
 Tres Valles
 Blickwinkel
 Agricultural Credit Policy Council
 eKGIS
eKGIS Mostas Tech
 Andex
Andex Deluxe Conseil
 WICO
WICO Chimera Innovation
 SkyHarvest
 Teledarbas
 Exurbia Geospatial
 FieldZero
