

Farm Management Software Market: Size, Cost & Top Vendors
Reviewed August 2026 against Fortune Business Insights, Mordor Intelligence, and USDA’s Economic Research Service.
Try it: Farm Management Software Cost-Per-Acre Calculator →
The global farm management software market was valued at $3.20 billion in 2025 and $3.73 billion in 2026, according to Fortune Business Insights — though Mordor Intelligence puts the same 2026 figure at $3.25 billion, a reminder that “market size” depends on which analyst you ask. The United States is the largest single country, at $766.3 million in 2025 per IMARC Group, while the United Kingdom trails at an estimated $0.27 billion in 2026. A short list of companies — Deere, Bayer’s Climate LLC, Trimble, CNH Industrial’s Raven Industries, and BASF — controls most of that revenue, and cloud-delivered software now accounts for the majority of new deployments.
On This Page
Farm Management Software Market Size: The Global Numbers
“Farm management software market” is a category that several research firms track independently, and their numbers do not agree — which is worth explaining before quoting any single figure as gospel. Fortune Business Insights, in a report last updated 20 July 2026, sizes the global market at $3.20 billion for 2025, $3.73 billion for 2026, and projects $13.48 billion by 2034 (a 17.40% CAGR from 2026 to 2034). Mordor Intelligence, updated 29 July 2026, puts 2025 at $2.91 billion and 2026 at $3.25 billion, reaching $5.64 billion by 2031 at an 11.66% CAGR.

Why the Estimates Split by Nearly $1 Billion
The gap between analysts is not noise; it comes from what each firm counts as “farm management software.” Some include standalone precision-farming modules bundled with hardware (autosteer, sprayer controllers) as software revenue; others count only pure-play SaaS subscriptions. Both approaches are defensible, so the honest move is to treat published figures as a range rather than a single number, and to note which methodology produced the figure you are citing.
United States Farm Management Software Market
The United States farm management software market generated $766.3 million in 2025 and is projected by IMARC Group to reach $1,860.1 million by 2034, a 10.04% CAGR from 2026 to 2034. Fortune Business Insights frames North America (US plus Canada and Mexico) more broadly at $1.04 billion in 2025 — 32.40% of global revenue — rising to $1.18 billion in 2026. Mordor Intelligence puts North America’s 2025 share even higher, at 37.2% of global revenue, calling it the single largest region in the market.
Behind the software spend is a documented, uneven pattern of on-farm technology adoption that the software market tracks closely. USDA’s Economic Research Service reported that 27% of US farms and ranches used some precision-agriculture practice in 2023, based on Agricultural Resource Management Survey (ARMS) data published 10 December 2024. Adoption rises sharply with scale: guidance autosteer systems ran on 52% of midsize farms and 70% of large-scale crop-producing farms, while yield monitors, yield maps, and soil maps reached 68% of large-scale crop farms. This is the demand-side reality that US-focused farm management software vendors are selling into — a market where the largest operations are already digitized and the growth opportunity sits with midsize and small operations.
Those adoption percentages come from ARMS, a survey USDA runs annually with NASS; ERS republishes updated charts as new survey years clear review, so readers who need a fresher number than 2023 should check the ERS chart of precision agriculture adoption directly for the current release.
UK Farm Management Software Market
The UK farm management software market was sized at $0.27 billion for 2026 by Fortune Business Insights, inside a European regional total of $0.99 billion (up from $0.84 billion in 2025, 26.10% of global revenue). For comparison, Germany — Europe’s other major named market in that report — sits close behind the UK at $0.23 billion in 2026, and North America remains far larger at $1.18 billion. The UK is a smaller, denser market than the US: fewer, on average smaller, holdings, and a software buying pattern shaped as much by Environmental Land Management scheme record-keeping requirements as by yield optimization.
On the adoption side, Defra runs the Farm Practices Survey, its annual tracker of GPS guidance, soil mapping, variable-rate application, and crop sensing on English farms — the February 2026 edition was published 11 June 2026. Rather than repeat a single adoption percentage that will be superseded by the next release, the durable move is to pull the current dataset directly from the Farm Practices Survey collection on GOV.UK before quoting a UK adoption figure to a client or in a report.

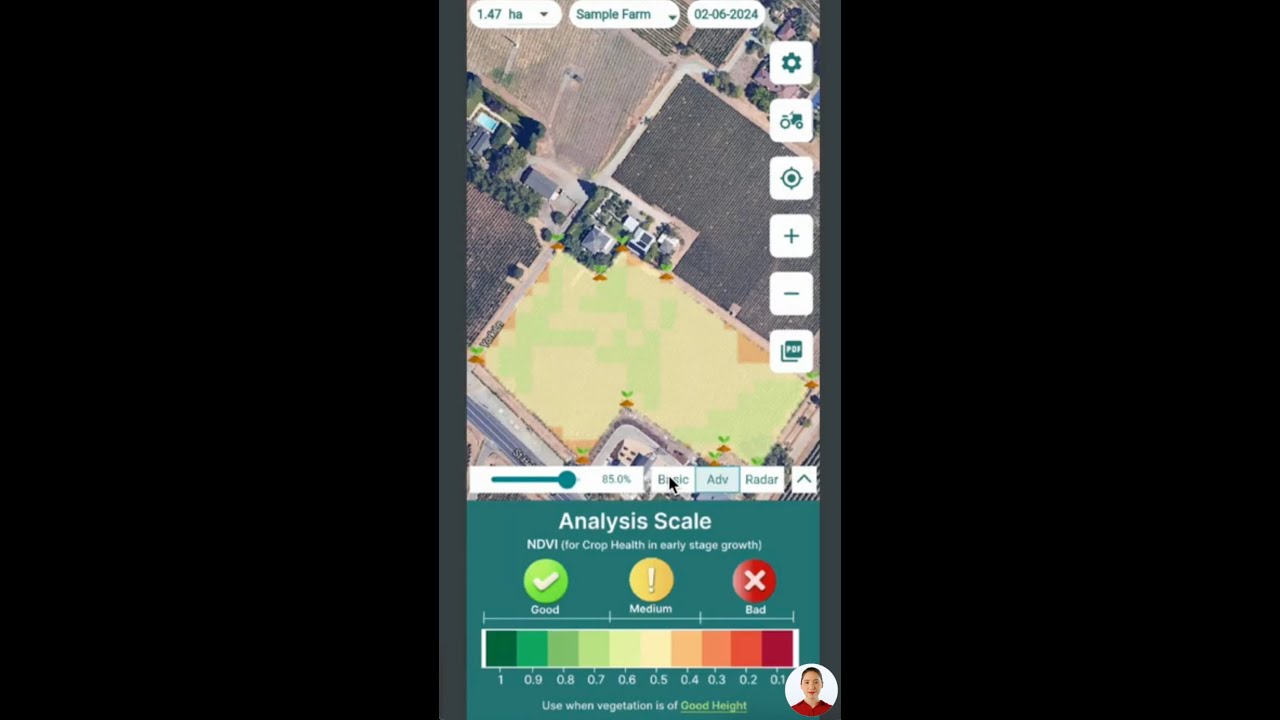
Web-based access matters more in the UK market than the raw software figures suggest: a farm relying on patchy rural mobile coverage needs a platform that works from a desktop or laptop as well as a phone. Farmonaut’s web app and Android app cover both cases from one account.
Farm Management Software Companies: Who Actually Competes
“Farm management software companies” is dominated, in revenue terms, by a small group. Mordor Intelligence names Deere & Company, Bayer AG (through Climate LLC), CNH Industrial (through Raven Industries), AGCO Corporation (through Trimble), and BASF SE as the five vendors that, combined, hold a majority of 2025 global revenue. Fortune Business Insights’ competitive-landscape list adds mid-market and pure-software names that compete below that top tier: Agrivi, Granular, Topcon, AgJunction, Agworld, Farmers Edge, and Conservis.
| Company | Headquarters | Core Product | Published List Pricing? |
|---|---|---|---|
| Deere & Company | Moline, Illinois, US | Operations Center | Quote-only |
| Trimble Inc. (AGCO) | Westminster, Colorado, US | Trimble Ag Software | Quote-only |
| Climate LLC (Bayer) | St. Louis, Missouri, US | Climate FieldView | Quote-only |
| Raven Industries (CNH Industrial) | Sioux Falls, South Dakota, US | Raven Slingshot | Quote-only |
| BASF Digital Farming | Limburgerhof, Germany | xarvio Field Manager | Quote-only |
| Granular Inc. (Corteva) | San Francisco, California, US | Granular Business | Quote-only |
| Topcon Positioning Systems | Tokyo, Japan | Topcon Agriculture | Quote-only |
| Farmers Edge | Winnipeg, Canada | FarmCommand | Quote-only |
| Farmonaut | Kolkata, India (global, Android-first) | Satellite crop monitoring & advisory | Published — live table below |
Vendor list compiled from Fortune Business Insights and Mordor Intelligence competitive-landscape sections; headquarters are the companies’ own stated locations.
Two structural facts follow from that table. First, most of the recognizable brand names are business units of much larger agribusiness or agricultural-equipment conglomerates — Climate FieldView is a Bayer property, Raven is CNH Industrial’s, Granular is Corteva’s — so their software roadmap tracks their parent’s equipment and chemical strategy, not the standalone software market. Second, list pricing is the exception rather than the rule: checking Climate FieldView’s own listing on the software directory Capterra returns “Contact vendor for pricing” rather than a published rate, which is typical of the segment’s largest players.

Pricing Models, Deployment, and a Cost-Per-Acre Calculator
Cloud and SaaS delivery accounted for 72.31% of the market in 2026 by Fortune Business Insights’ segmentation, against 27.69% for on-premises deployment. Mordor Intelligence’s segmentation reads differently — it puts desktop delivery at 50.4% of 2025 revenue — a gap that again traces back to how each firm defines “desktop” versus a browser-based client running on a desktop machine. Within Fortune Business Insights’ application breakdown, precision farming was the largest single segment at 21.53% of 2026 revenue, and farmers (rather than agribusiness intermediaries) made up 30.56% of the end-user share. Mordor Intelligence separately reports that large farms of 500 hectares or more accounted for 40.2% of 2025 market size — the segment with both the budget and the acreage to justify a subscription.
None of the major vendors in the table above publish a rate card, so pricing has to be requested per farm. The structures they quote in, however, follow one of four patterns, largely unchanged from earlier software generations:
- Flat annual or monthly subscription — one price for the account regardless of acreage, often tiered by number of users or feature set.
- Per-acre or per-hectare pricing — the quote scales directly with the area you enroll, common for satellite-imagery and precision modules.
- Per-seat pricing — the quote scales with the number of logins, common for team- and admin-facing platforms managing multiple field staff.
- Freemium plus paid add-ons — a free base tier (record-keeping, reminders) with satellite analytics, carbon tracking, or advanced reporting unlocked as a paid upgrade, the model behind features like carbon footprint monitoring.
Because vendors quote in three different units, the same offer can look cheap or expensive depending on your farm size. The calculator below converts any quote — flat, per-acre, or per-seat — into a single comparable cost-per-acre figure.
Farm Management Software Cost-Per-Acre Calculator


How to Choose Farm Management Software
Market size and vendor lists change every year; the questions worth asking a vendor do not. Use this sequence regardless of which year you are reading this in:
- Define the job first. Crop planning, financial tracking, traceability for export buyers, and multi-site labor management call for different feature sets — few platforms do all four equally well.
- Ask for the price in your unit. Given the flat / per-acre / per-seat split above, get every competing quote converted to a cost-per-acre basis before comparing, using the calculator above if the vendor won't do it for you.
- Test offline behavior on your own network. If you farm anywhere outside strong 4G or broadband coverage, ask specifically what data entry and syncing look like with no signal — do not take "cloud-based" as a guarantee it works in a dead zone.
- Check what happens to your data if you cancel. Export formats and retention periods vary by vendor and rarely appear on the pricing page; ask before signing, not after.
- Confirm integration with equipment you already own. A platform with a documented, versioned API — such as Farmonaut's satellite and weather API docs — is easier to evaluate than one where integration is promised verbally.
- Match compliance features to your buyer's requirements. If you sell into a supply chain that requires traceability documentation, verify the software's export/report format against what your buyer actually accepts, not just that it has a "traceability" feature.
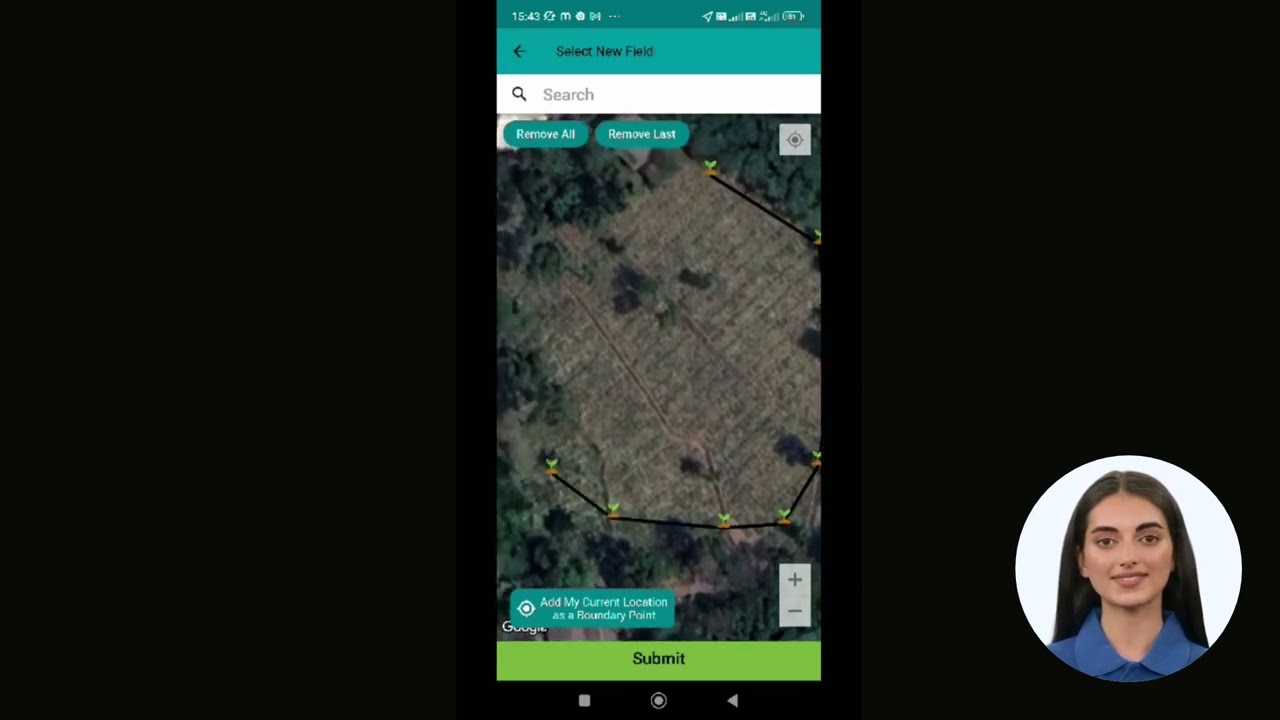
Farmonaut: Satellite-Based Management on Android
Farmonaut is the one company in the vendor table above that publishes its pricing rather than routing every visitor to a sales call. Its live rate card is embedded below and updates automatically, so it reflects the current tiers rather than a snapshot that ages out.
- Satellite-Based Monitoring: Multispectral analysis of crop health, soil, and field conditions without additional field hardware, paired with the Jeevn AI advisory system for crop- and region-specific recommendations.
- Blockchain Traceability: Farm-to-buyer supply chain records — see full product traceability details here — relevant to the export and compliance question raised in the section above.
- Fleet and Resource Management: Farmonaut Fleet Management tracks vehicles and machinery across a farm's operating area.
- Financial Verification for Lending and Insurance: Satellite-based verification supports crop loan and insurance approvals.
- Large-Scale Operations: The Agro Admin App coordinates multi-location teams and contract-farming arrangements — the per-seat use case described in the pricing section.
- API Integration: Farmonaut's satellite intelligence API can be built into a buyer's own systems, documented at the developer docs link above.


Frequently Asked Questions
How big is the farm management software market?
Fortune Business Insights values it at $3.73 billion for 2026, headed toward $13.48 billion by 2034 (17.40% CAGR). Mordor Intelligence's independent estimate is $3.25 billion for 2026, reaching $5.64 billion by 2031 (11.66% CAGR). Both are legitimate; they differ on what counts as software revenue versus bundled hardware/software revenue.
How big is the US farm management software market specifically?
IMARC Group puts the United States market at $766.3 million in 2025, growing to $1,860.1 million by 2034. Fortune Business Insights' broader North America figure (including Canada and Mexico) was $1.04 billion in 2025 and $1.18 billion in 2026.
How big is the UK farm management software market?
Fortune Business Insights sizes it at $0.27 billion for 2026, within a European total of $0.99 billion. For farm-level adoption data rather than market revenue, Defra's Farm Practices Survey is the primary source; its most current dataset is on GOV.UK's Farm Practices Survey collection page.
Which companies dominate the farm management software market?
By 2025 revenue share, Mordor Intelligence names Deere & Company, Bayer AG (Climate LLC), CNH Industrial (Raven Industries), AGCO Corporation (Trimble), and BASF SE as holding a majority between them. Below that tier, Fortune Business Insights lists Agrivi, Granular, Topcon, AgJunction, Agworld, Farmers Edge, and Conservis as active competitors.
Why don't farm management software companies publish their prices?
Most quote per farm because pricing depends on acreage, module selection, hardware bundling, and multi-year contract terms — variables that don't compress into one number. Checking Climate FieldView's own Capterra listing confirms this directly: it shows "Contact vendor for pricing" rather than a rate card, which is standard for the market's largest platforms.
Can farm management software work without reliable internet?
Many Android-based platforms, including Farmonaut's app, support offline data entry that syncs once connectivity returns — worth confirming directly with any vendor if you farm in an area with unreliable mobile signal, since offline support is not universal across the category.
How do I access Farmonaut on Android or the web?
The Android app is on Google Play; the same account also works through the web app for desktop or laptop access.
The Bottom Line
The farm management software market is real, growing by every published estimate, and led by a handful of equipment and agrichemical majors whose software arms rarely publish a price. The US market is roughly triple the size of the UK's by most analyst estimates, and adoption inside both countries tracks farm size closely — the largest operations are already digitized, and the growth is happening at the midsize and small end. None of that changes what a buyer actually needs to check before signing: the price converted to your own cost-per-acre basis, offline behavior on your actual network, data portability on exit, and whether the API or integration claims are documented rather than promised. Re-pull the USDA, Defra, and analyst figures cited here from their live sources before quoting them forward — each updates on its own schedule, and this page names exactly where to find the current version of every number in it.

 Cresol
 Atur Kuliner
 GlobalQuant
 MDCV UK
 Zerella Group
 Etech Consulting Madagascar
 Vestlandsforsking
 Agritein
 Delicio
 WB Dev
 Sama Premium
 Prochecker
 Tres Valles
 LACOS Geoinformation
 Magrifly
 LatConnect 60
 Blickwinkel
 Agricultural Credit Policy Council
 Marei Nursery
 eKGIS
eKGIS Mostas Tech
