

Reviewed August 2026 against USDA NASS Land Values Summary, USDA ERS, and iProperty Management real estate ROI research.
Try it: Run your own numbers →
US cropland averaged $6,020 per acre and pastureland $2,000 per acre in 2026, per the USDA National Agricultural Statistics Service (NASS) Land Values Summary. Cropland values rose 3.3% and pastureland 4.2% over the prior year, while residential real estate has been generating an average annual ROI of 10.6% over 2025–2026 according to iProperty Management’s real estate research. Neither asset class is categorically “better” — they behave differently across cycles, liquidity, and management effort, and this article breaks down where each wins.
Farmland Real Estate Investing: The Current Numbers
Anyone researching farmland real estate investing is really asking two separate questions: what does farmland cost today, and how does owning it compare with owning a house, an apartment building, or a REIT share. USDA NASS answers the first question every year through its Land Values Summary, drawn from a survey of US farm operators and released each August. The July 2026 edition puts the average value of farm real estate — land and buildings combined — at $4,500 per acre, up from levels that have compounded into a 79% cumulative increase between 2012 and 2026. That 14-year run rate works out to roughly 4.2% average annual appreciation, which lands close to residential real estate’s more recent 10.6% average annual ROI figure — though the two numbers aren’t measuring identical things, since the real estate figure includes rental income and the farmland figure is land value appreciation only.
Cropland specifically has moved faster than the farm real estate average: 21.8% cumulative appreciation from 2022 to 2026, according to the same NASS release. That’s the number worth anchoring to if the search that brought you here was some version of “farmland real estate investment” — it’s the closest thing to a single headline figure the USDA publishes, and it updates annually.
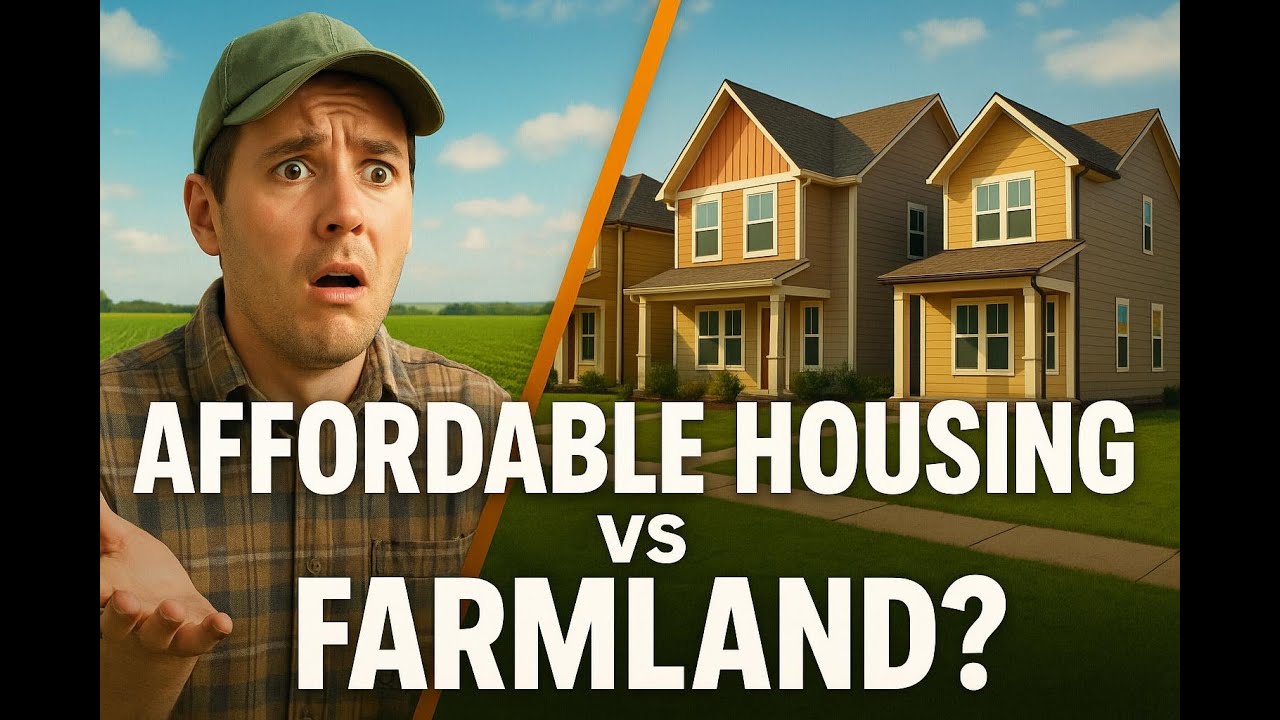
The pressure behind those numbers is structural, not seasonal: cities expanding into agricultural fringe land, food-security policy pushing against conversion, and a fixed supply of arable acres competing with subdivision and commercial development. Whichever way that tension resolves in a given county, it shows up first in the NASS land value survey — which is why checking the current release before making any comparison matters more than any commentary written about it.
Farmland vs Real Estate: The Structural Differences
Before comparing returns, it helps to separate what actually differs between the two asset classes:
- Farmland value is driven by soil quality, water rights, topography, regional climate, and crop-specific productivity. USDA NASS tracks this by state and land-use category (cropland vs pastureland) rather than as one blended number, because a Corn Belt cropland acre and a Southwestern pastureland acre don’t move together.
- Real estate value is driven by location, accessibility, zoning, and proximity to employment centers. Its returns, per iProperty Management’s tracking, combine price appreciation with rental income and are typically benchmarked against the S&P 500 and REIT indices rather than against a USDA land-use survey.
- Liquidity is the sharpest practical difference: a residential property can be listed, financed, and closed in weeks in most US markets; farmland transactions are thinner, often negotiated directly between neighboring operators, and a parcel can sit on the market for a season or more depending on the county.
- Income mechanics differ too — farmland income comes from cash rent or crop share (typically negotiated annually against local yield and commodity price expectations), while real estate income comes from lease or rental agreements that are more standardized and easier to model.
This is also where “digital farming real estate” as a search term starts to make sense: the technology layer — satellite monitoring, IoT sensors, precision guidance — is what’s increasingly used to underwrite farmland’s productivity claims the way an appraisal underwrites a house’s condition. A digitally monitored parcel with documented yield history and input efficiency is a different underwriting proposition than one with none.
Farmland vs Real Estate Returns: The Data
This is the question most searches land on directly: farmland vs real estate returns, side by side. Here’s what’s actually published, without blending incompatible numbers into one estimate:
- US cropland value: $6,020/acre average (2026), +3.3% year-over-year, +21.8% over 2022–2026 — USDA NASS.
- US pastureland value: $2,000/acre average (2026), +4.2% year-over-year — USDA NASS.
- US farm real estate (land + buildings) value: $4,500/acre average (2026), +79% over 2012–2026 — USDA NASS.
- Residential real estate: 10.6% average annual ROI over 2025–2026 — iProperty Management research, which also tracks commercial property and REIT benchmarks separately.
Farmland’s appreciation figures above are land-value-only — they exclude any cash rent or crop-share income a landowner collects on top, which is the farmland equivalent of a rental yield. NASS’s Land Values Summary does not itself report a blended total-return figure combining appreciation and rental income the way iProperty Management’s real estate ROI figure does, so a strict apples-to-apples comparison isn’t publishable from these two sources alone. For a risk-adjusted comparison against equities specifically, Purdue University’s Department of Agricultural Economics publishes ongoing analysis of farmland against alternative investments — see Purdue Center for Commercial Agriculture for the methodology and latest figures.
If you’re trying to decide between “investing in farmland vs real estate” for a specific allocation, the honest framing is that they answer different portfolio needs: farmland has historically shown low correlation with equity and urban housing cycles, which is the diversification case institutional allocators make for it, while residential real estate offers more liquidity, more standardized financing, and a income stream. Neither NASS nor iProperty Management publishes a single number that settles which wins — what’s published is enough to model your own required return, which the calculator further down this page does using the figures above.

Agribusiness Real Estate as an Asset Class
“Agribusiness real estate” describes farmland managed with the operational discipline of a commercial real estate portfolio — unified acquisition, professional management, and increasingly, the kind of digital monitoring that lets an owner verify productivity claims remotely rather than taking a seller’s word for yield history.
- Diversification rationale: farmland’s return drivers (crop prices, weather, soil productivity) move independently of urban real estate’s drivers (interest rates, employment, zoning), which is the core argument institutional allocators use when adding farmland to a mixed portfolio.
- Scale economics: larger, professionally managed farmland holdings can spread fixed costs — surveying, compliance, equipment — across more acres, similar to how a REIT spreads management overhead across a property portfolio.
- Verification layer: digital monitoring tools let an owner or investor check soil, water, and crop-health metrics on a parcel without a site visit, closing some of the information gap that has historically made farmland harder to underwrite at a distance than a house or office building.
None of this changes the fundamental input: value still traces back to the same USDA NASS per-acre figures above. What digital tools change is confidence in the productivity assumptions behind that value — which matters more the further an investor is from directly operating the land.

Digital Farming Real Estate: What’s Actually Being Adopted
“Digital farming real estate” is a newer search phrase, and the honest answer is that most of the underlying technology adoption data comes from USDA’s Economic Research Service (ERS), not from a real estate source — because digital farming adoption is tracked as a production practice, not a property attribute. The ERS Precision Agriculture study found that more than 50% of acreage planted to corn, cotton, rice, sorghum, soybeans, and winter wheat used guidance/autosteering systems as of 2019, the most recent year with published commodity-level adoption figures. More granular precision tools — yield mapping, soil mapping, and variable rate technology — were used on a smaller 5–25% of acreage across winter wheat, cotton, sorghum, and rice.
That gap — basic guidance systems near universal, granular data-driven tools still a minority practice — is the real state of “digital farming” in the US, and it’s worth naming plainly rather than rounding up. USDA ERS updates this tracking through its Agricultural Resource Management Survey; the current release is available at USDA ERS Precision Agriculture in the Digital Era, and newer editions should appear under ERS’s data products page as ARMS cycles are published. Two categories the research brief behind this article could not source current figures for — soil health monitoring adoption and irrigation/water technology adoption broken out by type — are tracked only in aggregate by the GAO, and adoption by individual US state or region isn’t disaggregated in the current ERS release either; if you need a state-specific figure, USDA’s Quick Stats tool at quickstats.nass.usda.gov is the place to query it directly.
Technologies most commonly cited in this space include IoT soil-moisture and weather sensors, AI-based yield and disease forecasting, automated irrigation and variable-rate input application, and blockchain-based product traceability — but published adoption percentages exist only for the guidance and mapping categories above. Where this article states a number, it’s from the ERS study; where it doesn’t, that’s a genuine gap in public data, not an oversight.

Estate Farming: Modern Management Models
“Estate farming” — large, unified landholdings run with commercial-scale management — increasingly resembles a real estate investment trust structure applied to agricultural land. The characteristics that define it:
- Unified management across multiple parcels or counties, allowing input purchasing, labor, and equipment to be coordinated at scale rather than parcel by parcel.
- Remote monitoring using satellite imagery and field sensors to track crop health and resource use across geographically dispersed acreage without a manager physically visiting every field.
- Diversified land use — combining row-crop production, pasture, agroforestry, and in some cases renewable energy leasing (solar or wind easements) on the same holding to generate multiple income streams from one asset.
- Institutional capital increasingly participates in this model precisely because unified management and remote verification reduce the due-diligence burden that has historically kept large allocators out of direct farmland ownership.
For a farm or estate manager evaluating whether to move to this model, the practical starting point is usually large-scale field management software — see Farmonaut’s Large Scale Farm Management App for satellite-based field monitoring built for multi-parcel operations.

Comparison Table: Farmland vs Urban Real Estate
The table below uses only figures published in the sources cited throughout this article — no blended or estimated rows. Where the two asset classes are measured on genuinely different bases (land-value appreciation vs total ROI including income), that’s noted rather than forced into a false comparison.
| Metric | Farmland | Residential Real Estate |
|---|---|---|
| Average value / basis | $6,020/acre cropland, $2,000/acre pastureland (2026) | Varies by market; not tracked as a single national per-unit figure in this brief |
| Recent annual appreciation | Cropland +3.3%, pastureland +4.2% (2026 vs 2025) | Not separately isolated from total ROI in the cited source |
| Average annual ROI (incl. income) | Not published as a blended total-return figure by NASS | 10.6% (2025–2026, includes rental income) |
| Cumulative appreciation | Cropland +21.8% (2022–2026); farm real estate +79% (2012–2026) | Not in this brief; NAR tracks historical home price indices separately |
| Liquidity | Lower — thinner transaction market, often negotiated directly | Higher — standardized listing, financing, and closing process |
| Primary data source | USDA NASS Land Values Summary (annual, each August) | NAR and REIT/NCREIF indices (quarterly) |
Where this table leaves a cell as “not published,” that’s deliberate: forcing a number into it would be the exact fabrication this article is built to avoid. Use the refresh paths named throughout this piece to pull the current figure yourself when you need it.

Calculator: Farmland Purchase vs Residential Rental Return
Use your own numbers against the two return bases cited above — farmland’s land-value appreciation rate and a rental property’s total annual ROI — to see what each path is projected to return on the capital you’d actually commit.
Run your own numbers
Assumptions: farmland return is land-value appreciation only and excludes cash rent or crop-share income, property taxes, and transaction costs; real estate return uses the entered ROI figure as a flat annual compounding rate and excludes financing costs, vacancy, and maintenance. Default rates are the 2026 NASS cropland/pastureland figures and the 2025–2026 iProperty Management residential ROI figure cited in this article — replace them with current figures from the sources linked above before relying on the output.
Investment Strategies for Farmland Real Estate
Investors approaching farmland real estate investment tend to cite a consistent set of reasons, each of which has a direct data anchor:
- Food security demand: as population and consumption grow, productive farmland underpins the supply chain in a way that doesn’t have a substitute asset.
- Historically low correlation with urban real estate cycles: farmland values respond to commodity prices and weather; urban real estate responds to interest rates and employment — the two don’t move in lockstep, which is the diversification case.
- Steady long-run appreciation: the 79% cumulative farm real estate value increase from 2012–2026 reflects a 14-year compounding trend rather than a single strong year, per NASS.
- Ancillary income layers: carbon credit programs, renewable energy leasing, and agro-tourism are increasingly stacked onto farmland ownership as secondary revenue, on top of the core land value tracked by NASS.
For quantifying the carbon side of that ancillary income specifically, tools like Farmonaut’s Carbon Footprinting platform let a landowner or investor measure and benchmark agricultural carbon impact — an increasingly requested metric when farmland is being evaluated for sustainability-linked financing.

A Practical Checklist Before Comparing Farmland Against Any Real Estate Deal
- Pull the current NASS state-level land value for the county or state you’re evaluating at NASS Land Values Summary — national averages mask wide state-by-state variation.
- Separate appreciation from income in any farmland pitch — ask specifically what the cash rent or crop-share yield is, since land value growth alone (the NASS figure) is not a total return.
- Check the precision-agriculture profile of the land in question against the ERS adoption figures above — a parcel already using guidance and mapping systems has a documented productivity baseline; one that isn’t, doesn’t.
- Compare against your real estate alternative on the same time horizon — a 5-year hold and a 20-year hold favor different assets given farmland’s lower liquidity.
- Verify with independent research — Purdue’s Center for Commercial Agriculture publishes ongoing farmland-vs-alternative-investments analysis at the link above; it’s a useful second opinion against any single year’s NASS release.
Sustainability and Smart Technology in Valuation
Land buyers and lenders increasingly weight sustainability metrics alongside the traditional soil-and-water fundamentals when pricing farmland. The metrics most commonly cited across the industry — carbon sequestration rate, water-use efficiency, and biodiversity indicators — don’t yet have a single standardized national benchmark the way land value does through NASS, so any specific score attached to a property should be sourced directly from whoever produced it.
Traceability is a related but separate layer: verifying that what leaves a farm matches what’s claimed about it. Tools like Farmonaut’s Product Traceability solution support that verification chain, which increasingly matters for buyers paying a premium for documented sustainable production.

How Farmonaut Fits Into Digital Farming Real Estate
Farmonaut’s platform is built for exactly the verification gap described above — giving a landowner, farm manager, or remote investor a way to check field-level conditions without a site visit.
- Satellite-based monitoring: multispectral imagery for ongoing soil, crop-health, and field condition tracking, supporting the kind of documented productivity history that strengthens a farmland asset’s underwriting.
- Jeevn AI advisory: real-time, AI-generated recommendations for irrigation, pest, and fertilizer decisions, aimed at improving yield and reducing input waste.
- Fleet and resource management: coordinating vehicles and equipment across large or multi-parcel estates. See Farmonaut’s Fleet Management platform.
- Environmental impact tracking for compliance and sustainability reporting via Farmonaut’s Carbon Footprinting solutions.
The platform is available on Android, iOS, and web, so land managers and remote investors can check conditions from wherever they are.



For system integrations and custom automations, developers can access the public API and documentation at Farmonaut API Developer Docs.
Farmers seeking loans or insurance validation can use satellite-based crop loan and insurance services, which reduce fraud risk and speed up verification for agricultural finance.
FAQs: Farmland vs Real Estate Investing
Is farmland a better investment than real estate?
Neither has a universal answer — US cropland averaged $6,020/acre with 3.3% annual appreciation in 2026 (USDA NASS), while residential real estate averaged 10.6% annual ROI including rental income over 2025–2026 (iProperty Management). Farmland’s figure excludes rental/crop-share income, so it understates farmland’s total return; a fair comparison requires adding the specific cash rent for the parcel in question.
What is the average return on farmland real estate investment?
USDA NASS reports cropland value appreciation of 3.3% and pastureland at 4.2% for 2026 versus 2025, with a 21.8% cumulative cropland gain from 2022–2026. These figures are land-value appreciation only; total return including cash rent or crop-share income is not published as a single blended figure by NASS and should be calculated using the specific lease terms for a given parcel.
How does farmland vs real estate compare over the long term?
US farm real estate value rose 79% cumulatively from 2012 to 2026, per NASS. For a risk-adjusted comparison against equities and other alternative investments over a similar horizon, Purdue’s Center for Commercial Agriculture publishes ongoing analysis at the link in this article.
What is digital farming real estate?
It refers to farmland managed and valued with the support of digital tools — satellite monitoring, IoT sensors, AI-based advisory, and precision guidance systems. USDA ERS found over 50% of US acreage planted to corn, cotton, rice, sorghum, soybeans, and winter wheat used guidance/autosteering as of 2019, while more advanced tools like yield mapping and variable rate technology were used on 5–25% of acreage for winter wheat, cotton, sorghum, and rice.
Can digital technology help secure loans and insurance for farmers?
Yes. Platforms like Farmonaut’s satellite-based crop loan and insurance service allow real-time verification of agricultural assets, simplifying access to financial products.
Where can I check the current farmland value for my state?
USDA NASS publishes state-level land values annually each August in its Land Values Summary, and county-level detail is searchable through Quick Stats at quickstats.nass.usda.gov. National averages in this article will be superseded by the next annual release — always check the current edition before making a purchase decision.
Conclusion: Tracking These Numbers Going Forward
The comparison between farmland and real estate isn’t settled by a single ratio — it’s settled by which published figures you check, how recently they were updated, and whether you’re comparing appreciation-only numbers against total-return numbers. The durable method here is simple: pull the current NASS Land Values Summary each August for farmland’s baseline, pull the current NAR or REIT benchmark for real estate’s baseline, and add the specific income component (cash rent, crop share, or rental yield) that applies to the actual asset in front of you — never compare a bare land-appreciation figure against a total-return figure and call it apples-to-apples.
For the digital farming layer, USDA ERS’s Agricultural Resource Management Survey is the source to check for updated technology adoption rates as new cycles are published. Both data sources are public, free, and updated on a predictable annual or multi-year cycle — bookmark them rather than this article’s numbers, which will age.
Explore related tools: large farm management, carbon footprinting, fleet optimization, and product traceability.
Recommended Reading:
Carbon Footprinting for Sustainable Agriculture |
Large Scale Farm Management Tools |
Blockchain Traceability in Agribusiness

 Godrej Agrovet
 Hayleys Agriculture
 Linx Agritech
 Adinet
 Save Your Soils
 GalaxEye Space
 Grandstream Algérie
 XOS Realty
 Geospatial Lab Africa
 Agro La Gándara
 HIPSAC
 ZOL Zimbabwe
 Juligerm
 AdBio
AdBio MISE Maroc
 NWNS
NWNS Red August Group
 Farm Inc
 WeMe Global
 Agrotoken
 Blue BearX
 Insignito
 DnCubed
 Indosistim Teknologi
 Liquify Digital
 CU Foods
 BeyondTech Global
 Rouge VC
 AgroRisk
 Oath Inc
 Esri North East Africa
 MDCV UK
 Etech Consulting Madagascar
 Vestlandsforsking
 WB Dev
 Sama Premium
 Tres Valles
 Blickwinkel
 Agricultural Credit Policy Council
 eKGIS
eKGIS Mostas Tech
 Andex
Andex Deluxe Conseil
 WICO
WICO Chimera Innovation
 SkyHarvest
 Teledarbas
 Exurbia Geospatial
 FieldZero
