

Soil · Practice guide
Sustainable Soil Management: 7 Practices and What They Pay
Sustainable soil management keeps soil growing crops, storing water and cycling carbon without wearing it down. FAO estimates about 33% of global soils are moderately or highly degraded. Here are seven practices, what each fixes, and what US data say about the money.
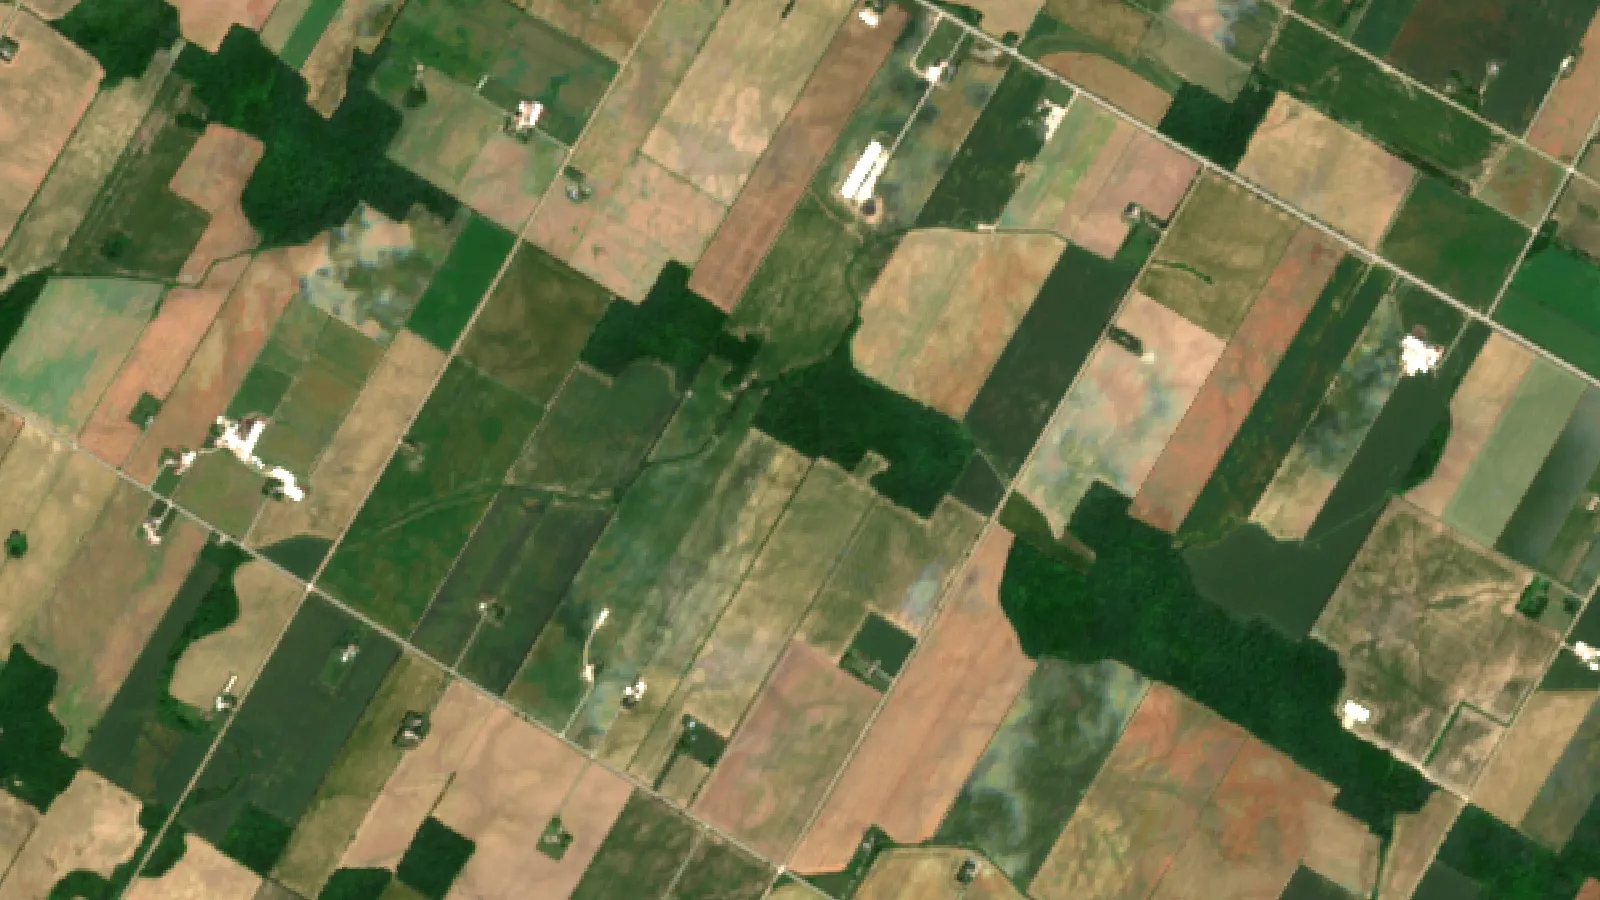
Key takeaways
- FAO estimates about 33% of global soils are moderately or highly degraded (2017).
- US cropland erosion rates fell 34% from 1982 to 2022 (USDA NRCS).
- Residue on 20% of the surface can cut erosion by about half compared with a bare field (University of Nebraska-Lincoln).
- No-till covered 27.5% and cover crops 4.7% of US cropland in 2022 (Choices, 2024).
- 100 adopters reported US$52 per acre more net income on corn (Soil Health Institute), but a USDA ERS literature review says short-term cover crop returns are often negative without financial help.
In this article
Sustainable soil management means farming so that soil keeps doing its jobs, growing crops, storing water and carbon, and filtering water, without wearing down. The FAO Voluntary Guidelines (2017) use that test and estimate that about 33% of global soils are moderately or highly degraded. This guide covers seven practices: keep soil covered, disturb it less, plant cover crops, rotate crops, feed it by soil test, add organic matter and protect it from compaction. Measuring the results ties them together.
This guide sets out those practices in a suggested order, says what each fixes, gives US adoption data where it exists, and shows where the money works and where it does not. A calculator lets you test one practice on your own acres.
What sustainable soil management means
The FAO definition has two parts. Soil services must be kept or improved. The soil functions and biodiversity behind those services must not be seriously harmed. So a system that raises yield this year but loses topsoil or organic matter does not pass, even if it looks profitable for a while.
The same FAO guidelines list ten threats to work against: erosion by water and wind, loss of organic carbon, nutrient imbalance, salinization, contamination, acidification, loss of soil biodiversity, sealing, compaction and waterlogging. FAO calls erosion the most significant threat to global soils. It puts the loss at about 75 billion tons of soil a year from arable land, at a cost of about US$400 billion a year in lost production. Those are global estimates, not a measure of any one farm.
Five principles follow from that list:
- Protect structure and life. Organic matter holds aggregates and pores together, and soil organisms cycle nutrients.
- Balance nutrients. Replace what crops remove, based on a test, so soil neither runs down nor leaks surplus.
- Manage water. Help rain soak in, hold it in the root zone, and drain what would cause waterlogging.
- Stop physical loss. Reduce erosion and compaction before trying to rebuild.
- Build carbon where it is realistic. Treat it as a slow gain, and one that can be lost again.

▶ Why soil organic carbon matters for soil structure and farming. · 12:28
How much soil is being lost on farms
In the US, the erosion rate has fallen, but the loss has not stopped. The USDA NRCS 2022 National Resources Inventory reports that cropland erosion rates fell 34% between 1982 and 2022. Water erosion fell to 2.67 tons per acre per year and wind erosion to 2.08.
Chart
Average erosion on US cropland, 1982 vs 2022
tons per acre per year, national average
In Europe, Eurostat estimates that 5.1% of the EU’s erodible land outside built-up areas was at risk of severe water erosion in 2023, about 190,000 km². Progress has slowed: the area shrank 3.4% from 2016 to 2023, against 13.4% from 2000 to 2016.
Rules are moving too. The EU Soil Monitoring Law entered into force on 16 December 2025. It requires Member States to monitor and assess soil health, and its goal is healthy soils by 2050. Member States have until 16 December 2028 to bring it into national law, so check how your own country applies it.
7 sustainable soil management practices, in order
The order below is a suggested sequence, not a ranking from a study. It starts with steps that stop losses, because rebuilding soil that is still washing away wastes money. Pick what fits your soil, climate and rotation.
| Practice | Threat it tackles | Main catch | Best for |
|---|---|---|---|
| 1. Keep soil covered | Erosion, water loss | Residue can slow spring warming | Sloping or windy fields |
| 2. Reduce tillage | Erosion, carbon loss | Yield can dip without residue and rotation | Dry climates, erodible land |
| 3. Cover crops | Erosion, nutrient loss | Short-term return is often negative | Fields with a fallow gap |
| 4. Rotate crops | Pests, nutrient imbalance | Needs a market for each crop | Corn or wheat monocultures |
| 5. Test and balance | Nutrient imbalance, acidity | Results depend on good sampling | Every field |
| 6. Add organic matter | Carbon loss, low water holding | Slow gains, haul cost | Farms near manure or compost |
| 7. Limit compaction | Compaction, waterlogging | Timing and machinery limits | Heavy soils, wet harvests |
1. Keep the soil surface covered
Leaving residue is one of the easiest and most cost-effective ways to reduce erosion. University of Nebraska-Lincoln Extension says research in Nebraska and nearby states shows that crop residue on as little as 20% of the surface can cut erosion by about half compared with a bare field. More residue cuts it further. You can measure cover with a marked rope and a line-transect count. For steeper land, add structures such as contour planting, strips and grassed waterways. Our guide to ways to prevent soil erosion compares ten methods.
2. Reduce tillage
Less tillage leaves residue in place and uses less fuel. A global study in Nature (Pittelkow and others, 2015), using 5,463 paired yield observations, found that no-till alone reduces yields on average, though results vary. Adding residue retention and rotation reduces that penalty, and the full package raised rainfed yields in dry climates. So do not judge no-till as a single swap.
On US farms, the USDA Economic Research Service report ERR-353 found conservation tillage linked to higher corn yields but not higher soybean yields, and to lower operating costs for both. These are associations in survey data, not proof of cause. Adoption differs widely by crop.
3. Plant cover crops and green manures
Cover crops hold soil between cash crops, feed soil life and can catch leftover nutrients. Legumes also fix nitrogen. They are still a small share of the land: Choices magazine (2024) puts them at 4.7% of US cropland in 2022, using Census of Agriculture data.
Money is a key reason. USDA ERS reports that the short-term return was often negative without cost-share or other financial help. It also found that 46% of operations with cover crop acres in 2017 reported them again in 2022. Start with one field, and ask your local conservation office about programme payments before you buy seed. SARE’s cover crop economics guide sets out the management scenarios in corn and soybean rotations.
4. Rotate crops, with more than two where you can
Rotation breaks pest and disease cycles, varies rooting depth and spreads nutrient demand. USDA ERS describes a conservation rotation as one chosen to increase crop diversity, build organic matter and improve soil biodiversity. Its survey data show this type of rotation on 34.3% of oat acres and 9.7% of cotton acres in the years surveyed. Choose crops you can actually sell, then add a legume or a deep-rooted crop where the market allows. This step also supports pest and disease control, along with resistant varieties and careful use of chemicals. Follow the product label and local rules for any pesticide.
5. Test soil, then balance nutrients and pH
A nutrient budget starts with a test. It stops you from running soil down or paying for surplus that may leach or run off. Clemson University Extension‘s home and garden factsheet recommends sampling every year; ask your local extension service what interval suits field crops. Sample the same way and at the same time of year so results compare. Correct pH with lime or other amendments only as the test advises. Our soil testing guide explains sampling and reading results. Take rates from your local extension service or an agronomist, and follow fertilizer rules where you farm.
6. Add organic matter
Compost, manure, green manures and biochar can raise biological activity and improve structure. Water is one measurable benefit. University of Nebraska-Lincoln Water (2020) estimates that a 1% rise in organic matter adds about 3,400 gallons of available water per acre in the top foot of a silt loam.
A 1% rise takes a long time, so set expectations with care. Check what is in any amendment you buy, and give manure a place in your nutrient plan. Our soil organic carbon guide gives reported rates of gain by practice.
7. Limit compaction and manage water
Compaction squeezes out the pores that roots and water use. Penn State Extension links subsoil compaction to high axle loads, 10 tons and heavier, on wet soil, and treats that yield loss as effectively permanent. It also reports alfalfa yield losses of 1% to 34% from traffic in a multistate project, an effect that combines compaction and stand damage. Stay off wet fields, cut axle loads, lower tire pressure where equipment allows, and keep traffic to the same lanes. Good structure then helps water soak in. Mulch and residue slow evaporation, and drainage deals with waterlogging on heavy ground.
Chart
No-till share of acres, selected crops
percent of acres, USDA ARMS survey: corn 2021, soybeans 2023, cotton 2019, sorghum 2019, winter wheat 2022
Does sustainable soil management pay?
It can, but not always, and often not at once. The positive numbers here come from the Soil Health Institute. It interviewed 100 farmers in 9 US states who had already adopted soil health systems, and compared them with conventional management using partial budgets. The work is supported by Cargill. Net farm income rose by an average of US$52 per acre for corn and US$45 for soybeans, and 85% of corn and 88% of soybean growers saw net income rise. Those farmers had chosen and stuck with these systems, so treat the figures as what experienced adopters report, not what a new adopter should expect.
Try the numbers for your own farm below.
Calculator
Does a soil practice pay on your acres?
Enter your own costs, savings, yield change and price for one practice.
- Net change per acre: $0
- Net change per acre without the payment: -$10
- Yield gain needed to break even, bu/acre: 3.0
Example values only, set near break-even; they are not benchmarks or forecasts. Every number is your input. Results cover one year and leave out long-term soil gains. Get professional advice before a large change.
USDA ERS gives the more cautious view. Lower tillage can cut input costs, but net profit varies, and outcomes change with the years a practice has been in use. It also says profit depends on the whole system, so one practice may look poor alone and better alongside others. Iowa State’s Center for Agricultural and Rural Development likewise named return on investment as a stumbling block for cover crops in a 2018 study. Use the calculator to set your own numbers against both views, and get professional advice before a large change.
Chart
Share of US cropland in no-till and cover crops
percent of total cropland, 48 contiguous states, Census of Agriculture years
How to measure soil health over time
Pick a few measures, use the same method each time, and compare the same spots. Soil changes slowly, so a single year tells you little.
| Measure | What it tells you | How often |
|---|---|---|
| pH, P, K | Nutrient balance, liming need | Per your lab or extension advice |
| Organic matter or SOC | Long-term carbon and fertility | Every few years |
| Bulk density | Compaction | When you suspect a problem |
| Infiltration rate | How well water enters | Every few years, same season |
| Aggregate stability | Structure under rain | Every few years |
| Earthworms, microbial biomass | Biological activity | Same month each time |
| Residue cover, bare ground | Erosion risk | After planting |
| Yield, input costs | Whether it pays | Every harvest |
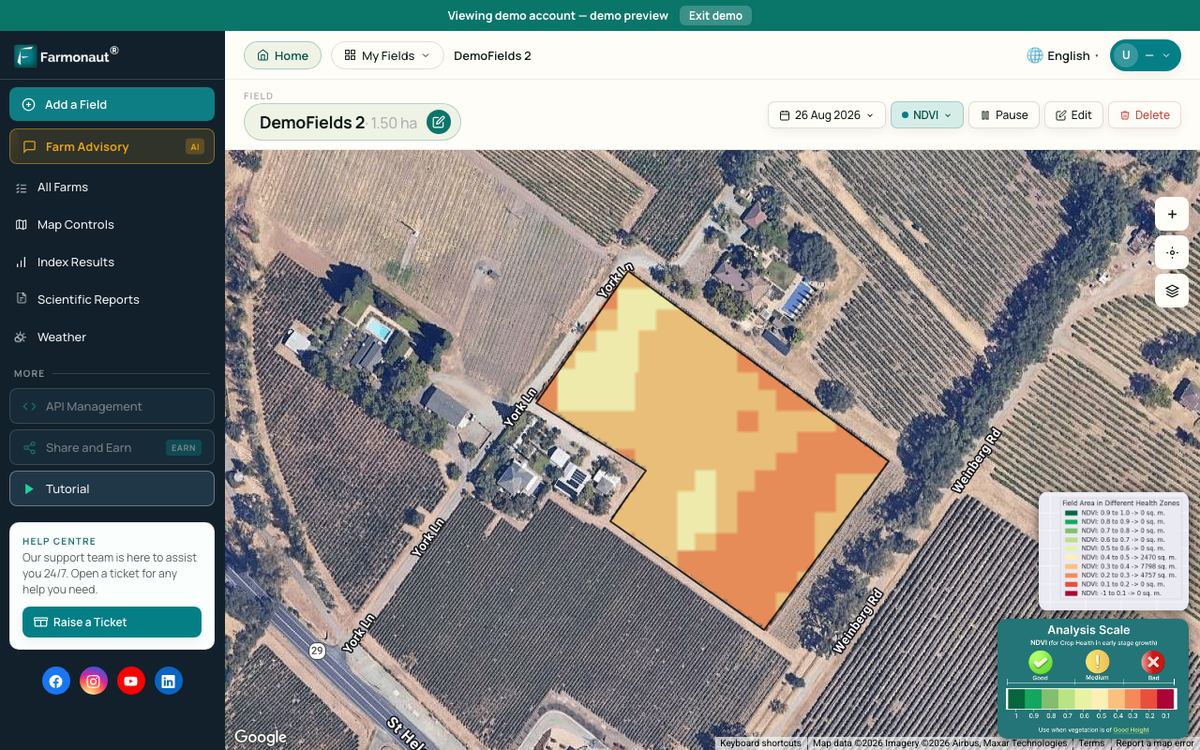
Labs such as the Cornell Soil Health Laboratory offer packages that combine physical, biological and chemical tests. Satellite maps add a different view. Vegetation maps from a service such as Farmonaut show which parts of a field grow differently through the season. They do not name the cause, so use them to decide where to dig or sample.
Chart
Extra available water per 1% more organic matter
gallons per acre, top 12 inches, by soil texture
Forestry, nurseries and reclaimed land
The same principles apply beyond row crops, with different priorities. In forestry and nurseries, the main goals are to keep ground cover, limit machinery compaction and support sapling establishment. Agroforestry adds trees that can store carbon and shelter fields. On land reclaimed after mining or other disturbance, the first aims are to stop erosion and rebuild a rooting layer with organic amendments and plant cover. Reclamation is usually bound by permit conditions, so work with your regulator and a specialist.
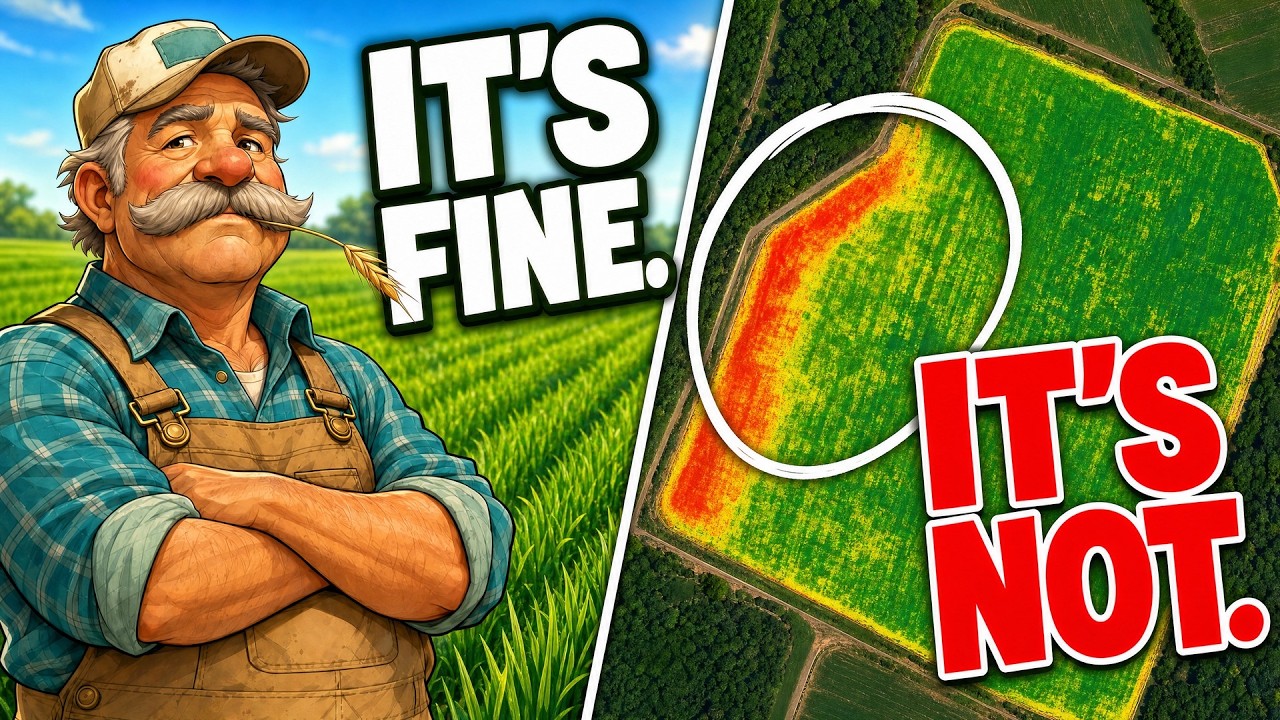
▶ A light look at how satellite crop monitoring can show a weak corner of a field. · 4:32
How to start: a one-season plan
- Walk and test. Sample each field and note bare ground, gullies and wet or hard spots.
- Fix the biggest loss first. Use residue, cover or waterways where soil is moving.
- Change one thing on one field. Keep a comparison strip with your usual management.
- Record costs and yield. Include seed, passes, labour and any programme payment.
- Re-test and decide. Give it several seasons, because ERS notes results change with time in use.
Related pages on our site: carbon footprint tracking, product traceability, satellite data API, large-farm management, fleet management, farm monitoring app, this guide.

▶ Regenerative practices such as no-till and cover crops, and the tools used alongside them. · 10:25
FAQ
What is sustainable soil management?
It is managing soil so its services, such as growing crops, storing water and regulating carbon, are kept or improved without seriously harming soil functions or biodiversity. That is the FAO definition, taken from the revised World Soil Charter.
What are the main sustainable soil management practices?
Keeping soil covered, reducing tillage, cover crops, crop rotation, testing and balancing nutrients, adding organic matter, and limiting compaction. Measuring results over time ties them together.
Which practice should I start with?
Start with a soil test and a walk over the field. If soil is moving, fix cover and erosion first. If it is not, nutrient balance and rotation are often easier first changes than buying new equipment.
Can these practices reduce costs?
They can. USDA ERS links conservation tillage to lower operating costs for corn and soybeans, and the Soil Health Institute reports average cost cuts of US$24 per acre for corn and US$17 for soybeans among 100 adopters. Cover crops often lose money in the short term without financial help.
How long does it take to see results?
Erosion and residue cover can change in one season. Organic matter and structure take years. Measure the same spots on the same schedule, and keep going long enough to judge. Stopping can undo stored carbon gains.
Can satellites measure soil health?
Not directly in most cases. Satellite vegetation maps show crop vigour and how it changes across a field. They help you choose where to sample, but lab tests and field checks are still needed to find the cause.
Farmonaut crop monitoring
See your own fields from space
Draw your fields once and Farmonaut shows satellite vegetation maps for them through the season, on web, Android or iOS.



Keep reading

Sources
- FAO, Voluntary Guidelines for Sustainable Soil Management (2017): fao.org
- USDA NRCS, 2022 National Resources Inventory Summary Report (2025): nrcs-prod.azureedge.us
- Eurostat, Agri-environmental indicator: soil erosion (data extracted June 2026): ec.europa.eu
- European Commission, Soil Monitoring Law: environment.ec.europa.eu
- University of Nebraska-Lincoln Extension, G1931 Estimating Percent Residue Cover (2009): extensionpubs.unl.edu
- Pittelkow and others, Nature (2015): nature.com
- USDA Economic Research Service, ERR-353 Economic Outcomes of Soil Health and Conservation Practices (2025): ers.usda.gov
- Choices magazine (AAEA), Pervasive disadoption (2024): choicesmagazine.org
- SARE, Cover Crop Economics: sare.org
- Clemson University Extension, Soil Testing: hgic.clemson.edu
- University of Nebraska-Lincoln Water, soil organic matter and soil water (2020): water.unl.edu
- Penn State Extension, Effects of Soil Compaction: extension.psu.edu
- Soil Health Institute, Economics of Soil Health Systems: soilhealthinstitute.org
- Iowa State University CARD, cover crop return on investment (2018): card.iastate.edu
- Cornell Soil Health Laboratory, analysis packages: soilhealthlab.cals.cornell.edu
Discussion
Questions, corrections or field experience? Share them below. First-time comments are reviewed before they appear, and your email is never published.
No comments yet. Be the first to add a question or your experience.

 Agroes
 Etech Consulting Madagascar
 Vestlandsforsking
 Elders
 Agritein
 Delicio
 WB Dev
 Sama Premium
 Prochecker
 Tres Valles
 LACOS Geoinformation
 Magrifly
 LatConnect 60
 WebsEdge
 Blickwinkel
 Agricultural Credit Policy Council
 Marei Nursery
 eKGIS
 Mostas Tech
 Andex

 Exploration consultancy · South Africa · Gold
 Licence holder · Niger · Gold
 Licence holder · Nigeria · Gold + lithium
 Client · Tanzania · Gold










