

Cotton · US growing guide
Cotton Agriculture: Growth Factors, Sensors and Costs
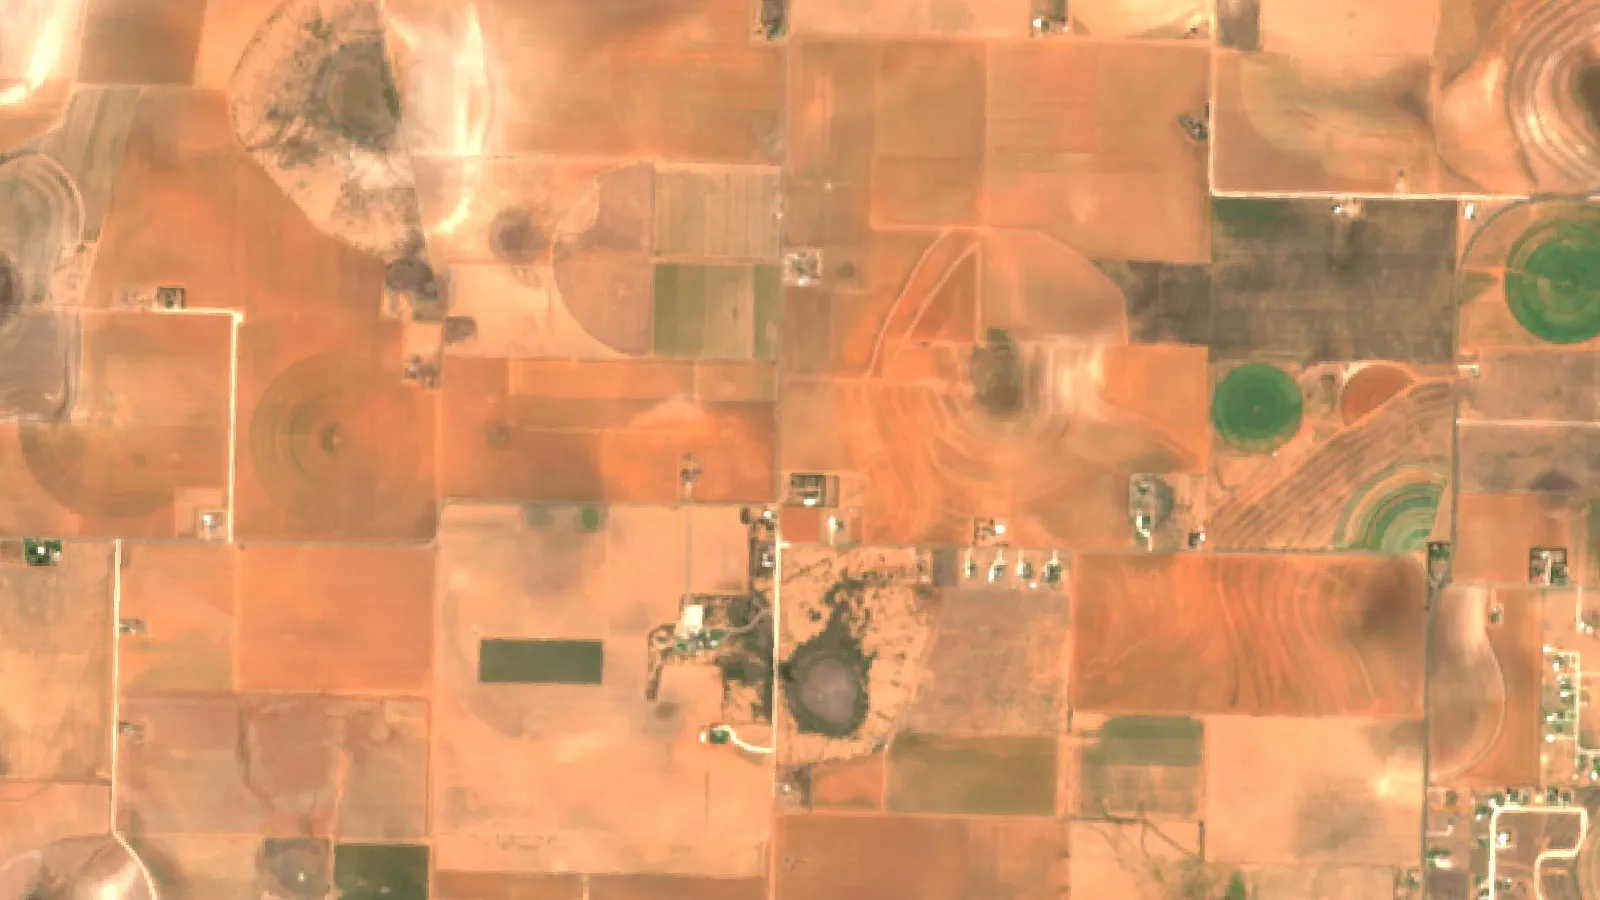
USDA forecasts 13.4 million bales of US cotton in 2026 at 790 pounds of lint per harvested acre. Yield turns on soil temperature, heat units, water, nutrients and pests, and each can be measured with field sensors or satellite maps.
Key takeaways
- USDA NASS forecast US cotton at 13.4 million 480-lb bales and 790 lb of lint per harvested acre (October 2026), from 9.85 million planted acres (June 2026).
- LSU AgCenter advises planting when soil at 4 inches is 65°F or warmer at 8 a.m. for three days, with at least 26 DD60s forecast for the next five days.
- In a USDA-ARS study at Bushland, Texas, sensor-guided irrigation at 75% of the soil water deficit kept yields level while saving at least 16-20% of irrigation water.
- University of Arizona lists single-depth soil moisture sensors at $100-$700 and multi-depth probes at $600-$1,750 (list price ranges).
- Texas A&M’s 2026 South Plains dryland budget breaks even at $0.54/lb on variable costs and $0.80/lb on total costs at 400 lb/acre.
In this article
- Cotton agriculture at a glance
- Where cotton is grown in the US
- Growth factor 1: soil temperature at planting
- Growth factor 2: heat units (DD60s)
- Growth factor 3: water and irrigation
- Growth factor 4: nutrients and soil health
- Growth factor 5: pests, weeds and crop protection
- Sensors, IoT and satellites: what each measures
- What sensors cost
- Cotton costs and break-even prices
- Calculator: does a soil moisture sensor network pay for itself?
- How to use sensors on a cotton farm: 6 steps
- Satellite monitoring for cotton fields
- Common mistakes in cotton agriculture and how data helps
Cotton agriculture in the United States is forecast to produce 13.4 million 480-pound bales in 2026, with an average yield of 790 pounds of lint per harvested acre, according to the USDA NASS Crop Production report of October 2026. The crop is grown mainly in the 17 southern “Cotton Belt” states, and its yield depends on a few things you can measure: soil temperature at planting, heat units through the season, water in the root zone, nutrients and pests.
This guide explains each growth factor in plain terms, shows which field sensors and satellite tools measure it, and gives dated cost and break-even numbers from US extension budgets. It also includes state yield charts and a calculator that tests whether a soil moisture sensor network pays for itself on your acres.
Cotton agriculture at a glance
Cotton is a warm-season crop grown for its fiber (lint) and its seed. The seed is crushed for oil and meal or fed to cattle. In the US, cotton is planted from March to June and harvested from August to December, says the USDA Economic Research Service (ERS) cotton overview. ERS adds that one bale, about 480 pounds of clean lint, can make more than 200 pairs of jeans or 1,200 T-shirts.
Two species are grown commercially. Upland cotton makes up the vast majority of the crop. American Pima, an extra-long staple cotton, is grown mainly in California, Arizona, New Mexico and west Texas. The table sums up the key US numbers for the current season.
| Measure | Value | Source and date |
|---|---|---|
| Planted area | 9.85 million acres, up 6% on 2025 | USDA NASS Acreage, June 2026 |
| Harvested area | 8.16 million acres (forecast) | USDA NASS, October 2026 |
| Average yield | 790 lb lint per harvested acre | USDA NASS, October 2026 |
| Production | 13.4 million bales, down 3% | USDA NASS, October 2026 |
| Pima production | 383,000 bales | USDA NASS, October 2026 |
| Largest state | Texas, 4.35 million upland bales | USDA NASS, October 2026 |
The USDA NASS Acreage report of June 2026 put all cotton planted area at 9.85 million acres. Harvested area is lower because some fields, mostly dryland fields in Texas and Oklahoma, are abandoned after drought or hail. That gap is one reason growers watch water so closely.
Where cotton is grown in the US
Texas is the largest producer. ERS says the state has supplied about 40% of US cotton in recent years, mostly from the High Plains around Lubbock. Georgia, Arkansas, Mississippi, Missouri and North Carolina follow. The October 2026 forecast shows how much yield per acre varies between states. Irrigated fields in the Mid-South and the desert West produce far more lint per acre than dryland fields on the plains.
Chart
Upland cotton yield forecast by state
Pounds of lint per harvested acre, forecast as of October 1, 2026, selected main states
The chart shows the October 1 yield forecast for upland cotton in the main states. Arizona, Missouri and Arkansas lead, while Texas and Oklahoma sit far below the national average after a dry season on the plains. A low state average does not mean a field cannot do well. It reflects the share of dryland acres, rainfall that year and abandoned fields.
Production also shifts year to year. Texas is forecast to fall from 5.23 million upland bales in 2025 to 4.35 million in 2026, while Georgia, Arkansas and Alabama are forecast to grow, partly because they planted more acres. For more on how weather shapes those swings, see our guide to cotton climate, agronomy and water requirements.
Chart
Upland cotton production: 2025 vs 2026
Thousand 480-lb bales, Texas and five other large producing states
Growth factor 1: soil temperature at planting
Cotton is a tropical plant, and cold soil is its first risk. The LSU AgCenter guide on when to plant cotton explains that soil temperatures below 50°F can cause chilling injury to germinating seed. The seed is most at risk in the first hours after it starts taking up water. Chilling injury can lead to malformed seedlings, loss of the taproot, weak stands and more seedling disease.
LSU gives a clear rule. Plant when the soil at 4 inches is 65°F or warmer at 8 a.m. for at least three days in a row, with a good five-day forecast. Other states use slightly different depths and thresholds, so check your own extension service. The rule matters because a delay costs less than a poor stand. LSU notes that a four-week delay until good conditions may mean only a one- to two-week difference in flowering.
What to measure: soil temperature at seed depth. A soil probe with a temperature sensor at 2 to 4 inches, or the nearest public weather network station, gives this reading. Many soil moisture probes sold to cotton growers also record soil temperature at each depth.
Growth factor 2: heat units (DD60s)
Cotton development follows heat, not the calendar. Growers track it in degree days above 60°F, called DD60s. The formula LSU uses is simple: add the day’s high and low temperatures in °F, divide by two, and subtract 60. A negative result counts as zero.
- Emergence generally comes after 50 to 80 DD60s, depending on seed vigor (LSU AgCenter).
- LSU advises delaying planting if the five-day forecast gives less than 26 DD60s, or if the low temperature will drop below 50°F.
- When fewer than 10 DD60s build up in the five days after planting, yield potential may be reduced.
- Limited field research cited by LSU suggests yield potential drops by about 0.7% for every day emergence is delayed beyond the first 10 days.
Heat units also matter at the other end of the season. The USDA-ARS cotton irrigation study in Frontiers in Plant Science (2023) lists limited heat units in spring and autumn as one of the three main risks for cotton on the Texas High Plains. Late bolls may not mature before the first cold weather. An on-farm weather station or a reliable weather service lets you count DD60s for each field and plan defoliation and harvest. Our article on when cotton is harvested and the yield factors behind it covers that end of the season.

▶ The five main stages of crop farming and the tools that support each one. · 12:13
Growth factor 3: water and irrigation
Water is the factor that most often separates a high-yield cotton field from a poor one. The Frontiers study notes that cotton needs less water than corn and can be grown below full evapotranspiration. That makes it a common choice where well capacity is limited, such as over the Ogallala Aquifer. But both drought and heavy late rain hurt the crop. Late rain can push leaf growth and slow boll opening, while early hail and storms can destroy young plants.
Sensor-based scheduling helps growers apply water only when the crop needs it. In the two-year study at Bushland, Texas, plots irrigated at 75% of the soil water deficit kept seed cotton yield at the level of fully irrigated plots. They saved at least 20% of irrigation water in 2021 and at least 16% in 2022. The automated system used canopy temperature (a crop water stress index) and soil water readings, and performed as well as weekly manual neutron probe readings.
These were research plots under a center pivot, so savings on a commercial farm will differ. They do show what measured, not guessed, irrigation can do.
How soil moisture sensors work
The University of California ANR guide to soil moisture sensors describes two main kinds. Volumetric sensors measure how much water is in the soil. Tension sensors measure how hard the roots must pull to take water out. Either can tell you when the root zone is drying toward the point where the crop starts to suffer.
The University of Arizona sensor selection guide lists capacitance, time domain transmissivity (TDT) and frequency domain reflectometry (FDR) as the main technologies on the market. Many probes also record soil temperature and salinity. Placement matters more than brand. Put sensors in the effective root zone, in soil that represents the field, and away from wheel tracks and field edges.
Chart
Irrigation water saved with sensor-guided scheduling
Minimum saving at 75% of soil water deficit vs full irrigation, with seed cotton yield maintained, Bushland, Texas
Growth factor 4: nutrients and soil health
Cotton takes up nitrogen, phosphorus and potassium through the season, with peak demand from first square to peak bloom. Too little nitrogen limits boll numbers. Too much drives rank leaf growth, delays maturity and makes defoliation harder. In the Frontiers study, fertilizer rates were set from soil tests taken in March to meet a yield goal. That is the standard starting point.
Soil sensors measure moisture and temperature well, but they do not replace a lab soil test for nutrients. Tissue tests at early bloom and satellite crop maps can show where plants fall behind, which helps you decide where to sample. Our page on ways to build soil fertility covers organic matter and nutrient balance, and the guide to regenerative agriculture covers cover crops and reduced tillage in more depth.
Fertilizer rates depend on your soil test, yield goal and state rules. Check the product label and local regulations, and get advice from your extension service or a certified crop adviser before you apply.
Growth factor 5: pests, weeds and crop protection
Insect and weed pressure shapes cotton yield and cost. In the Bushland study, thrips and weeds such as pigweed had to be controlled to protect young plants. Biotech seed has changed the picture in the US. The ERS report on genetically engineered crop adoption says 93% of upland cotton acres were herbicide tolerant in 2025, and 91% of US cotton acres are planted with insect-resistant (Bt) seed.
Biotech traits do not end scouting. Weeds resistant to some herbicides, and insects not controlled by Bt, still need field checks. Traps, scouting apps and satellite maps help you choose which fields to walk first. Any pesticide must be used as the label directs. Check the label, your state rules and your extension service before spraying.
Sensors, IoT and satellites: what each measures
IoT (Internet of Things) means field devices that send readings over a network, so you can see them on a phone or computer. For cotton, the most useful devices measure the growth factors above. The table compares the main options.
| Tool | What it measures | Best for | Limits |
|---|---|---|---|
| Soil moisture probe | Water (and often temperature, salinity) at one or more depths | Irrigation timing on irrigated fields | Reads one spot; needs good placement |
| Weather station | Air temperature, rain, humidity, wind | DD60s, planting and spray decisions | One station may not cover far fields |
| Canopy temperature sensor | Leaf temperature as a water stress signal | Automated deficit irrigation | Mostly in research and advanced pivots |
| Insect trap with camera | Moth counts | Timing scouting | Does not replace field checks |
| Satellite crop maps | Crop vigor (NDVI) and change over every field | Finding weak zones, comparing fields | Cloud gaps; shows where, not why |
Satellites and in-field sensors work best together. A probe tells you exactly how wet one spot is. A satellite vegetation map shows whether the whole field looks the same, so you can see whether that spot is typical. You can compare examples in the satellite imagery samples and read how satellite image comparison works across a season.
For a wider view of farm devices beyond cotton, see our overview of IoT systems for smart farming.
▶ How satellite and AI monitoring help cotton farmers follow their crop through the season. · 9:57
What sensors cost
The University of Arizona guide gives market prices for soil moisture sensors. Single-depth sensors usually cost $100 to $700, and multi-depth probes cost $600 to $1,750. Wireless gateway equipment usually costs $399 to $2,250, and repeaters about $150 to $200. Data plans usually run $150 to $350 a year, though some are priced per sensor. These are list price ranges from the guide, not quotes, so ask dealers for current prices.
| Item | Typical price range (US$) | Basis |
|---|---|---|
| Single-depth sensor | $100 to $700 each | Market list prices, Univ. of Arizona guide |
| Multi-depth probe | $600 to $1,750 each | Market list prices, Univ. of Arizona guide |
| Gateway | $399 to $2,250 | Market list prices, Univ. of Arizona guide |
| Repeater | About $150 to $200 | Market list prices, Univ. of Arizona guide |
| Data plan | $150 to $350 per year | Market list prices, Univ. of Arizona guide |
Cotton costs and break-even prices
Any sensor or monitoring cost has to fit inside a tight cotton budget. Texas A&M AgriLife Extension’s 2026 cotton costs and returns review uses dryland cotton in District 2 (the South Plains) as an example. With a budgeted yield of 400 pounds of lint per acre, it breaks even on variable costs at $0.54 per pound and on total costs at $0.80 per pound.
The same review says returns over variable costs are positive in all but one of its 2026 budgets, but breaking even on total costs will be harder. It also tested a case with fuel 50% higher and fertilizer 25% higher than expected. In all but one budget, break-even prices rose by $0.03 per pound. These are extension budget estimates for Texas districts, not results from any one farm. Build your own budget with your yields and costs.
The practical lesson: a tool that saves 16% to 20% of irrigation water, or catches a problem a week earlier, is worth having only if that saving is larger than its yearly cost. The calculator below tests that for your own numbers.
Calculator: does a soil moisture sensor network pay for itself?
Enter your irrigated acres, the sensor sites you need, equipment prices and your irrigation cost. The calculator spreads the equipment cost over its working life, adds the yearly data plan, and compares the total with the money saved by applying less water. The default values are examples set near break-even, not benchmarks. Replace them with your own figures.
Try the numbers for your own farm below.
Calculator
Does a soil moisture sensor network pay for itself?
Enter your own acres, equipment prices and irrigation cost.
- Yearly cost of sensors: 1,025 US$
- Yearly irrigation saving: 1,020 US$
- Water saving needed to break even: 17.1 %
Example values only, set near break-even; they are not benchmarks or forecasts. Price inputs are examples, use today’s dealer price. Water saving is your own estimate: a USDA-ARS research study saved 16-20% at Bushland, Texas, but results on your farm will differ. The calculator ignores labor, yield changes and interest.
How to use sensors on a cotton farm: 6 steps
- Map your fields. Draw field boundaries and look at past satellite crop maps to find zones that always grow better or worse.
- Pick sensor sites. Put at least one probe in each major soil zone of an irrigated field, in the root zone and away from edges.
- Set thresholds. Work with your extension service to set the soil water level that triggers irrigation for your soil type and crop stage.
- Track DD60s. Use a station or weather service to count heat units for planting, growth stages and defoliation.
- Scout where the data points. Walk the weak zones first, check for pests and take tissue samples where needed.
- Review after harvest. Compare yield maps, water use and sensor records, and move probes if a site was not typical.
Good records also make it easier to plan the next season. Our guides to farm management strategies and crop management for sustainable agriculture cover how to turn those records into decisions.
Satellite monitoring for cotton fields
Satellite maps cover every acre, not just the spots where a probe sits. Vegetation indices such as NDVI rise as the canopy closes and fall when plants are stressed by water, nutrient shortage or pests. Comparing maps a week apart shows which part of a field is falling behind. The Farmonaut Satellite + AI Farm Monitoring System sends these maps for fields you draw once, on web, Android or iOS. Read how the platform processed 10 million farm images in 14 days.
Satellites do not say why a zone is weak. They show where to look. Pair them with soil probes on irrigated fields and with scouting on all fields.
▶ How NDVI satellite maps show crop stress before you can see it in the field. · 4:09
Common mistakes in cotton agriculture and how data helps
Many yield losses come from a few repeat mistakes. Each one can be spotted earlier with simple measurements.
- Planting into cold soil. A warm afternoon can hide a cold morning. Check soil temperature at 8 a.m. and the five-day DD60 forecast before the planter rolls.
- Irrigating by the calendar. Watering every set number of days ignores rain and crop stage. Probe readings show when the root zone actually needs water.
- Late-season water that delays maturity. Extra water near cutout can push new leaves instead of opening bolls. Track heat units left in the season before the last irrigation.
- One soil test for a whole farm. Fields vary. Use crop maps from past seasons to split fields into zones and sample each zone.
- Scouting only the field edge. Pests and stress often start inside the field. Satellite maps show interior patches worth a walk.
- Buying sensors with no plan. A probe in the wrong spot gives confident but wrong readings. Decide what decision each sensor supports before you buy.
None of these fixes needs costly equipment on day one. A soil thermometer, a weather service with daily highs and lows, one probe per irrigated soil zone and regular satellite maps cover most of them. Add more sensors only where the first season of data shows they would change a decision.
FAQ
What is cotton agriculture?
Cotton agriculture is the growing of cotton plants for lint (fiber) and seed. In the US it covers about 9.85 million planted acres in 2026 (USDA NASS), mainly in 17 southern states from Virginia to California.
Which US state grows the most cotton?
Texas. USDA NASS forecast 4.35 million upland bales for Texas in October 2026, about a third of US upland production. ERS says Texas has supplied about 40% of US cotton in recent years.
What soil temperature does cotton need to germinate?
LSU AgCenter advises planting when soil at 4 inches is at least 65°F at 8 a.m. for three days in a row, with at least 26 DD60s forecast over the next five days. Other states use similar rules with different depths.
How much water can soil moisture sensors save in cotton?
In a USDA-ARS study at Bushland, Texas, sensor-guided deficit irrigation at 75% of the soil water deficit kept yields level with full irrigation and saved at least 16% to 20% of irrigation water. Savings on your farm depend on soil, rain and how you irrigated before.
How much do cotton soil moisture sensors cost?
The University of Arizona guide lists single-depth sensors at $100 to $700, multi-depth probes at $600 to $1,750, gateways at $399 to $2,250 and data plans at $150 to $350 a year. These are list price ranges, so get current dealer quotes.
Can satellites replace field sensors for cotton?
No. Satellite maps show crop vigor across every field and point to weak zones. Soil probes measure water at exact depths. Most growers get the best value by using both, plus regular scouting.
Related pages on our site: satellite crop monitoring and crop monitoring overview.
Farmonaut crop monitoring
See your cotton fields from space
Draw your fields once and Farmonaut shows satellite vegetation maps for them through the season, on web, Android or iOS.




Sources
- USDA NASS, Crop Production (October 2026): release.nass.usda.gov
- USDA NASS, Acreage (June 2026): release.nass.usda.gov
- USDA ERS, Cotton Sector at a Glance: ers.usda.gov
- USDA ERS, Recent Trends in GE Adoption: ers.usda.gov
- USDA ERS, Cotton and Wool topic page: ers.usda.gov
- LSU AgCenter, When to Plant Cotton: lsuagcenter.com
- O’Shaughnessy et al., Sensor feedback system enables automated deficit irrigation scheduling for cotton, Frontiers in Plant Science (2023): frontiersin.org
- University of California ANR, Soil Moisture Sensors: ucanr.edu
- University of Arizona Cooperative Extension, Guidance for Soil Moisture Sensor Selection: extension.arizona.edu
- Texas A&M AgriLife Extension, Cotton Costs and Returns in 2026: agrilife.org
- NC State Extension, 2026 Cotton Information: content.ces.ncsu.edu
- Mississippi State University Extension, Cotton: extension.msstate.edu
Discussion
Questions, corrections or field experience? Share them below. First-time comments are reviewed before they appear, and your email is never published.
No comments yet. Be the first to add a question or your experience.

 Croptimum
 Dalmia Bharat Sugar
 DnCubed
 Pistachio ST
 Field Capacity
 Indosistim Teknologi
 Liquify Digital
 CU Foods
 BeyondTech Global
 Rouge VC
 AgroGreen Dynamics
 AgroRisk
 Oath Inc
 Reddane Farming
 Esri North East Africa
 Cresol
 MDCV UK
 Etech Consulting Madagascar
 Vestlandsforsking

 Licence holder · Niger · Gold
 Client · Tanzania · Gold
 Client · Somalia · Gold










