

Agricultural Stocks Canada: What to Track & Where
Reviewed August 2026 against Statistics Canada’s farm cash receipts release, Agriculture and Agri-Food Canada’s sector overview, and Farm Credit Canada’s farmland values reports.
Try it: Run your own numbers →
Table of Contents
- Introduction: Two Meanings of “Agricultural Solutions Canada”
- Agricultural Stocks Canada: What Actually Trades
- How Big Is Canadian Agriculture, Really
- Farm Cash Receipts vs. Farm Income: The Squeeze
- Farmland Values: The Sector’s Real Barometer
- Farmland Growth Calculator
- Agricultural Solutions Canada: BASF’s Growing Home Program
- Digital Agricultural Solutions: Farmonaut’s Toolkit
- Frequently Asked Questions
- Conclusion
- Try it: Run your own numbers
Introduction: Two Meanings of “Agricultural Solutions Canada”
“Agricultural stocks Canada” usually means one of two things: shares of publicly traded companies whose core business is farming inputs, processing or distribution — Nutrien, Rogers Sugar, SunOpta and a short list of others — or, more loosely, the health of the broader Canadian agriculture and agri-food system those companies sell into. Both readings deserve real numbers rather than a listicle. Statistics Canada put 2025 farm cash receipts at $101.4 billion, up 3.4%, in a release published February 26, 2026. Agriculture and Agri-Food Canada (AAFC) sized the whole agri-food system at $149.2 billion of GDP in 2024. Farm Credit Canada (FCC) tracked national farmland values up 9.3% in 2025.
This page works through what actually trades on an exchange, what the sector-wide data says, and — because “agricultural solutions Canada” is the other phrase that lands people here — the community programs and digital tools operating alongside the sector, including BASF’s Growing Home awards and Farmonaut’s satellite farm-management stack.

Agricultural Stocks Canada: What Actually Trades
There is no single “Agriculture” sector on the TSX. Under the Global Industry Classification Standard (GICS) that the exchange uses, companies with agricultural exposure are scattered across Materials (fertilizers and agricultural chemicals), Consumer Staples (food products, packaged foods, distillers and vintners) and, for equipment makers, Industrials. That’s the first thing that trips up a search for “Canadian agriculture stocks” or “canadian agriculture companies” — the ticker you want isn’t filed where the name suggests.
A Method for Finding Current Names — Not Just This Year’s List
Because constituents and prices change continuously, use a repeatable check instead of a memorized list:
- Filter TMX Money’s sector/industry screen for GICS codes under Materials → Fertilizers & Agricultural Chemicals and Consumer Staples → Food Products / Packaged Foods.
- Cross-check the S&P/TSX Composite Index constituent list, which is rebalanced quarterly.
- Read the company’s own SEDAR+ filing for how it describes its primary business — names can be misleading (wineries and beverage makers sit in Consumer Staples too, alongside true agri-processors).
- Confirm the company is still listed. Several well-known Canadian agriculture names have gone private, and a stale search result is the most common dead end here.
Companies With Real Canadian Agricultural Exposure
| Company | Ticker & Exchange | GICS Classification | What It Actually Does | How to Verify Today |
|---|---|---|---|---|
| Nutrien Ltd. | NTR — TSX & NYSE | Materials — Fertilizers & Agricultural Chemicals | World’s largest potash producer; major nitrogen and phosphate fertilizer maker; retail agronomy network | Market cap CAD 44.68 billion as of Aug. 7, 2026, per stockanalysis.com — check TMX Money for the live figure |
| Rogers Sugar Inc. | RSI — TSX | Consumer Staples — Food Products | Sugar refining and maple syrup processing supplying Canadian food manufacturers | Check TMX Money for current price and dividend data |
| SunOpta Inc. | STKL — Nasdaq; SOY — TSX | Consumer Staples — Packaged Foods | Plant-based and fruit-based ingredient and beverage processor | Dual-listed — verify both exchange pages, prices can diverge slightly |
| Andrew Peller Limited | ADW.A — TSX | Consumer Staples — Distillers & Vintners | Wine and craft beverage producer sourcing from Canadian vineyards — agriculture-adjacent, not a primary producer | Check TMX Money for current data |
| AGT Food and Ingredients | Delisted | Formerly Consumer Staples | Pulse and lentil processor headquartered in Regina, Saskatchewan | Traded on the TSX 2007–2019; taken private in an approximately $432 million deal that closed in April 2019 — a common search dead end |
Nutrien’s own TSX-listed market capitalization illustrates why “best agriculture stocks Canada” resists a fixed answer: CAD $54.27 billion (Dec. 31, 2021) → $51.42 billion (Dec. 30, 2022) → $36.92 billion (Dec. 29, 2023) → $31.77 billion (Dec. 31, 2024) → $40.95 billion (Dec. 31, 2025) → $44.68 billion (Aug. 7, 2026), a one-year gain of 12.69% from the same source. A single company’s ranking swings by tens of billions depending only on which window you measure. “Best” depends on the criterion — dividend yield, pure-play agricultural exposure, or growth — so decide that first, then pull the current figures from TMX Money before acting on them.
How Big Is Canadian Agriculture, Really
Behind the tickers sits a much larger system. AAFC’s sector overview puts the entire agriculture and agri-food system — primary farming through food retail and foodservice — at $149.2 billion of Canada’s GDP in 2024, about 7% of the national total, employing 2.3 million people, or 1 in 9 Canadian jobs. Canada exported roughly $100.3 billion in agriculture, food, fish and seafood products in 2024, making it the world’s 9th-largest exporter in that category, with the United States taking 61.9% of those exports — the reason U.S. trade policy moves the sector as much as weather does.
Farm Cash Receipts vs. Farm Income: The Squeeze
Farm cash receipts and farm income are not the same number, and mixing them up flatters the sector. Statistics Canada’s release covering January–December 2025 (published Feb. 26, 2026) put total farm cash receipts at $101.4 billion, up $3.3 billion (+3.4%) from 2024’s $98.1 billion. Livestock receipts rose 13.2% to $45.3 billion — a $5.3 billion gain, with cattle (+$3.1 billion) and hogs (+$880.8 million) driving three-quarters of it. Crop receipts fell 1.7% to $51.3 billion, a $871.5 million drop tied to lower canola, lentil and dry pea sales. Program payments fell 18.4% to $4.8 billion, a $1.1 billion reduction. Alberta led provincial growth (+$1.4 billion) and Ontario followed (+$820.5 million); Saskatchewan was the only province to decline (-$471.2 million).
Realized net income — profit after expenses — is the harder number, and it wasn’t in the February release. Statistics Canada scheduled that figure for May 27, 2026; check Statistics Canada’s Daily for the current release rather than relying on this snapshot once that quarter has passed.
Farmland Values: The Sector’s Real Barometer
Farmland value growth is arguably a cleaner read on sector confidence than crop prices, because it reflects what buyers are willing to pay years out. FCC’s national average rose 12.8% in 2022, 11.5% in 2023, 9.3% in 2024 and 9.3% again in 2025 (report published March 23, 2026) — growth that is decelerating but has not reversed, extending a multi-decade uptrend. FCC’s production economics lead attributed 2025’s resilience to “long-term confidence in Canadian agriculture, lower borrowing costs, strong livestock prices and the limited supply of land available for sale,” despite trade uncertainty, elevated input costs and soft commodity pricing.
Farmland Growth Calculator
Provincial results varied widely in 2025: Manitoba led at +12.2%, followed by Alberta (+11.4%), Saskatchewan (+9.4%), New Brunswick (+9.1%) and Prince Edward Island (+8.5%). Quebec (+4.8%) and Ontario (+2.2%) grew more slowly, Nova Scotia edged up 1.6%, and British Columbia was the only province to decline, down 1.7%.
Use the figures above to see how your own land compares — enter what you paid or last had it assessed at, its current value, and the years between, and it’s compared against FCC’s latest published figure for your province.
Run your own numbers
Agricultural Solutions Canada: BASF’s Growing Home Program
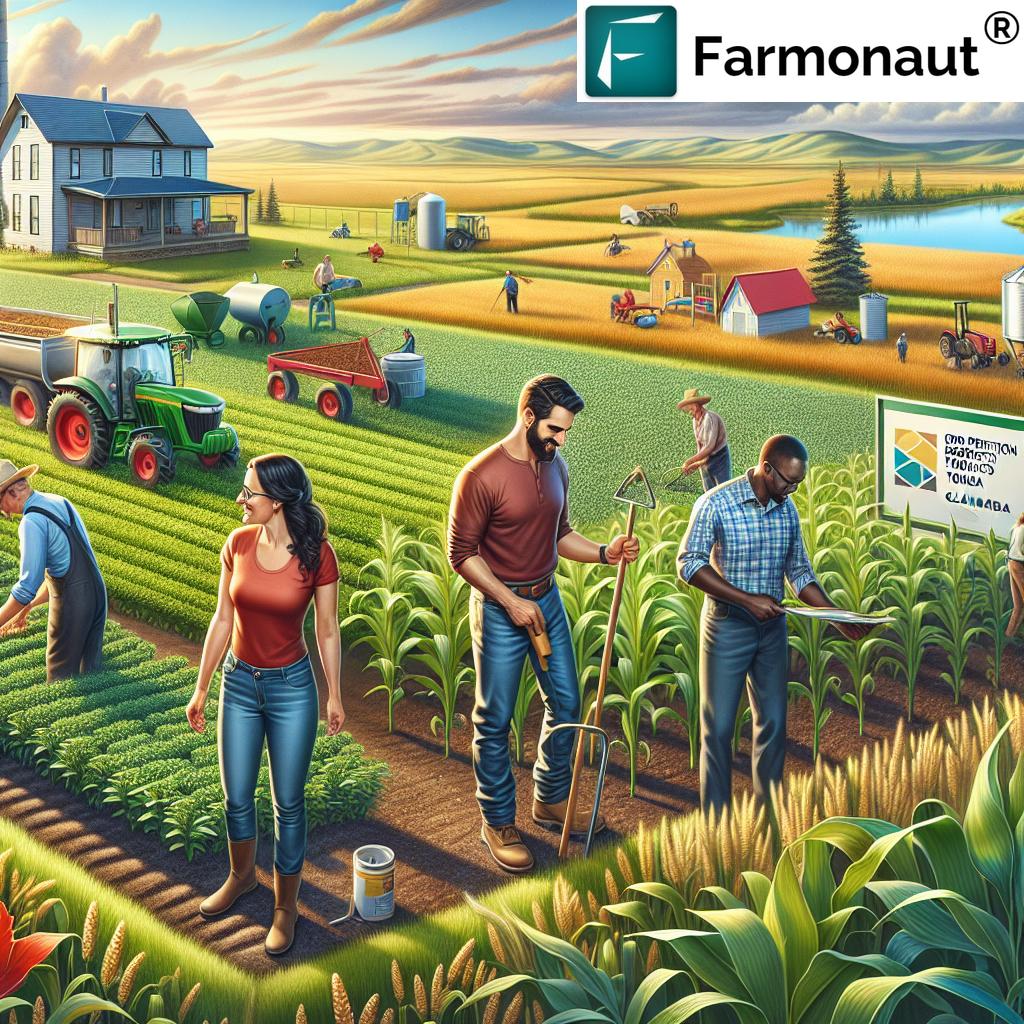
“Agricultural solutions Canada” is also a company name — BASF Agricultural Solutions Canada, headquartered in Calgary, Alberta, with over 625 employees and facilities in Lethbridge, Saskatoon and Regina. Its Growing Home with BASF program, launched in 2023, lets Canadian growers nominate community organizations in Alberta, Saskatchewan, Manitoba and Ontario for public-vote prizes: $25,000 for first place, $10,000 for second and $5,000 for third in each province. BASF expanded the total fund to $160,000 for its 2025 cohort of 12 winners, up from $100,000 in earlier years.
| Organization | Province | Prize (CAD) | What It Funds |
|---|---|---|---|
| Hussar Agricultural Society | Alberta | $25,000 | Arena upgrades for youth and community events |
| Buffalo Coulee Community Hall | Alberta | $10,000 | Community hall improvements |
| Eaglesham and District Agricultural Society | Alberta | $5,000 | Local agricultural society programming |
| PlayFair Daycare | Saskatchewan | $25,000 | Second daycare centre, ~90 new childcare spots |
| Little Seedlings Daycare | Saskatchewan | $10,000 | Childcare capacity expansion |
| Farm It Forward | Saskatchewan | $5,000 | Agricultural community outreach |
| Boissevain School Parent Advisory Council | Manitoba | $25,000 | Inclusive, accessible school playground |
| Louise Aquatic Centre | Manitoba | $10,000 | Aquatic facility upgrades |
| HERO’s Alliance | Manitoba | $5,000 | Community support programming |
| Palmerston and District Hospital Foundation | Ontario | $25,000 | MRI fundraising for rural healthcare access |
| Kiwanis Club of Petrolia and Area | Ontario | $10,000 | Community service initiatives |
| Gateway Centre of Excellence in Rural Health | Ontario | $5,000 | Rural health programming |
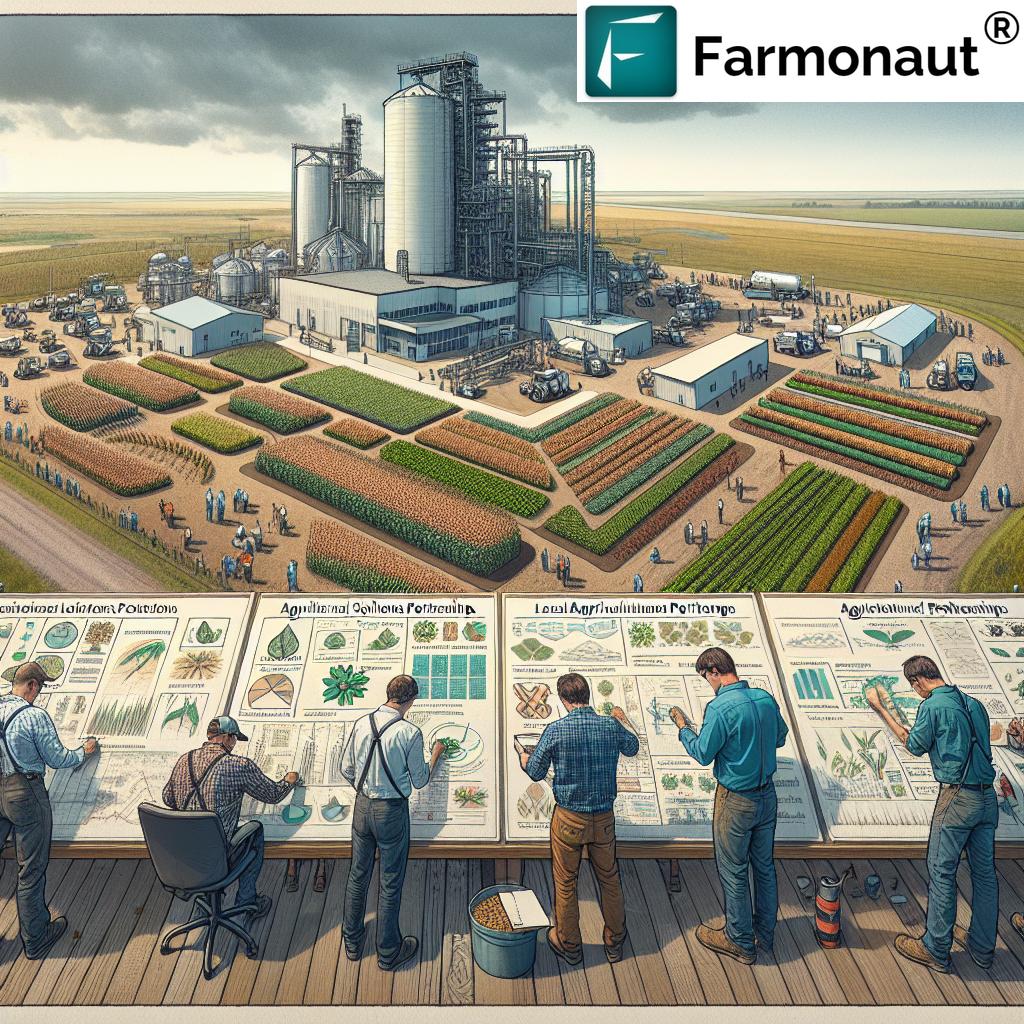

The Palmerston and District Hospital Foundation described the award as support for “bringing MRI technology to our rural community… helping local farmers and community members access the timely and reliable medical care they deserve.” The Boissevain School Parent Advisory Council called it a way to “bring this new playground to our community sooner than we ever imagined.” Nominations, eligibility rules and the current award year’s timeline are maintained directly by BASF — check BASF Growing Home Canada or the parent site, BASF Agricultural Solutions Canada, for the live cycle rather than this snapshot once it has closed.
Digital Agricultural Solutions: Farmonaut’s Toolkit
Alongside corporate and community programs, a separate layer of “agricultural solutions Canada” is digital: satellite monitoring, traceability and fleet software that individual growers and agribusinesses use directly. Farmonaut operates in this layer, available through Android, iOS, a web dashboard and an API.

What the Toolkit Covers
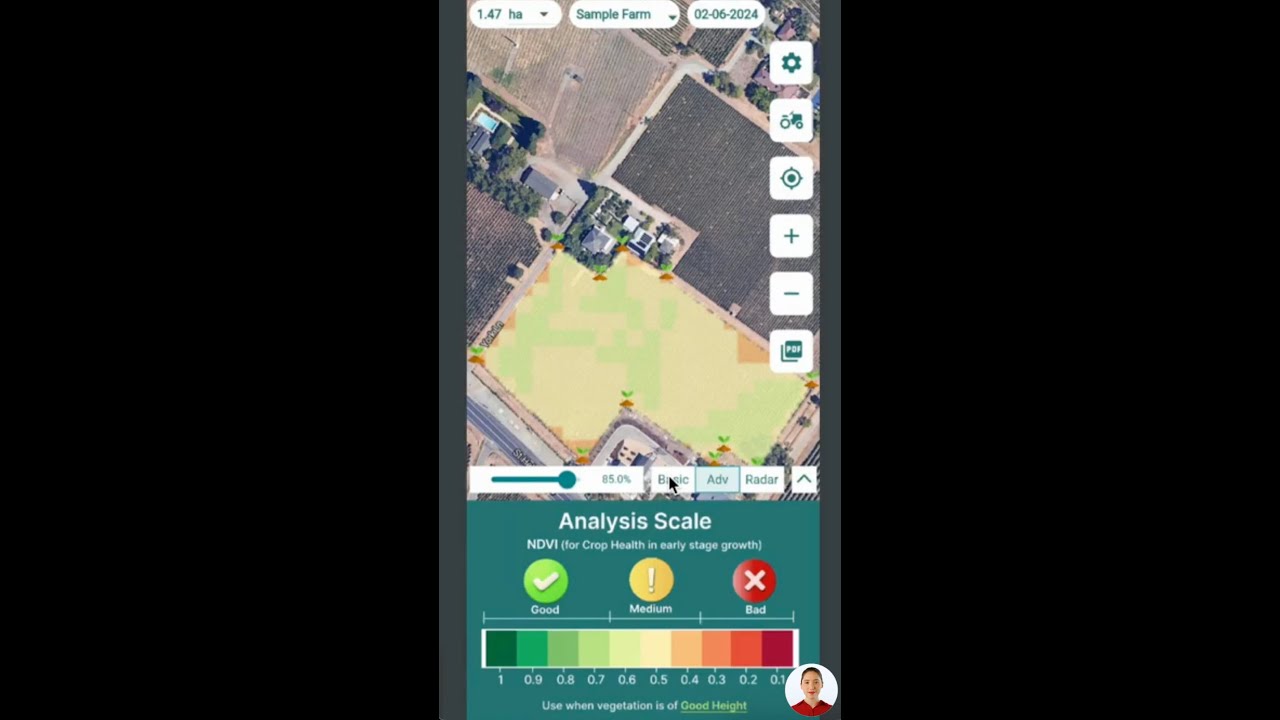
- Satellite crop health monitoring — multispectral imagery (NDVI, soil moisture) to guide irrigation, fertilizer and pest decisions.
- Jeevn AI advisory — weather-linked, farm-specific recommendations.
- Blockchain-based traceability — field-to-table verification; see Farmonaut’s traceability solutions.
- Fleet and resource management — logistics and machinery oversight via farm machinery management tools.
- Carbon footprinting — measuring and reducing farm environmental impact through carbon footprinting tools.
Financial institutions and agribusinesses assessing risk can draw on verified satellite data for crop loan and insurance decisions. Cooperatives, NGOs and government bodies covering multiple properties can use large-scale farm management tools for area mapping and resource tracking. Developers building custom platforms can integrate directly via Farmonaut’s satellite and weather API, documented at the developer documentation hub, including patterns used in broader agri-business solutions.
Access the apps directly:
-

Web app: satellite and advisory dashboard.
-

Android: monitor fields on the go.
-

iOS: real-time data on iPhone/iPad.
Frequently Asked Questions
-
What does “agricultural solutions Canada” cover?
Three distinct things people search for under that phrase: publicly traded agriculture stocks (Nutrien, Rogers Sugar and similar), BASF Agricultural Solutions Canada’s Growing Home community program, and digital farm-management tools such as Farmonaut’s satellite and traceability stack. This page covers all three because search behaviour groups them, not because they’re the same product category. -
Is there a single list of “agriculture solutions” providers in Canada?
No — the term spans crop-protection products, farm-input suppliers, digital monitoring platforms and financing tools. Rather than a static list, use AAFC’s sector overview to see which value-chain segment ($31.7 billion primary agriculture, $35.8 billion processing, and so on) your need falls into, then search providers within that segment. -
What’s a reliable source for “agriculture solutions Canada” or “ag solutions Canada” data?
For sector-wide figures: Statistics Canada’s farm cash receipts releases and AAFC’s sector overview. For land values: Farm Credit Canada’s annual Farmland Values Report. For company-specific data: TMX Money and SEDAR+ filings. -
Are there specific companies named “Agriculture Solutions Inc.” in Canada?
Not as a single, widely tracked public entity — searches for “agriculture solutions inc” most often resolve to divisions like BASF Agricultural Solutions Canada, or to smaller regional agronomy retailers that use “Solutions” generically in their name. Confirm the exact legal entity via a provincial corporate registry search before relying on any figures attached to it. -
Which are the real Canadian agriculture stocks — and which is “best”?
Nutrien (NTR) is the largest and most direct exposure, followed by food processors like Rogers Sugar (RSI) and SunOpta (STKL/SOY). “Best” isn’t a fixed answer: it depends on whether you’re weighing dividend yield, pure-play agricultural exposure, or growth, and those rankings shift with the market — pull current prices from TMX Money before deciding. -
Why did AGT Food and Ingredients disappear from stock screens?
It traded on the TSX from 2007 to 2019, then was taken private in an approximately $432 million transaction that closed in April 2019. It no longer has a public ticker, which is why searches for “canadian agriculture companies” or “canadian agriculture stocks” that expect to find it come up empty. -
How can I verify these figures myself next year?
Check Statistics Canada’s Daily for the next farm cash receipts and farm income releases, FCC’s Farmland Values Report (typically published each March), and AAFC’s sector overview page, which updates its GDP and employment figures annually.
Conclusion
“Agricultural stocks Canada” resolves to a short, checkable list — Nutrien, Rogers Sugar, SunOpta and a handful of others, none of them in a dedicated “agriculture” GICS bucket, and at least one well-known name (AGT Food and Ingredients) no longer listed at all. Behind those tickers sits a $149.2 billion agri-food system, $101.4 billion in 2025 farm cash receipts, and farmland values still climbing at 9.3% nationally even as the pace slows from 2022’s 12.8%. “Agricultural solutions Canada” spans that same ground from a different angle: BASF’s Growing Home program channelling $160,000 into rural communities, and digital tools like Farmonaut putting satellite monitoring, traceability and carbon tracking directly into growers’ hands.
Explore further:
- Carbon footprinting for emissions tracking and compliance
- Fleet and resource management for machinery and logistics
- Large-scale farm management tools for cooperatives and agencies
Discussion
Questions, corrections or field experience? Share them below. First-time comments are reviewed before they appear, and your email is never published.
No comments yet. Be the first to add a question or your experience.

 Mobitech Wireless
 FCF India
 Unifrutti Gulf
 Deluxe Conseil
 TVS Electronics
 BW Pipelines
 WICO
WICO Gen Chayat
 Chimera Innovation
 SkyHarvest
 Polaris Digitech
 Teledarbas
 Wild Oak Farm
 SFX
SFX Doodlakine
 Exurbia Geospatial
 Licence holder · Niger · Gold










