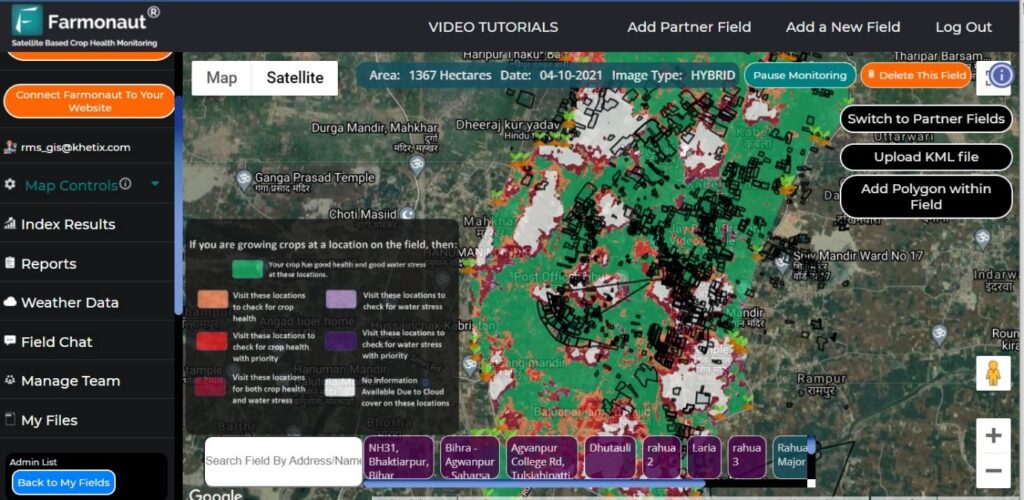
Remote Sensing

Farmonaut® Featured in GIS Resources Magazine: Revolutionizing Crop Damage Assessment with Geospatial Tech

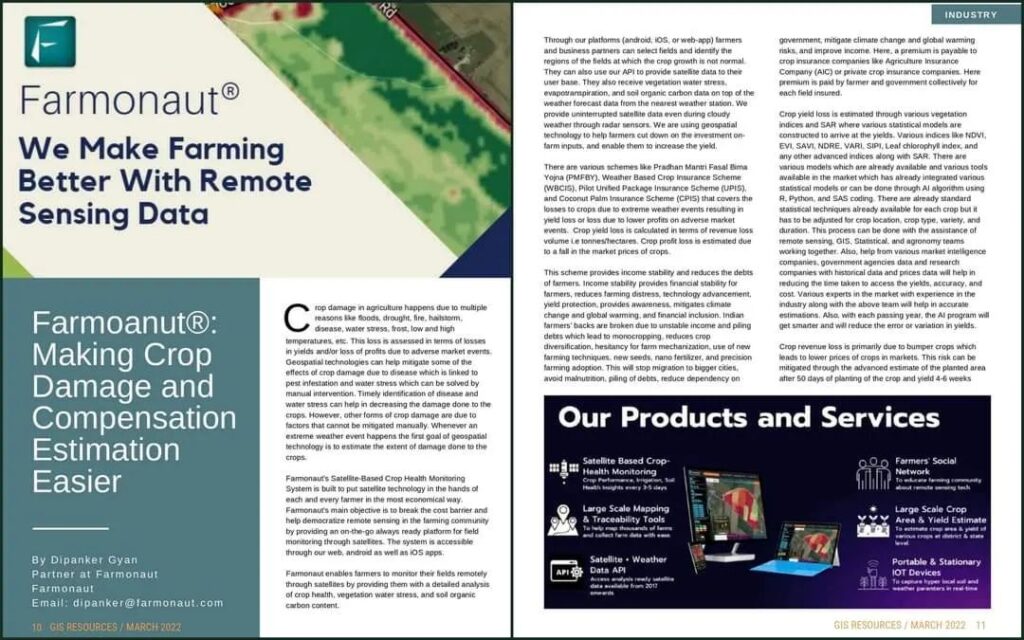
Check this latest feature about Farmonaut® in the 1st edition (March 2022) of the print and digital magazine of GIS Resources. The edition is titled “Geospatial Technologies for Crop Damage and Compensation Estimation.” The crop damage and compensation estimation process is a tedious process in the traditional way.

Read More About how Farmonaut® is providing solutions for the same.

Thanks to Dipanker Gyan for bringing together the content for the same.

Happy Farming!

#farming #organicfarming #crops #urbanfarming #fieldscouting #remotesensing #smartfarming #precisionagriculture #agro #agrotech #farm #agritech #agriculture #foodsecurity #technology #greentech #satellite #vegetation #india #gis #soil #soilhealth #soc #organicmatter

From Fields to Phones: Farmonaut’s Journey in Revolutionizing Agriculture with Satellite Technology

https://www.youtube.com/watch?v=j9ypsJwru7E

Farmonaut has been at the forefront of providing satellite data directly to the farmers through its award-winning developed android, iOS and web platforms and has monitored lakhs of hectares of farmlands nationally as well as internationally.

Hear out Farmonaut’s Ankur Omar as he talks about the challenges in convincing farmers to implement such new-age technologies. Omar also reveals details about the company’s recent partnerships in Uzbekistan and Australia.

Joining JioGenNext’s Market Access Program has been very beneficial for a bootstrapped company like Farmonaut, Omar says, as the mentors have helped them understand the nuances of pitching to investors and in gaining market access.

#farming #organicfarming #crops #urbanfarming #fieldscouting #remotesensing #greentech #smartfarming #precisionagriculture #farm #agritech #vegetables #agriculture #foodsecurity #technology #greentech #satellite #vegetation #india #gis

Mastering Crop Hydration: Farmonaut’s Guide to NDWI, NDMI, and Evapotranspiration

https://farmonaut.com/blogs/remote-sensing/farmonaut-guide-for-knowing-irrigation-parameters-ndwi-ndmi-evapotranspiration/

Knowing the condition of your crop irrigation is crucial to avoid degradation in crop health. Through remote sensing knowing the water content and moisture content is possible.

Farmonaut has provided this data to farmers to know the condition of their crops and take necessary irrigation practices to avoid the drying of crops.

Read the above article for more details.

Happy Farming!

#farming #organicfarming #crops #urbanfarming #fieldscouting #remotesensing #greentech #smartfarming #precisionagriculture #agro #agrotech #farm #agritech #vegetables #agriculture #foodsecurity #technology #satellite #vegetation #india #gis

Revolutionizing Wheat Farming: Farmonaut’s Satellite-Powered Crop Monitoring Expands to Sehore, MP

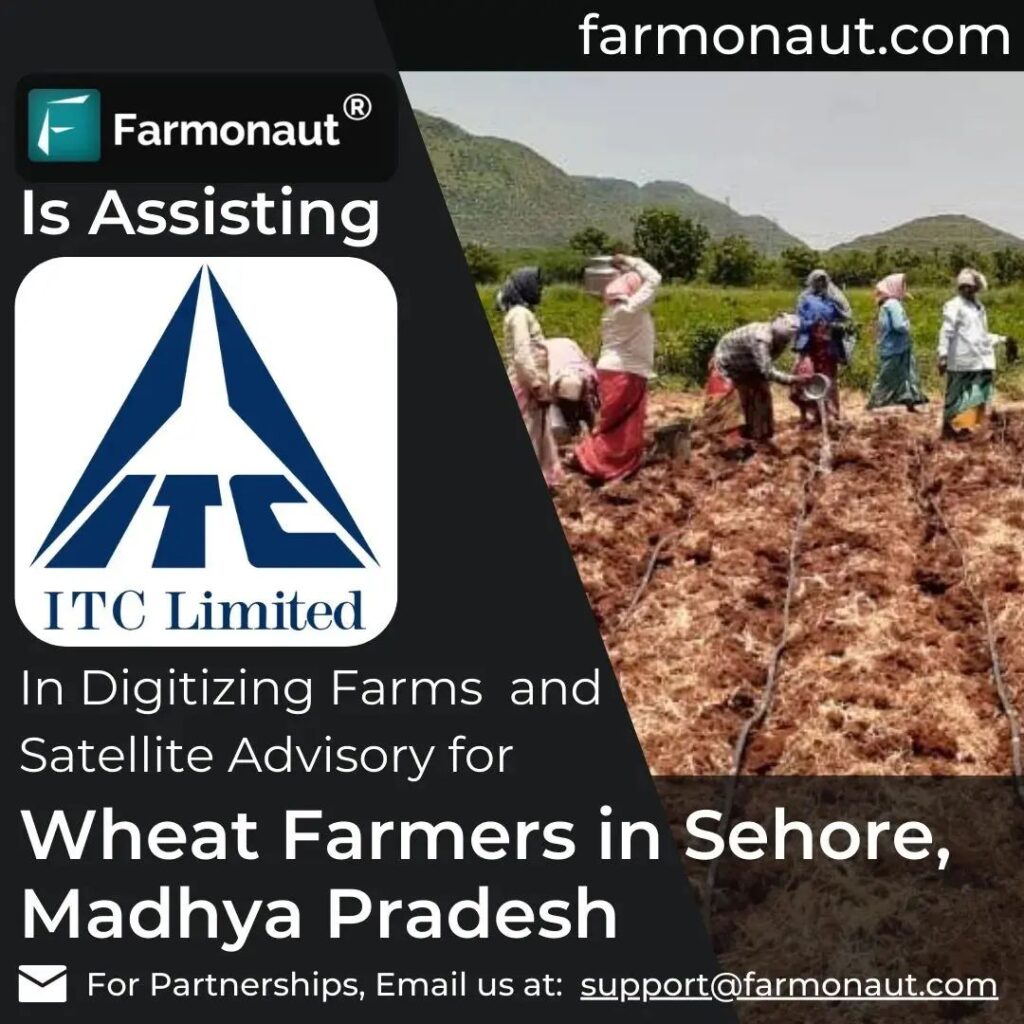
After completing the monitoring of paddy farmers from UP, MP, Rajasthan, and Maharashtra for ITC Limited, we are now Digitizing Farms and disseminating Satellite Based Crop Health Analysis to Wheat farmers in Sehore, Madhya Pradesh for ITC Limited in this ongoing season. The farmer onboarding is already complete. Farmonaut® is constantly generating latest satellite insights and advisory about crop health, irrigation requirement, soil health (18 different satellite parameters) and so much more for all the farmers. A further Crop Area and Yield Estimation will be performed on a large scale using our Automated Crop Area and Yield Estimation system as well.

Happy Farming! 🙂

#farming #organicfarming #crops #urbanfarming #fieldscouting #remotesensing #greentech #smartfarming #precisionagriculture #farm #agritech #vegetables #agriculture #foodsecurity #technology #greentech #satellite #vegetation #india #gis

Spice from Space: Mapping Rajasthan’s Cumin Fields with Cutting-Edge Satellite Technology

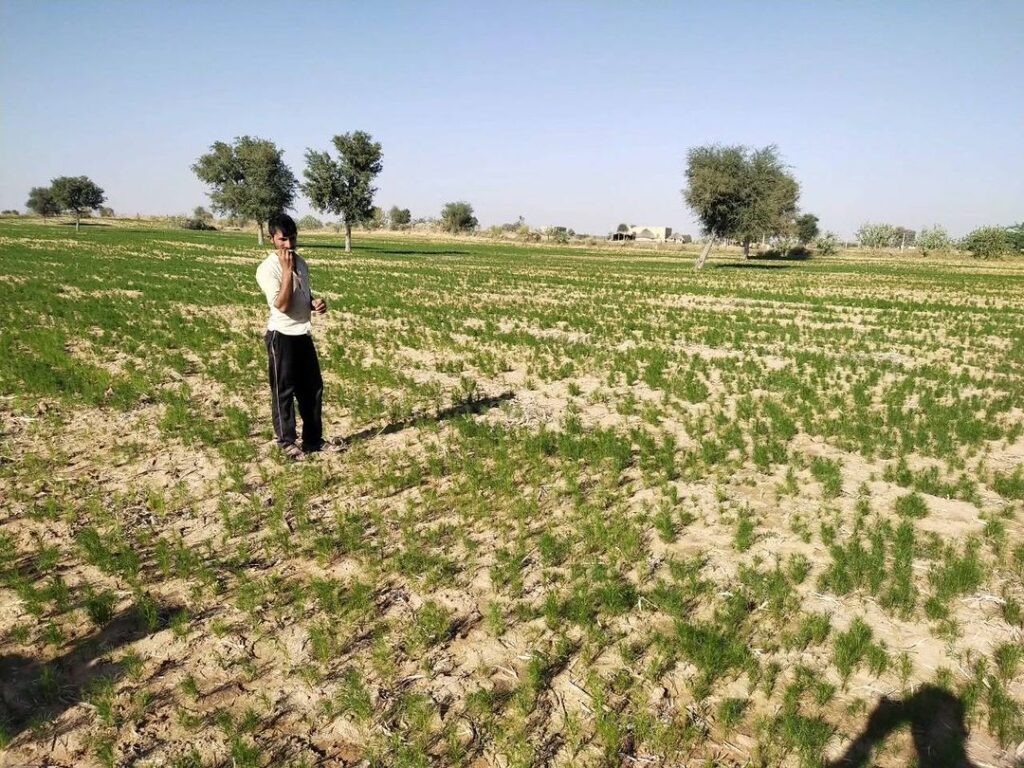
Jeera (Cumin) farm Mapping going on in Rajasthan. The collected ground truthing data will be used for jeera area estimation in the Rajasthan region.

Happy Farming!

#farming #organicfarming #crops #urbanfarming #fieldscouting #remotesensing #greentech #smartfarming #precisionagriculture #agro #agrotech #farm #agritech #vegetables #agriculture #foodsecurity #technology #satellite #vegetation #india #gis

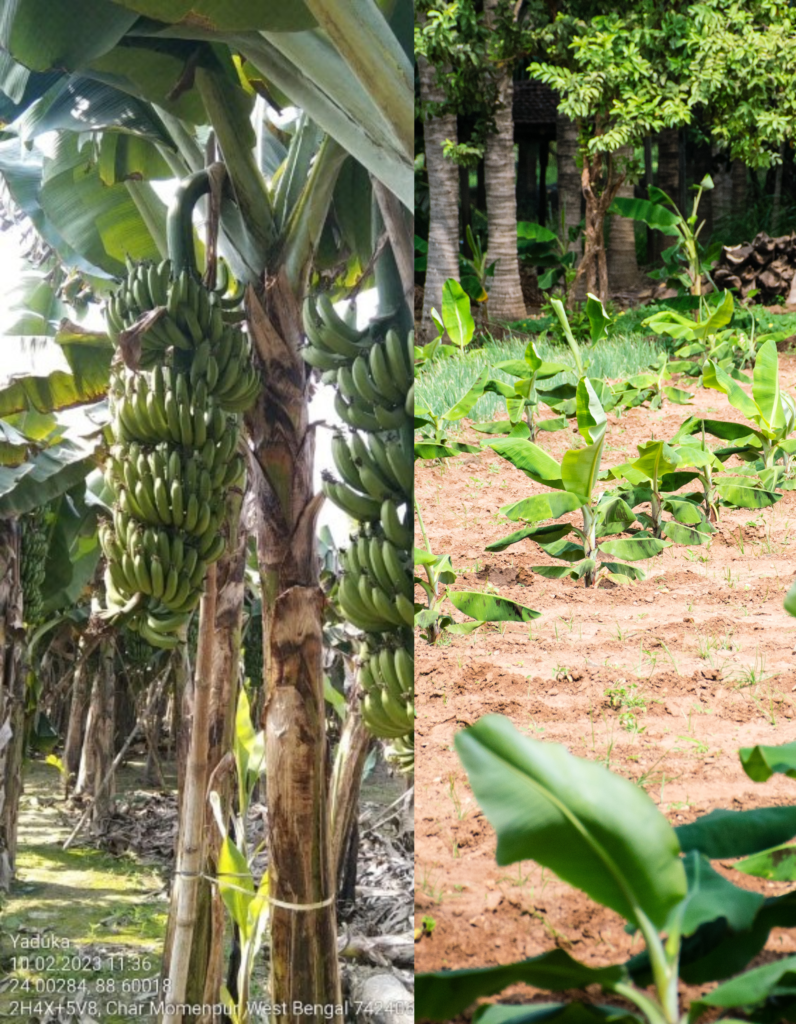
Spice and Fruit Revolution: Mapping Cumin in Rajasthan and Bananas in West Bengal with Cutting-Edge Technology

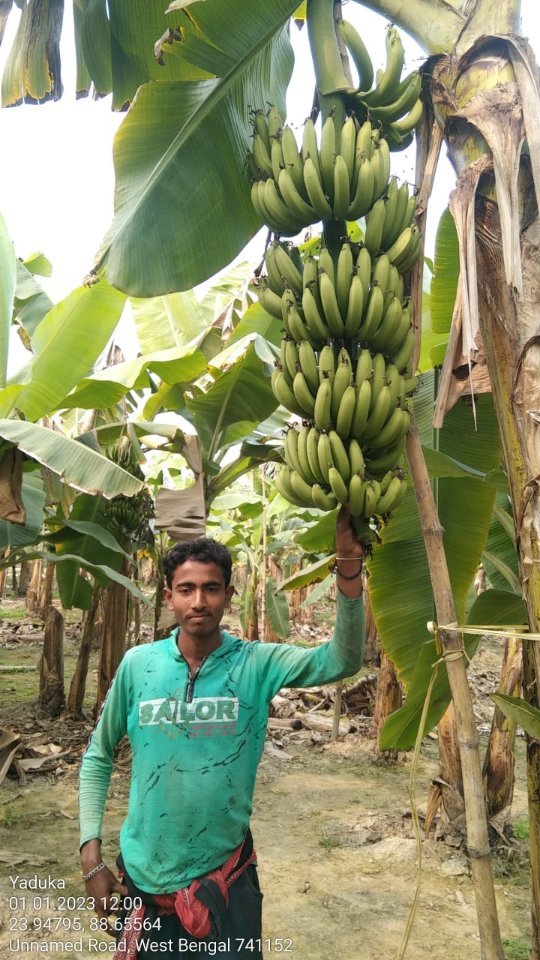
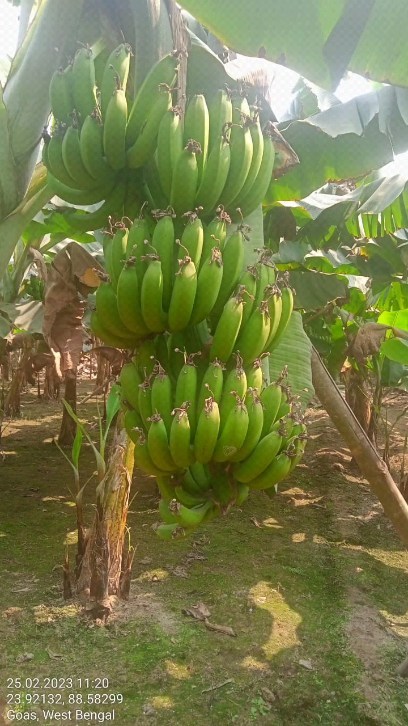
Jeera (Cumin) and Banana farm Mapping going on in Rajasthan and West Bengal respectively. The collected ground truthing data will be used for jeera area and Banana area estimation.

Happy Farming!

#farming #organicfarming #crops #urbanfarming #fieldscouting #remotesensing #greentech #smartfarming #precisionagriculture #agro #agrotech #farm #agritech #vegetables #agriculture #foodsecurity #technology #satellite #vegetation #india #gis

Spudnik in Madhya Pradesh: Mapping Potato Fields from Space

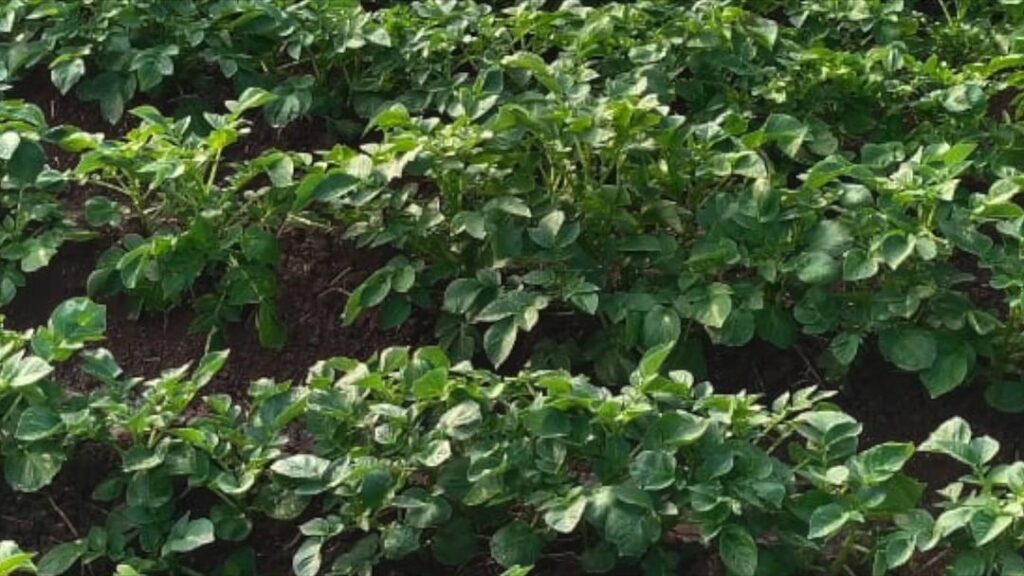
Potato farm Mapping is going on in Madhya Pradesh. The collected ground truthing data will be used for potato area estimation.

Happy Farming! 👩‍🌾 👨‍🌾

#farming #organicfarming #crops #urbanfarming #fieldscouting #remotesensing #greentech #smartfarming #precisionagriculture #agro #agrotech #farm #agritech #vegetables #agriculture #foodsecurity #technology #satellite #vegetation #india #gis

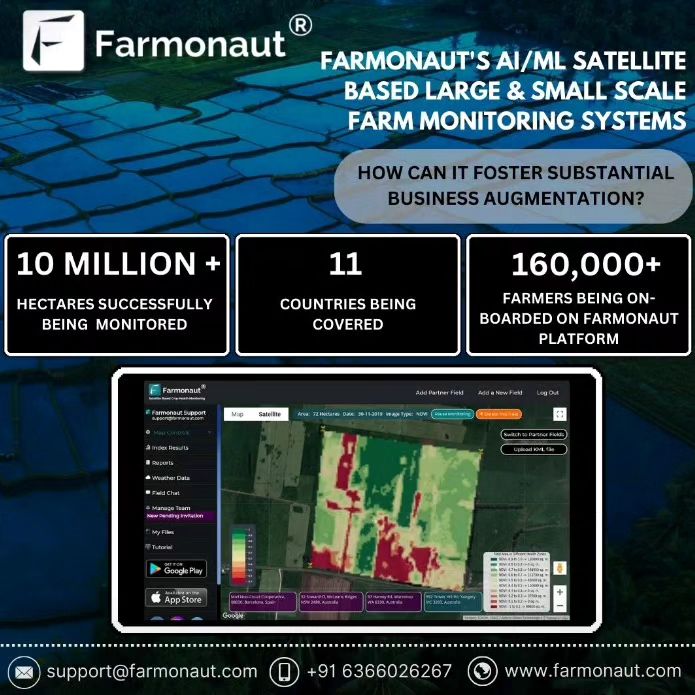
Revolutionizing Agriculture: How AI-Powered Satellite Monitoring is Transforming Farming

Agriculture plays a vital role in nourishing the world, but it comes with its fair share of challenges. However, thanks to groundbreaking advancements in technology, there’s a solution to boost agricultural productivity and make farming more efficient. 🌱

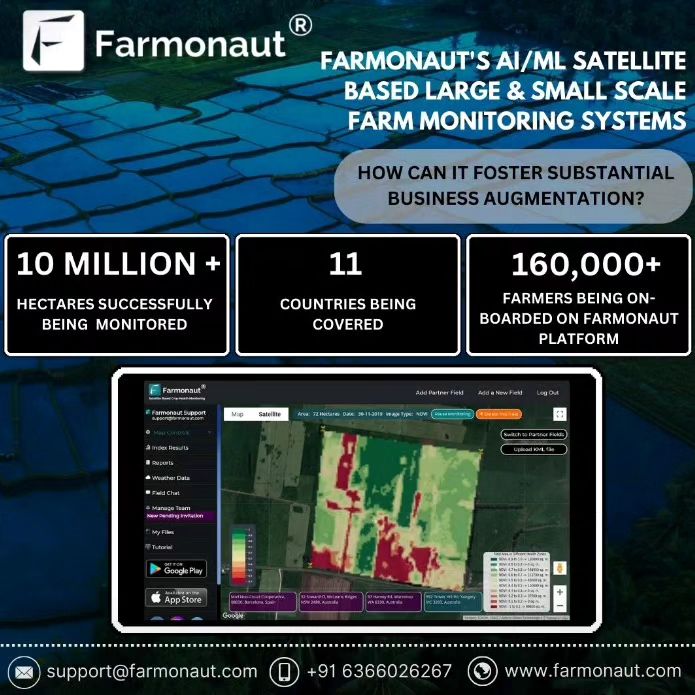
Farmonaut®’s AI/ML Satellite-based Large Scale Farm and Small Scale Farm Monitoring Systems harnesses the power of Artificial Intelligence (AI) and Machine Learning (ML) to monitor farms of all sizes. Farmonaut®’s cutting-edge platform offers businesses a wide range of insights, including crop health, soil moisture, irrigation efficiency, evapotranspiration, soil organic carbon, and much more. 📈

The heart of their innovation lies in satellite-based crop health monitoring, combined with the latest remote sensing technology. By gathering precise crop data from the satellites, Farmonaut® empowers farmers, businesses and agricultural experts with essential insights into crop growth, development, and overall health. 🌿

With services like crop area and yield estimation, radar data weather forecasting, land use classification, and plantation management, Farmonaut® is leading the way we approach agriculture. 🌾

Click the link below to read the blog and discover how Farmonaut®’s AI/ML satellite-based monitoring can serve your business! 👇

🔗 Read more: https://lnkd.in/dpugXwky

#Agriculture #AI #ML #FarmingTechnology #Agribusiness #SatelliteMonitoring #CropHealth #Farmonaut

From Soil to Satellites: Celebrating Farmers and Revolutionizing Agriculture with Farmonaut

Today, our heartfelt gratitude goes out to the #incredible #farmers—the unsung heroes who work the soil to feed our nation. Let’s unite in showing them the love they truly deserve. Your hard work sustains us all, and for that, we are deeply thankful. Farmers — our everyday heroes!

Farmonaut® is at the forefront of supporting #farmers with the latest #tech. Using #crop health monitoring, tracking organic soil content, mapping your farms with #satellites in just 2 minutes using WhatsApp and many more tech advancements, our app provides advisory reports seamlessly. Empowering farmers with cutting-edge technology for #enhanced #yield and #sustainable #agriculture. Together, let’s cultivate a future of abundance!

#FarmersDay #Gratitude #Farmonaut #TechForAgriculture

Farmonaut’s 20 Million Milestone: Revolutionizing Global Land Management with Lightning-Fast Satellite Imagery

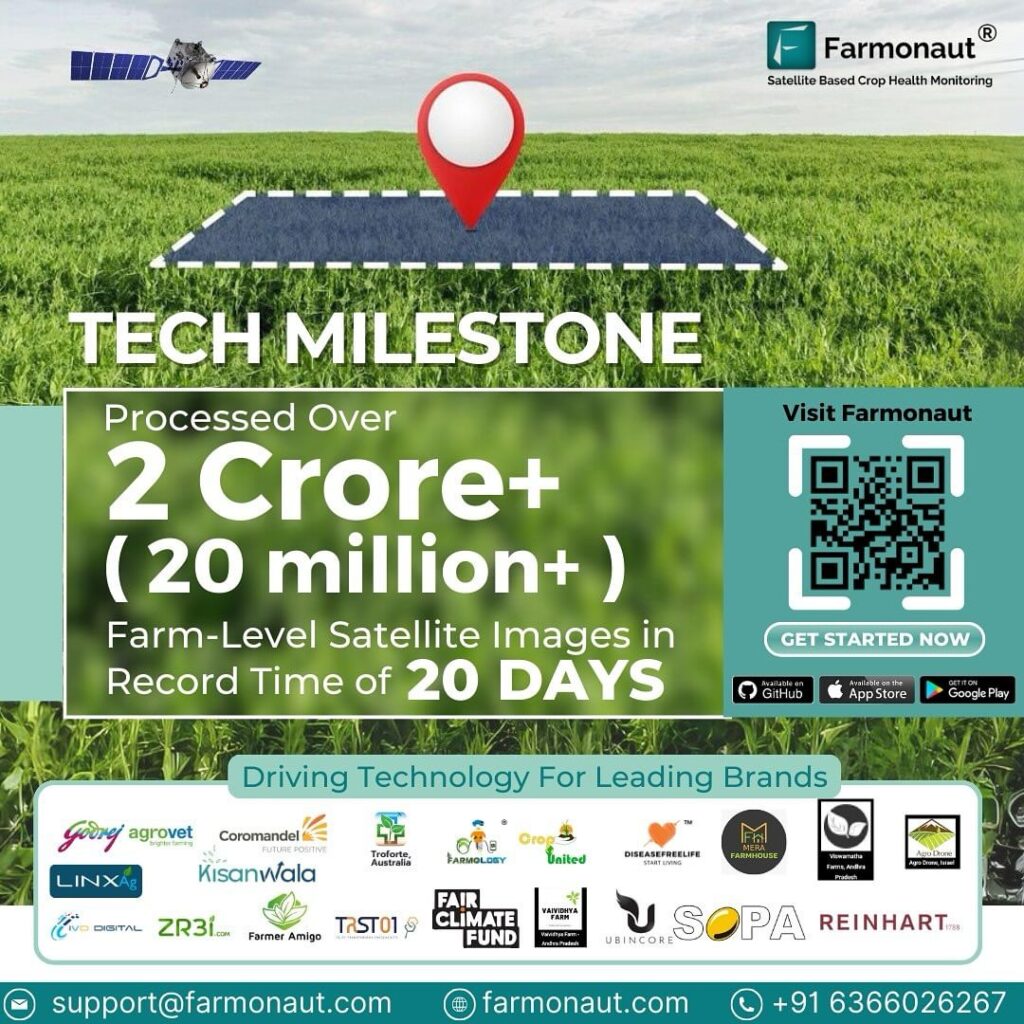
In an extraordinary leap forward, the Farmonaut platform has processed over 20 million farm-level satellite images in an astonishing 20-day timeframe!

This milestone isn’t just about farming; it’s about supporting businesses worldwide. With Farmonaut’s rapid data processing capabilities, businesses gain invaluable insights for not only agriculture but also for initiatives like afforestation and tackling deforestation.

Congratulations to the Farmonaut team for this monumental achievement!

#Farmonaut #SatelliteImagery #BusinessInsights #Afforestation #Deforestation #TechMileston

Revolutionizing Farm Mapping: One Coordinate, Infinite Possibilities

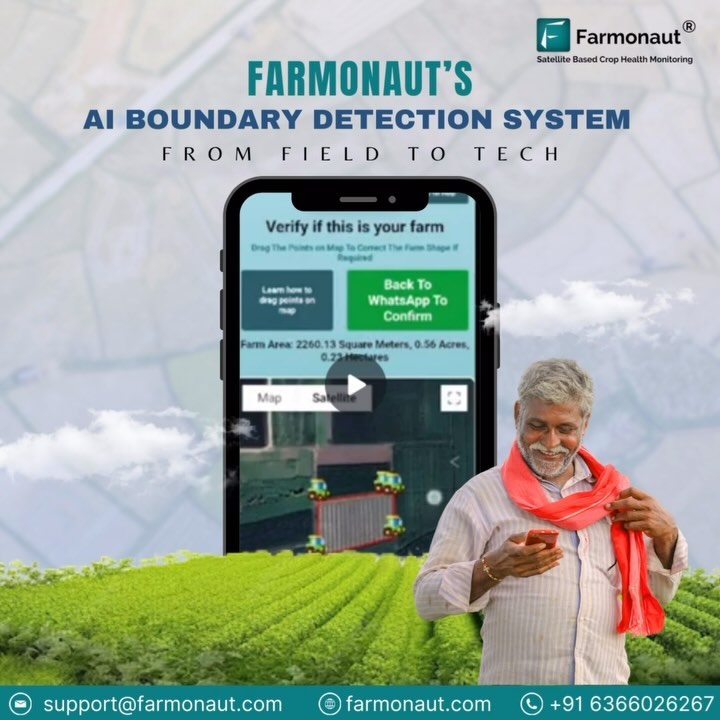
Gone are the days of uncertainty surrounding land boundaries and the tedious, time-consuming process of manual mapping. With our cutting-edge solution, all it takes is one coordinate input, and voila! Your farm is accurately mapped in no time, saving you valuable time and resources.

At Farmonaut®, we’re committed to transforming farming practices and supporting farmers every step of the way. Our Farmonaut’s Automated AI based Boundary Detection System is here to simplify your farm mapping needs effortlessly.
Automated AI based Farm boundary detection system will help in –

🎯 Uncertainty regarding land boundaries
🎯 Managing large-scale operations involving multiple neighboring farms
🎯 Eliminating time-consuming manual process, especially for large farms.

Say goodbye to the hassle of managing large-scale operations and neighbouring farms. Our automated system ensures improved efficiency and precise mapping, empowering you to focus on what truly matters – your crops and livelihood.

Join the future of farming with Farmonaut’s Automated AI based Boundary Detection System. Let’s simplify your farming journey together!

Learn more – https://lnkd.in/gHmXSkKc

YouTube – https://lnkd.in/grCKAwHp
hashtag#Farmonaut hashtag#FarmMapping hashtag#AI hashtag#PrecisionFarming hashtag#Efficiency hashtag#RevolutionizingAgriculture

From India to the World: How Farmonaut’s Satellite Tech is Revolutionizing Global Agriculture

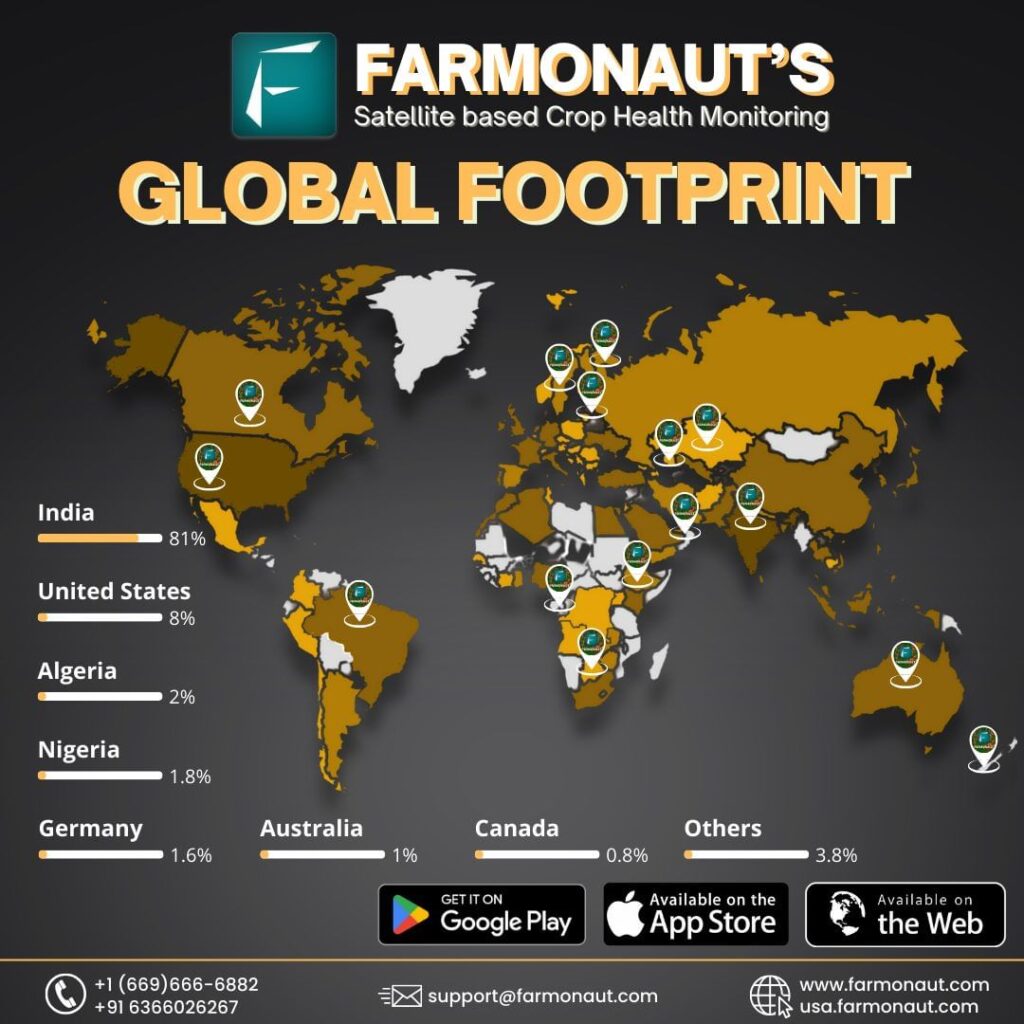
Farmonaut’s satellite-based crop health monitoring system is making a real difference in the lives of farmers, agribusinesses, start-ups, research organizations, and governments worldwide!

With 81% of our users in India, 8% in the United States, and others across Algeria, Nigeria, Germany, Australia, Canada, and beyond, our reach is truly global. We are proud to support stakeholders in optimizing their crop health and productivity.

Our mission is simple: to advance agriculture and promote sustainable farming practices. Whether you’re a smallholder, managing large-scale operations, conducting research, or shaping policy, Farmonaut’s technology is here to help you make informed decisions for a better harvest.

Join the Farmonaut community today and experience the benefits of smarter farming. Let’s grow together!

#Farmonaut #SustainableFarming #Agriculture #CropHealth #FarmTech #Agribusiness #Startups #Research #Governments

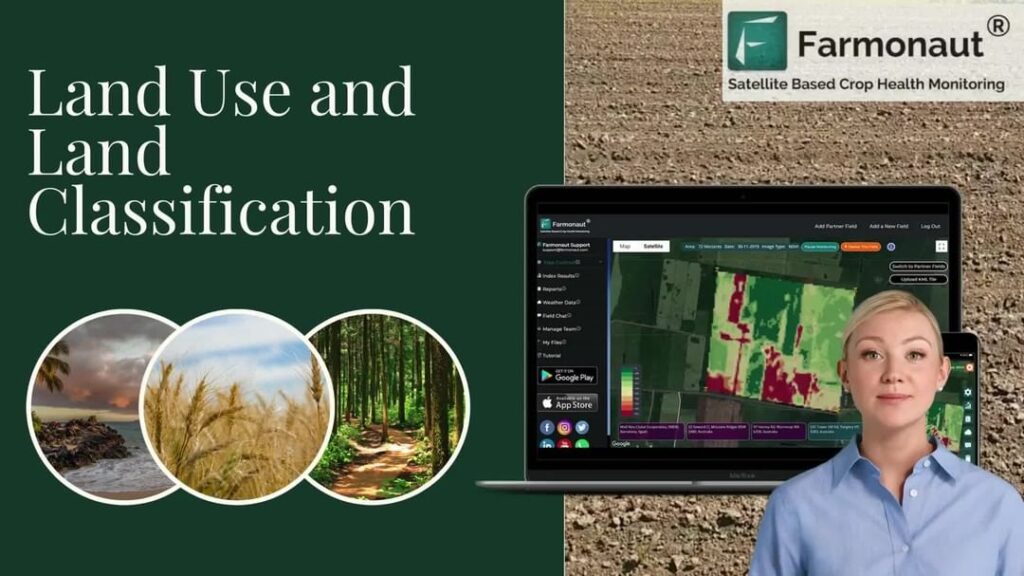
Revolutionizing Agriculture: How Farmonaut’s Satellite-Powered LULC Insights Drive Sustainable Farming

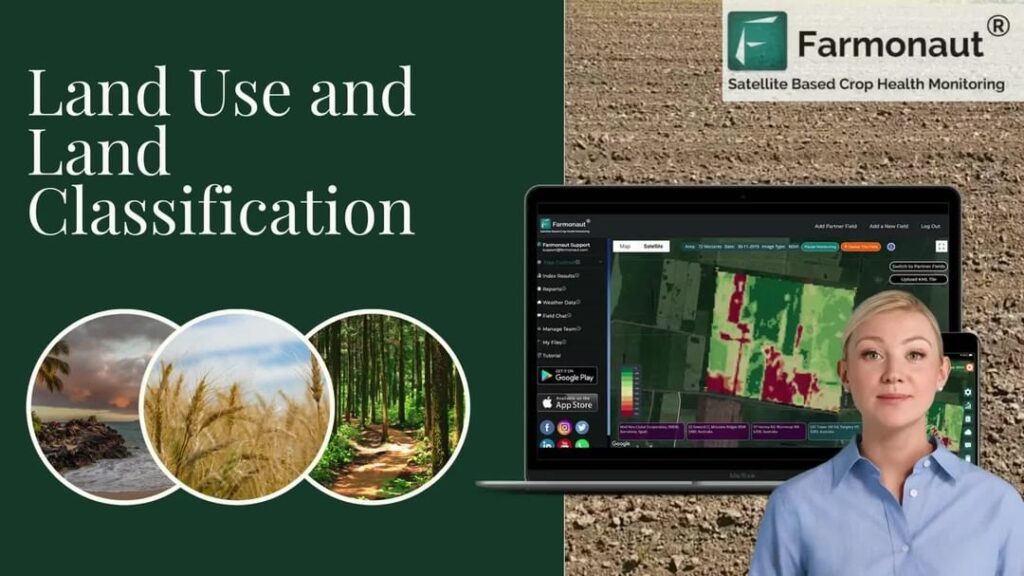
Join us as we dive into how Farmonaut® is leveraging 𝐬𝐚𝐭𝐞𝐥𝐥𝐢𝐭𝐞 𝐭𝐞𝐜𝐡𝐧𝐨𝐥𝐨𝐠𝐲 to revolutionize agricultural practices through 𝐋𝐚𝐧𝐝 𝐔𝐬𝐞 𝐚𝐧𝐝 𝐋𝐚𝐧𝐝 𝐂𝐥𝐚𝐬𝐬𝐢𝐟𝐢𝐜𝐚𝐭𝐢𝐨𝐧 (𝐋𝐔𝐋𝐂) 𝐢𝐧𝐬𝐢𝐠𝐡𝐭𝐬. These cutting-edge techniques are empowering farmers and agribusinesses to make 𝐝𝐚𝐭𝐚-𝐝𝐫𝐢𝐯𝐞𝐧 𝐝𝐞𝐜𝐢𝐬𝐢𝐨𝐧𝐬 on 𝐜𝐫𝐨𝐩 𝐦𝐚𝐧𝐚𝐠𝐞𝐦𝐞𝐧𝐭, 𝐫𝐞𝐬𝐨𝐮𝐫𝐜𝐞 𝐨𝐩𝐭𝐢𝐦𝐢𝐳𝐚𝐭𝐢𝐨𝐧, and 𝐜𝐨𝐧𝐬𝐞𝐫𝐯𝐚𝐭𝐢𝐨𝐧 𝐩𝐫𝐚𝐜𝐭𝐢𝐜𝐞𝐬—ultimately leading to improved 𝐬𝐮𝐬𝐭𝐚𝐢𝐧𝐚𝐛𝐢𝐥𝐢𝐭𝐲 and increased 𝐜𝐫𝐨𝐩 𝐲𝐢𝐞𝐥𝐝𝐬.

Learn how Farmonaut® is transforming 𝐥𝐚𝐧𝐝 𝐜𝐥𝐚𝐬𝐬𝐢𝐟𝐢𝐜𝐚𝐭𝐢𝐨𝐧into a powerful tool for 𝐬𝐦𝐚𝐫𝐭𝐞𝐫, 𝐦𝐨𝐫𝐞 𝐬𝐮𝐬𝐭𝐚𝐢𝐧𝐚𝐛𝐥𝐞 𝐟𝐚𝐫𝐦𝐢𝐧𝐠, helping the agricultural industry thrive while protecting the environment.

Subscribe to stay updated on the latest innovations in 𝐚𝐠𝐫𝐢𝐜𝐮𝐥𝐭𝐮𝐫𝐚𝐥 𝐭𝐞𝐜𝐡𝐧𝐨𝐥𝐨𝐠𝐲 for a more sustainable future!

#Farmonaut #Agritech #Sustainability #LandUse #CropManagement #SatelliteTechnology #SmartFarming #AgTech #SustainableFarming #DataDrivenAgriculture #LandClassification #FarmTech #Conservation

Revolutionize Your Farming: Monitor Crops from Anywhere with Farmonaut’s Satellite Technology

Are you tired of visiting your farms frequently just to know the conditions of your crops? Do you want a solution to monitor your farm without physically being present? Farmonaut has got you covered!

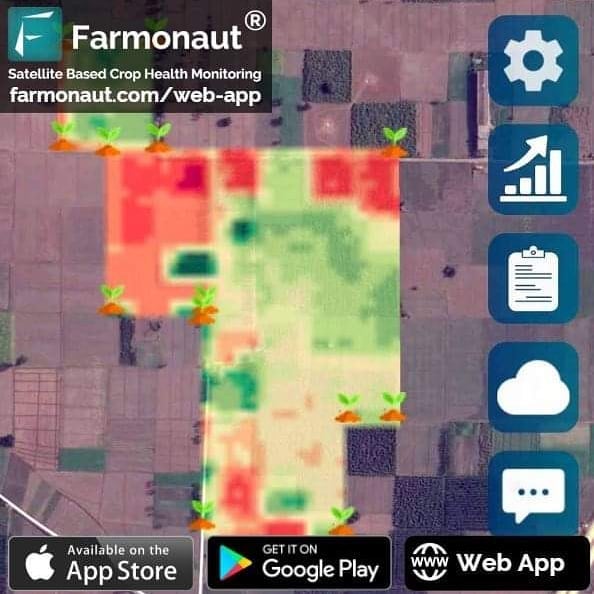
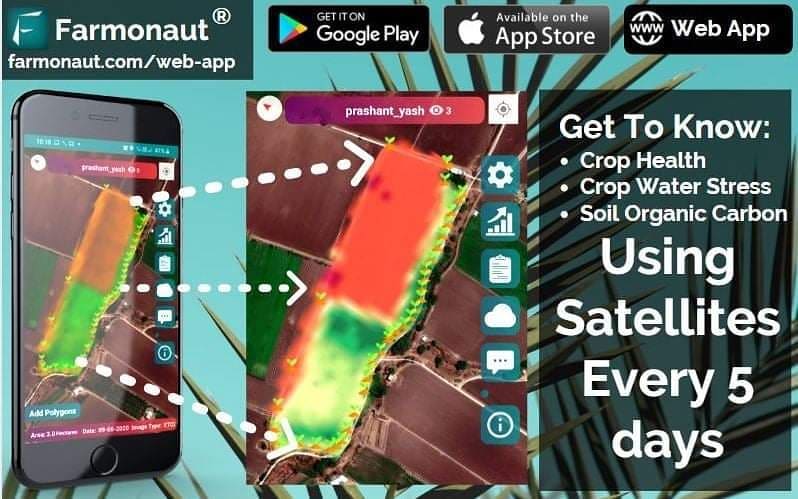
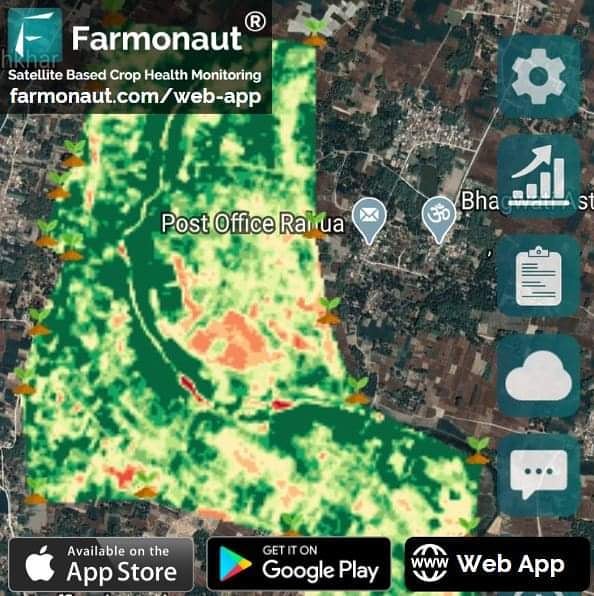
Farmonaut is a user-friendly app that provides insights about your farm through satellite captured data. The satellite captures the farm every 5 days, and the images are processed by Farmonaut’s system, which gives you 18 different parameters to identify areas that requires attention.

Using Farmonaut, you can identify areas that require irrigation, as well as areas that have been attacked by pests or diseases at an early stage.

All of this information is provided to you in an easy-to-understand report, which is available in over 50 languages.

You can access the Farmonaut app from the web app, as well as from the Play Store and App Store. We also provide notifications through WhatsApp, so you can stay updated on the health of your farm at all times.

So, why wait? Download the Farmonaut app today and start monitoring your farm like a pro!

#Farmonaut #FarmingApp #SatelliteMonitoring #CropHealth #PrecisionFarming #SmartFarming #IrrigationManagement #PestDetection #DiseaseDetection #FarmInsights #EasyToUse #MultilingualSupport #PlayStore #AppStore #WhatsAppNotifications #StayUpdated #DownloadNow #FarmMonitoring #CropManagement #ModernFarming #AgricultureTechnology

Farmonaut: Pioneering Satellite-Driven Agriculture for Smarter Farming Solutions

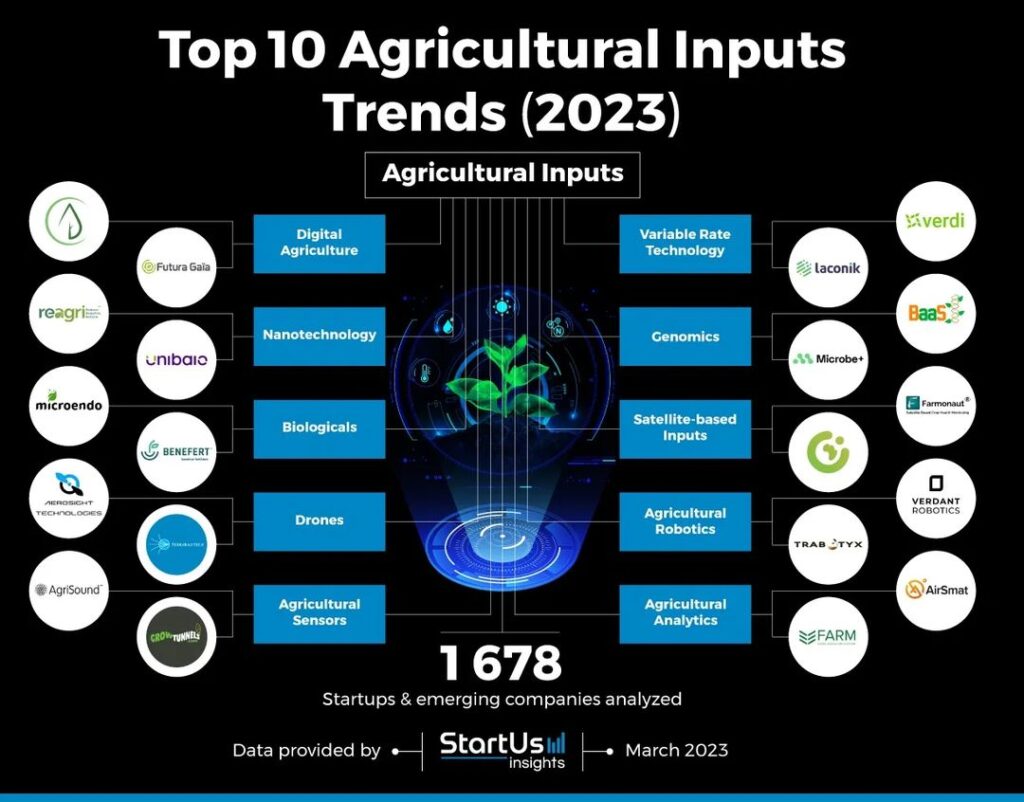
We are glad to be covered by StartUs Insights as one of the leaders in the Satellite Driven Agriculture.

Read more in detail on the link below:

https://www.startus-insights.com/innovators-guide/agricultural-inputs-trends/

#Farmonaut #FarmingApp #SatelliteMonitoring #CropHealth #PrecisionFarming #SmartFarming #IrrigationManagement #PestDetection #DiseaseDetection #FarmInsights #EasyToUse #MultilingualSupport #PlayStore #AppStore #WhatsAppNotifications #StayUpdated #DownloadNow #FarmMonitoring #CropManagement #ModernFarming #AgricultureTechnology

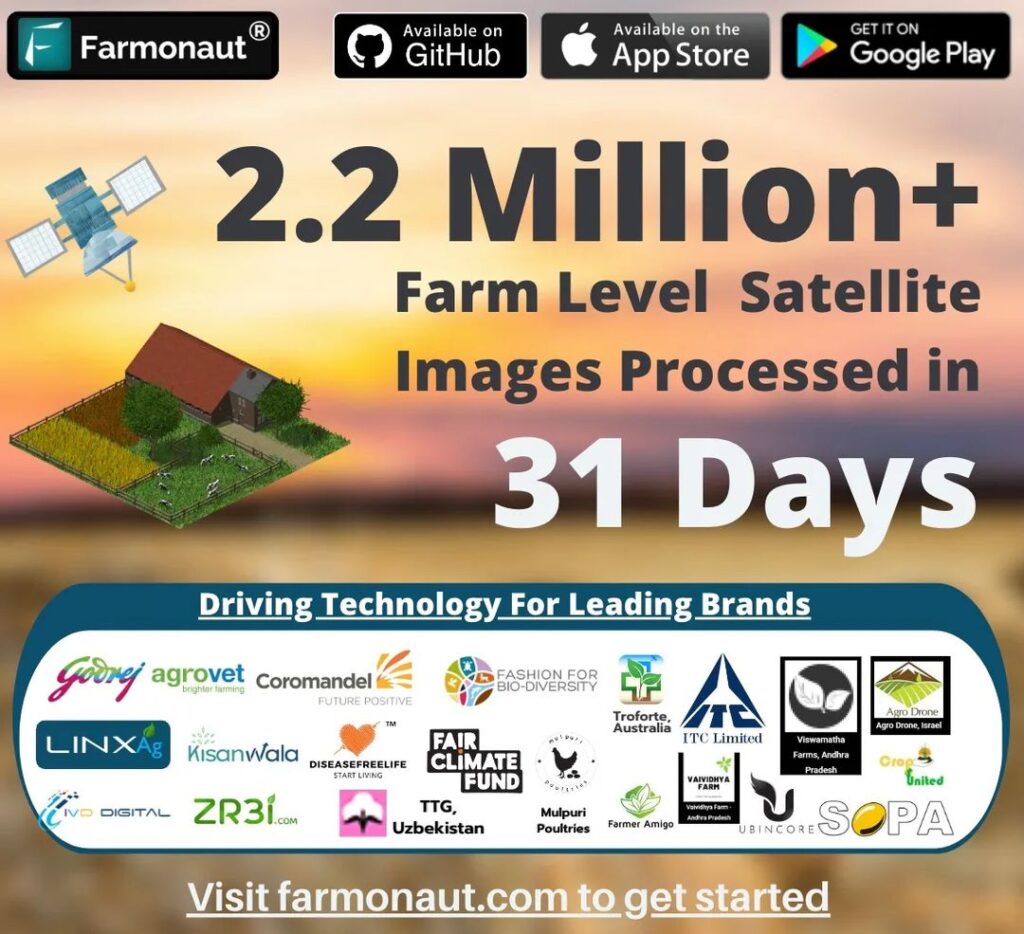
Farmonaut’s Milestone: 2.2 Million Farm Satellite Images Processed in 31 Days

Farmonaut has achieved a new milestone! We’ve processed a whopping 2.2 million+ farm level satellite images in just 31 days! This is a testament to our dedication to revolutionizing agriculture with cutting-edge technology.

By harnessing the power of satellite imagery, we’re able to provide invaluable insights to farmers, researchers, and agricultural stakeholders around the world. With our innovative approach, we’re making a significant impact on the way farming is done.

The future of agriculture is here, and we’re proud to be leading the charge!

Ankur Omar Akash Omar Samir Kumar Dipanker Gyan ASHISH KUMAR Vipul Baloda Saumitra Awasthi Shivani Dudhatra

#Farmonaut #SatelliteImagery #AgricultureTech #FarmLevelImages #Innovation #FarmingRevolution #AgriTech #SustainableFarming #CropMonitoring #PrecisionAgriculture #2point2MillionImages

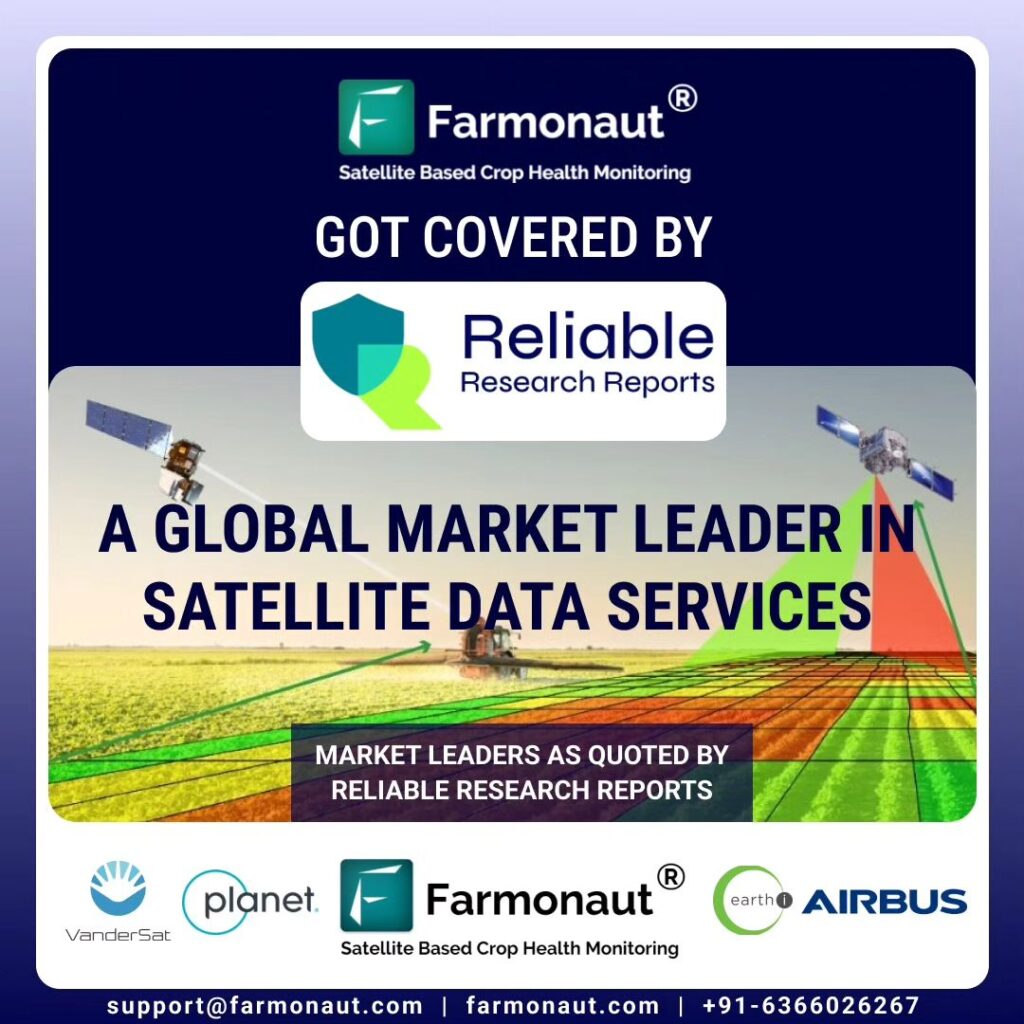
Farmonaut® Soars: Satellite Data Service for Agriculture Market Set to Grow 12.3% Annually

Farmonaut® has been covered by Reliable Research Reports, which provide in-depth insights into the factors influencing the market’s growth. This comprehensive “Satellite Data Service for Agriculture Market” report sheds light on drivers, restraints, opportunities, and challenges that are shaping the industry’s future.

The report also highlights competitive developments, including partnerships, investments, contracts, new technology advancements, and market expansions, further solidifying Farmonaut®’s position in the agricultural technology landscape.

According to the report, the Satellite Data Service for Agriculture market is projected to witness an impressive annual growth rate of 12.3% (CAGR 2023 – 2030). 📈

Kudos to the Farmonaut® team for their dedication and commitment to revolutionizing agriculture with data-driven solutions! 🙌 Let’s continue working towards a sustainable and efficient future for farmers worldwide. 🌱

Learn more – https://lnkd.in/dv7hi3CX

#Farmonaut #AgricultureTechnology #SatelliteData #DataDrivenAgriculture #MarketResearch #SustainableAgriculture #Innovation #Farming #TechInAgri

Revolutionizing Agriculture: How Farmonaut’s Satellite-Powered LULC Insights Drive Sustainable Farming

Join us as we dive into how Farmonaut® is leveraging 𝐬𝐚𝐭𝐞𝐥𝐥𝐢𝐭𝐞 𝐭𝐞𝐜𝐡𝐧𝐨𝐥𝐨𝐠𝐲 to revolutionize agricultural practices through 𝐋𝐚𝐧𝐝 𝐔𝐬𝐞 𝐚𝐧𝐝 𝐋𝐚𝐧𝐝 𝐂𝐥𝐚𝐬𝐬𝐢𝐟𝐢𝐜𝐚𝐭𝐢𝐨𝐧 (𝐋𝐔𝐋𝐂) 𝐢𝐧𝐬𝐢𝐠𝐡𝐭𝐬. These cutting-edge techniques are empowering farmers and agribusinesses to make 𝐝𝐚𝐭𝐚-𝐝𝐫𝐢𝐯𝐞𝐧 𝐝𝐞𝐜𝐢𝐬𝐢𝐨𝐧𝐬 on 𝐜𝐫𝐨𝐩 𝐦𝐚𝐧𝐚𝐠𝐞𝐦𝐞𝐧𝐭, 𝐫𝐞𝐬𝐨𝐮𝐫𝐜𝐞 𝐨𝐩𝐭𝐢𝐦𝐢𝐳𝐚𝐭𝐢𝐨𝐧, and 𝐜𝐨𝐧𝐬𝐞𝐫𝐯𝐚𝐭𝐢𝐨𝐧 𝐩𝐫𝐚𝐜𝐭𝐢𝐜𝐞𝐬—ultimately leading to improved 𝐬𝐮𝐬𝐭𝐚𝐢𝐧𝐚𝐛𝐢𝐥𝐢𝐭𝐲 and increased 𝐜𝐫𝐨𝐩 𝐲𝐢𝐞𝐥𝐝𝐬.

Learn how Farmonaut® is transforming 𝐥𝐚𝐧𝐝 𝐜𝐥𝐚𝐬𝐬𝐢𝐟𝐢𝐜𝐚𝐭𝐢𝐨𝐧into a powerful tool for 𝐬𝐦𝐚𝐫𝐭𝐞𝐫, 𝐦𝐨𝐫𝐞 𝐬𝐮𝐬𝐭𝐚𝐢𝐧𝐚𝐛𝐥𝐞 𝐟𝐚𝐫𝐦𝐢𝐧𝐠, helping the agricultural industry thrive while protecting the environment.

Subscribe to stay updated on the latest innovations in 𝐚𝐠𝐫𝐢𝐜𝐮𝐥𝐭𝐮𝐫𝐚𝐥 𝐭𝐞𝐜𝐡𝐧𝐨𝐥𝐨𝐠𝐲 for a more sustainable future!

#Farmonaut #Agritech #Sustainability #LandUse #CropManagement #SatelliteTechnology #SmartFarming #AgTech #SustainableFarming #DataDrivenAgriculture #LandClassification #FarmTech #Conservation

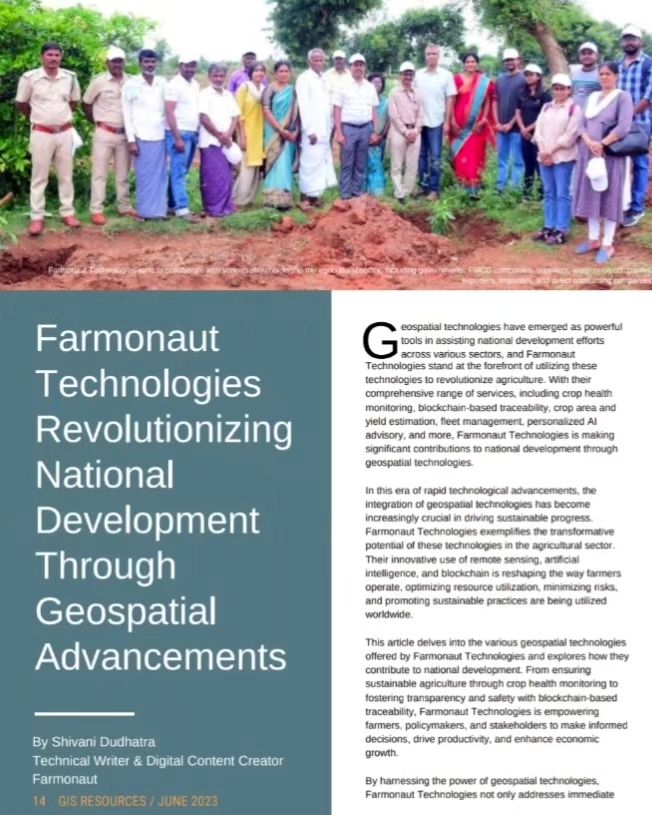
Farmonaut®: Pioneering National Progress Through Geospatial Innovation in Agriculture

Farmonaut® is making waves in revolutionizing national development through geospatial advancements, as highlighted in the latest issue of GIS Resources Magazine (Issue 2 | June 2023). 🚀

With a comprehensive range of services, including crop health monitoring, blockchain-based traceability, crop area and yield estimation, fleet management, personalized AI advisory, and more, Farmonaut® is at the forefront of utilizing geospatial technologies to drive progress across various sectors, especially agriculture. 🌾📊🌱🤝

Discover how Farmonaut®’s groundbreaking contributions are shaping national development by reading the article in GIS Resources Magazine: https://lnkd.in/dS-2Uvbk

#FarmonautTechnologies #GISResources #GeospatialAdvancements #AgricultureRevolution #NationalDevelopment #Innovation #Progress #blockchain #agriculture #management #ai #health #development

Revolutionizing Agriculture: How AI-Powered Satellite Monitoring is Transforming Farming

Agriculture plays a vital role in nourishing the world, but it comes with its fair share of challenges. However, thanks to groundbreaking advancements in technology, there’s a solution to boost agricultural productivity and make farming more efficient. 🌱

Farmonaut®’s AI/ML Satellite-based Large Scale Farm and Small Scale Farm Monitoring Systems harnesses the power of Artificial Intelligence (AI) and Machine Learning (ML) to monitor farms of all sizes. Farmonaut®’s cutting-edge platform offers businesses a wide range of insights, including crop health, soil moisture, irrigation efficiency, evapotranspiration, soil organic carbon, and much more. 📈

The heart of their innovation lies in satellite-based crop health monitoring, combined with the latest remote sensing technology. By gathering precise crop data from the satellites, Farmonaut® empowers farmers, businesses and agricultural experts with essential insights into crop growth, development, and overall health. 🌿

With services like crop area and yield estimation, radar data weather forecasting, land use classification, and plantation management, Farmonaut® is leading the way we approach agriculture. 🌾

Click the link below to read the blog and discover how Farmonaut®’s AI/ML satellite-based monitoring can serve your business! 👇

🔗 Read more: https://lnkd.in/dpugXwky

#Agriculture #AI #ML #FarmingTechnology #Agribusiness #SatelliteMonitoring #CropHealth #Farmonaut

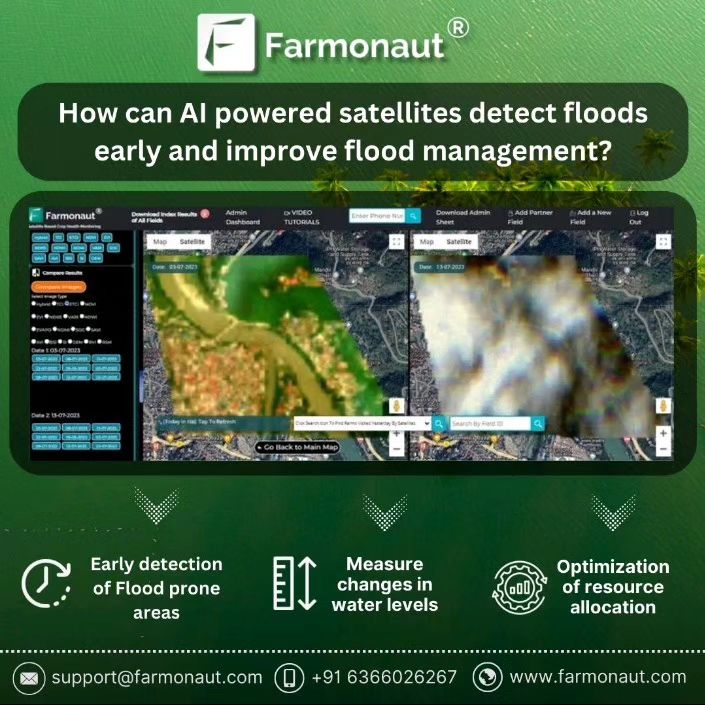
Revolutionizing Flood Detection: How AI-Powered Satellites Are Changing the Game

Floods are a pervasive and dangerous natural disaster, causing immense damage to property and lives. As satellite technology continues to evolve, Farmonaut®’s revolutionary approach envisions the potential of AI/ML-powered satellites in detecting early signs of floods in various ways. This empowers proactive decision-making to minimize the impact of such calamities.

Can AI-powered satellite systems identify early indicators of floods and enhance flood management strategies?

🌱 Monitoring Changes in Land Cover and Vegetation:
Satellites equipped with AI/ML can monitor changes in land cover and vegetation. These changes can act as early warnings, indicating that the ground is becoming saturated with water—an essential signal of imminent flooding.

💧 Measuring Changes in Water Levels:
Farmonaut®’s system is designed to measure changes in water levels. This critical information allows for tracking the flood’s progress and predicting when it might reach a critical level.

The recent devastating floods during the 2023 monsoon season in Northern India, affecting regions like Himachal Pradesh, Punjab, Chandigarh, Uttarakhand, Jammu and Kashmir, Haryana, Rajasthan, and Delhi, serve as a grim reminder of the importance of proactive flood management.

With proper preventive measures and the evolving AI/ML satellite systems, like the one envisioned by Farmonaut®, we can minimize the impact of such calamities and protect countless lives and livelihoods.

🔍 Learn More : https://lnkd.in/daQcSskv

#floodmanagement #AI #ML #satellitetechnology #Farmonaut
#FarmonautCommunity

From Seedling to Harvest: Revolutionizing Crop Monitoring with Farmonaut’s Satellite Technology

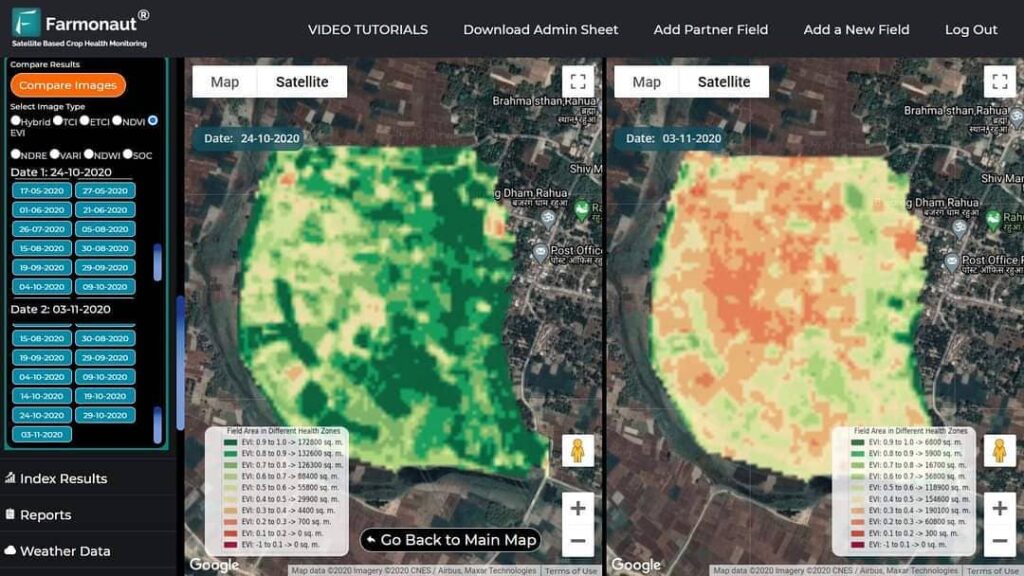
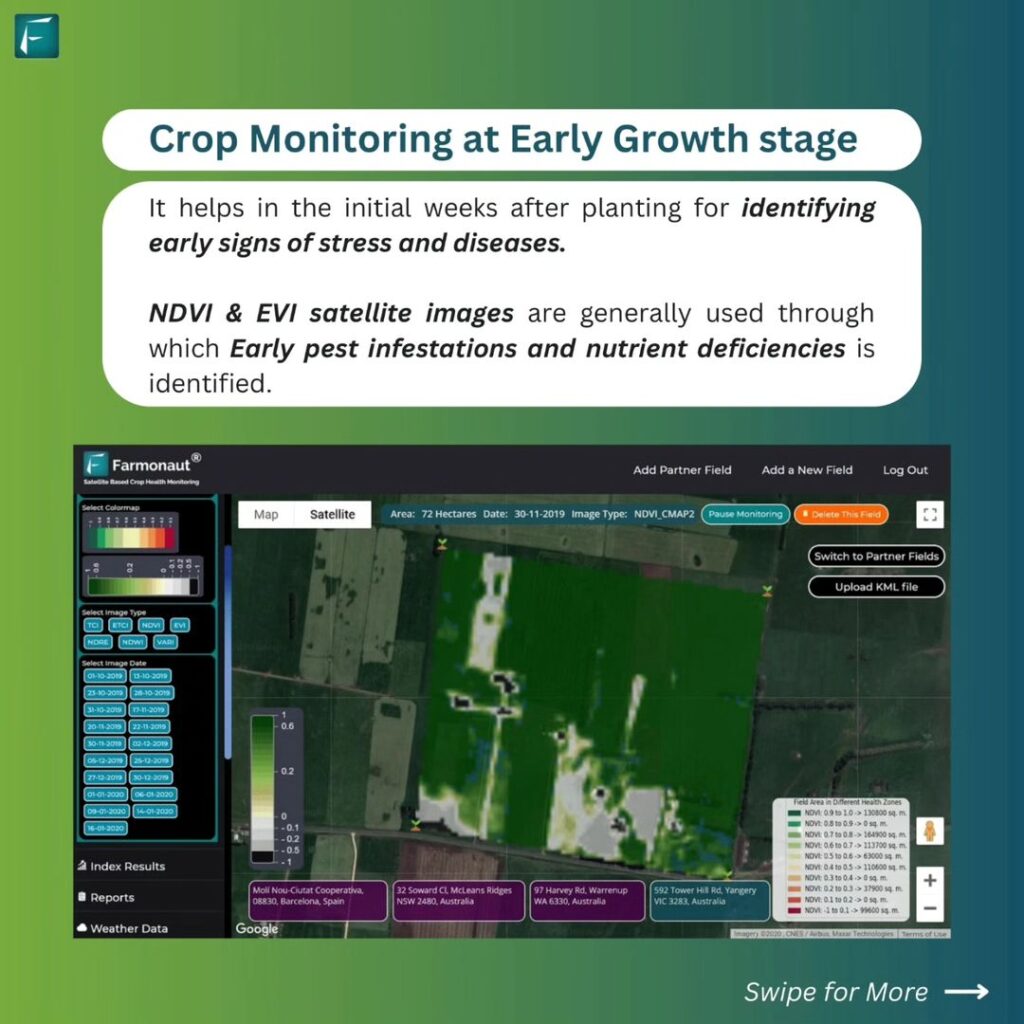
Crop monitoring has just reached new heights in modern agriculture! 🛰️🌾 Agri-businesses, research organizations and individual farmers can now harness the power of advanced technologies like NDVI, EVI, and NDRE satellite images for comprehensive crop monitoring throughout the growth stages from Farmonaut®’s web app platform – https://lnkd.in/fDhmAhj

🌱🔍 During the early growth stage, our cutting-edge NDVI and EVI indices enable quick detection of stress, diseases, and nutrient deficiencies, giving farmers the edge in making informed decisions shortly after planting.

🌾🎯 As the crops enter the later growth stage, our NDRE images come to the rescue, providing valuable insights into crop health, maturity, and identifying late-stage diseases and irrigation deficiencies that could impact final yields.

📈💡 With Farmonaut®, precision agriculture is at your fingertips, optimizing crop management and boosting productivity throughout the entire growth journey. 🚜💪

👉 Learn more : https://lnkd.in/dX4nHQpq

#Farmonaut #PrecisionAgriculture #CropMonitoring #ModernAgriculture #SatelliteImagery #NDVI #EVI #NDRE #FarmTech #AgriculturalInnovation
#FarmonautCommunity

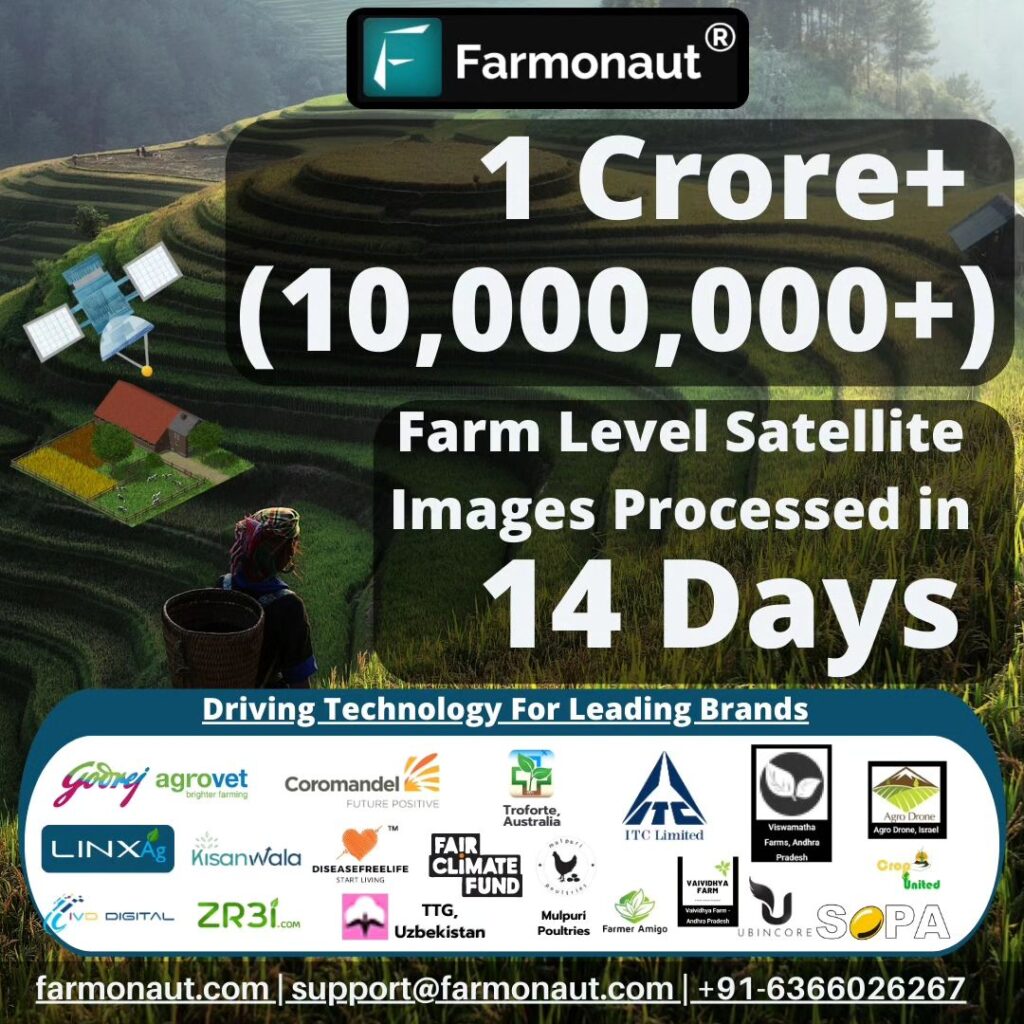
Farmonaut’s Satellite Revolution: 10 Million Farm Images Processed in Just 14 Days!

Farmonaut® platform has accomplished something truly extraordinary – processing over 10 million farm-level satellite images in a mere 14 days. 🛰️🌾
This milestone underscores the transformative potential of technology in reshaping how we perceive and optimize our agricultural domains. Major applause to the brilliant minds at Farmonaut® for their unwavering commitment to propelling the farming industry into an innovative era. 🌱

Learn more – https://farmonaut.com/

🌟 #AgTech #SatelliteImagery #AgriculturalInnovation #TechRevolution #FarmingSolutions #DigitalAgriculture

@ankuromar @akashomar.omar @akcreator2613 @dipankergyan @saumitra_awasthi @vkbaloda @_aey_shivani @__.soniee.__ @sejal_s_gawas @swatigupta5994

From Satellites to Soil: Farmonaut’s AI Revolution in Agriculture at IISc Bengaluru

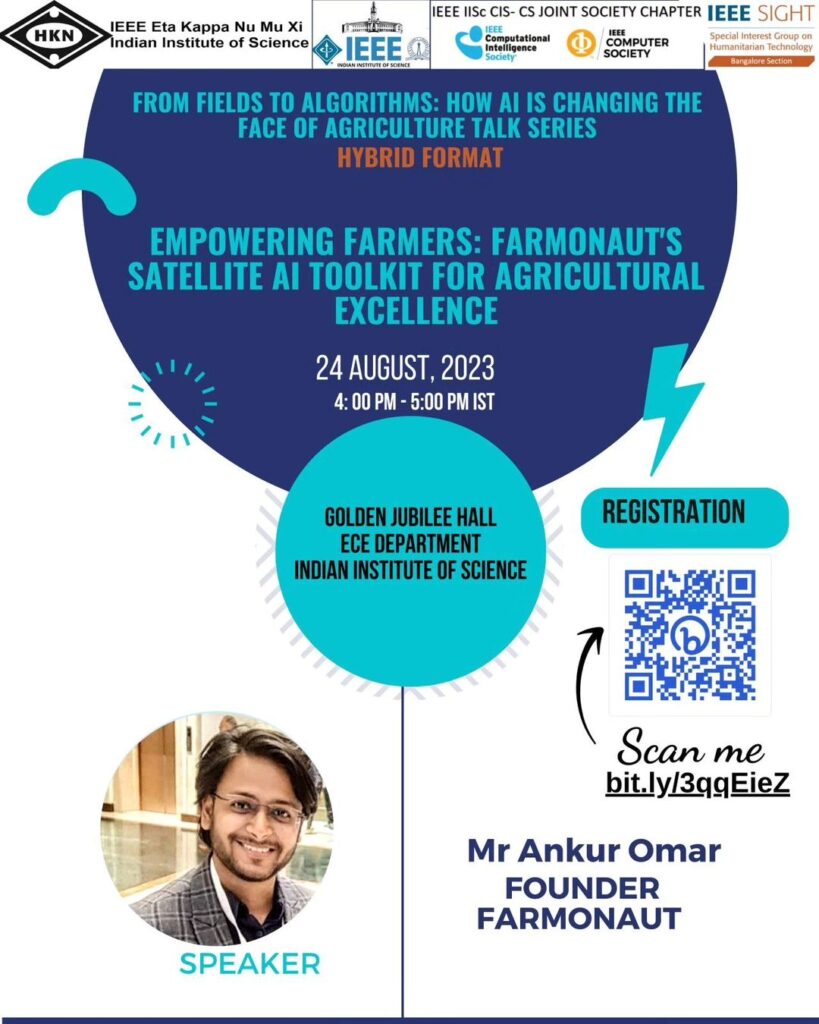
Farmonaut® is thrilled to announce that our Founder, Mr. Ankur Omar, has been invited as a keynote speaker to share his insights at the prestigious Indian Institute of Science (IISc) Bengaluru event on Empowering Farmers: Farmonaut®’s Satellite AI Toolkit for Agricultural Excellence.

🗓️ Date: 24th August 2023
⏰ Timing: 4:00 PM to 5:00 PM IST
🍽️ High Tea/Snacks: 5:00 PM
🏛️ Venue: Golden Jubilee Hall, Department of Electrical Communication Engineering – Indian Institute of Science

Hosted in collaboration with IEEE IISc CIS and CS Joint Society Chapter/IEEE SIGHT Bangalore Section, this event promises to be an enlightening exploration of how cutting-edge technology can revolutionize agriculture and uplift our farming community.

Don’t miss out on this exceptional opportunity to gain insights, network with industry leaders, and be a part of the agricultural transformation. Register now at the link below and mark your calendars!

🔗 Registration: https://lnkd.in/dQs-_jeS

Let’s come together to empower our farmers and drive agricultural excellence into the future. See you there! 🌱🚀 #EmpoweringFarmers #AgriculturalExcellence #Farmonaut #AIinAgriculture #Innovation #IISC2023

From Seedling to Harvest: Revolutionizing Crop Monitoring with Farmonaut’s Satellite Technology

Crop monitoring has just reached new heights in modern agriculture! 🛰️🌾 Agri-businesses, research organizations and individual farmers can now harness the power of advanced technologies like NDVI, EVI, and NDRE satellite images for comprehensive crop monitoring throughout the growth stages from Farmonaut®’s web app platform – https://lnkd.in/fDhmAhj

🌱🔍 During the early growth stage, our cutting-edge NDVI and EVI indices enable quick detection of stress, diseases, and nutrient deficiencies, giving farmers the edge in making informed decisions shortly after planting.

🌾🎯 As the crops enter the later growth stage, our NDRE images come to the rescue, providing valuable insights into crop health, maturity, and identifying late-stage diseases and irrigation deficiencies that could impact final yields.

📈💡 With Farmonaut®, precision agriculture is at your fingertips, optimizing crop management and boosting productivity throughout the entire growth journey. 🚜💪

👉 Learn more : https://lnkd.in/dX4nHQpq

#Farmonaut #PrecisionAgriculture #CropMonitoring #ModernAgriculture #SatelliteImagery #NDVI #EVI #NDRE #FarmTech #AgriculturalInnovation
#FarmonautCommunity

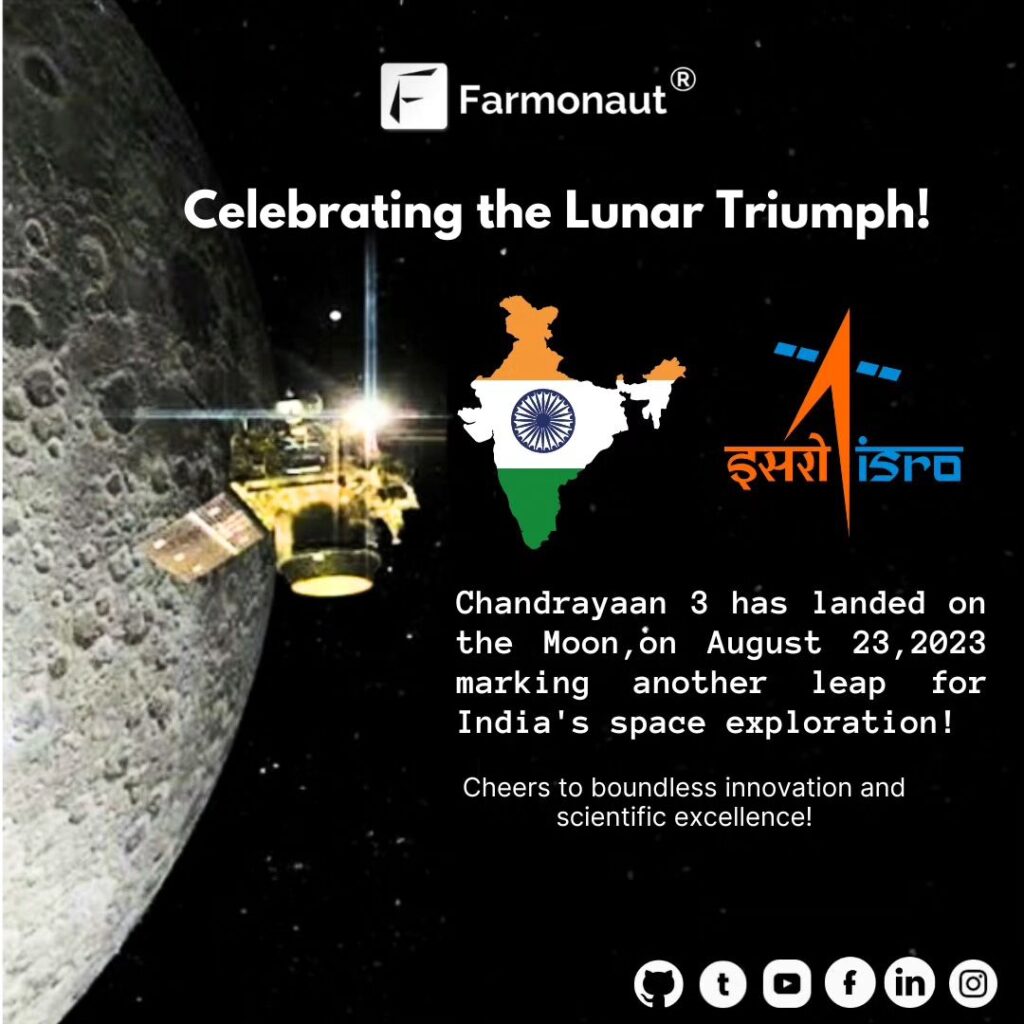
From Satellites to the Moon: ISRO’s Chandrayaan-3 Success and Its Impact on Earth Observation

Congratulations to ISRO – Indian Space Research Organization on the remarkable achievement of successfully landing Chandrayaan-3 in the south pole region of the Moon! This achievement marks another significant milestone in space exploration and demonstrates India’s dedication to advancing our understanding of the cosmos.

On behalf of Farmonaut®, We feel proud and applaud the hard work, ingenuity, and perseverance that went into making this mission a success. Your accomplishments inspire us all. Cheers, ISRO!

🚀🌕 #Chandrayaan3Success #ISRO #SpaceExploration #Moon #Farmonaut

Unlocking Soil Potential: Farmonaut’s SOC Imagery Revolutionizes Carbon Management in Agriculture

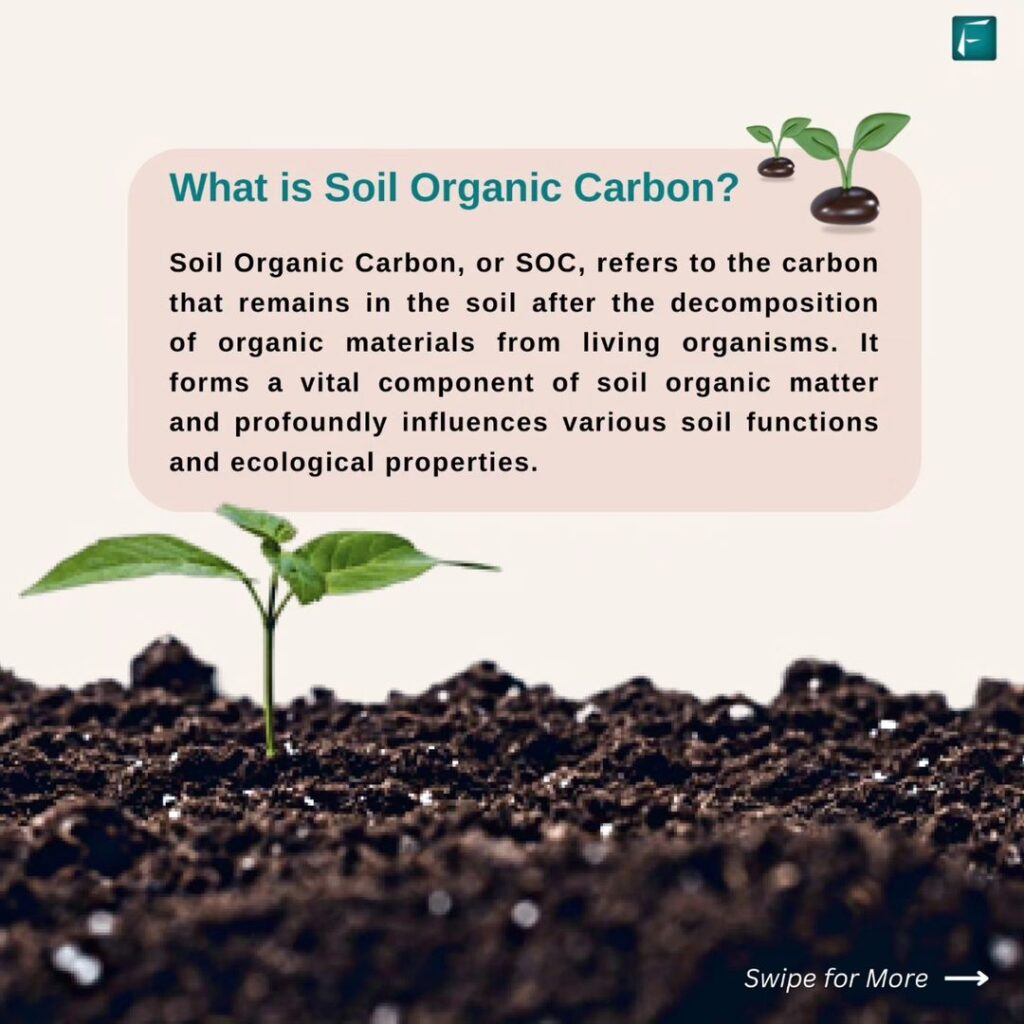
Visualizing SOC content on maps helps make informed decisions – from boosting carbon sequestration and productivity to promoting soil health and resilience. Now, farmers and carbon management experts can access crucial Soil Organic Carbon (SOC) imagery through Farmonaut®’s web platform, paving the way for informed decisions. 🌱📈

Imagine identifying high SOC content areas for enhanced carbon sequestration, increased productivity, and improved soil health. 🌿💡 Farmonaut® is driving innovation for a greener future. 🌱🌎

Learn more: https://lnkd.in/gYEkJkmD

🌱 #Farming #CarbonManagement #Sustainability #Agriculture #Innovation #SOC #OrganicCarbon #Farmonaut #FarmonautCommunity

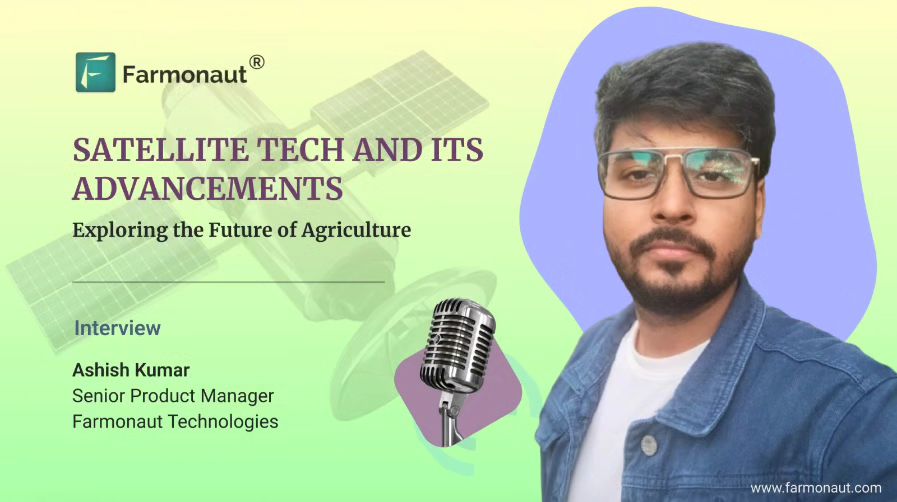
Revolutionizing Agriculture: Insights from Farmonaut’s Satellite Tech Expert Ashish Kumar

Check out our interview with Senior Product Manager, ASHISH KUMAR, who has deep-dived into the captivating realm of satellite technology and its revolutionary advancements in agriculture. 🚀

In this comprehensive interview, Ashish explores how satellite technology is reshaping the agricultural landscape, ushering in a new era of precision farming, and ultimately redefining the way we nourish our world. 🌍

Key Takeaways from the Interview:

1. 🌾 Precision Farming: Discover how satellites are enabling farmers to optimize crop management with pinpoint accuracy, from soil health assessments to crop monitoring and irrigation control.

2. 🚜 Increased Productivity: Learn about the ways in which satellite data is boosting crop yields and reducing resource wastage, leading to more sustainable and efficient farming practices.

3. 🌧️ Climate Resilience: Explore how satellites are helping farmers adapt to changing climate patterns by providing real-time weather data and predictive analytics.

4. ♻️ Sustainability: Dive into the role of satellite technology in promoting sustainable agriculture, reducing environmental impact, and supporting global food security.

5. 🌟 Future Prospects: Gain insights into the exciting possibilities on the horizon, including AI-driven data analytics, autonomous farming, and enhanced crop forecasting.

Read the full interview here: https://farmonaut.com/interview/farmonauts-satellite-tech-and-its-advancements-with-ashish-kumar/

Join the conversation and stay at the forefront of agricultural innovation! 🌾🌐

#Agriculture #SatelliteTechnology #PrecisionFarming #FutureOfAgriculture #Innovation #FarmingTech #AgTech #Farmonaut #Interview #TechnologyAdvancements #SustainableAgriculture #Agribusiness #AgribusinessSolutions #ClimateResilience #Farmers #FoodSecurity #AIinAgriculture #EnvironmentalSustainability #CropManagement

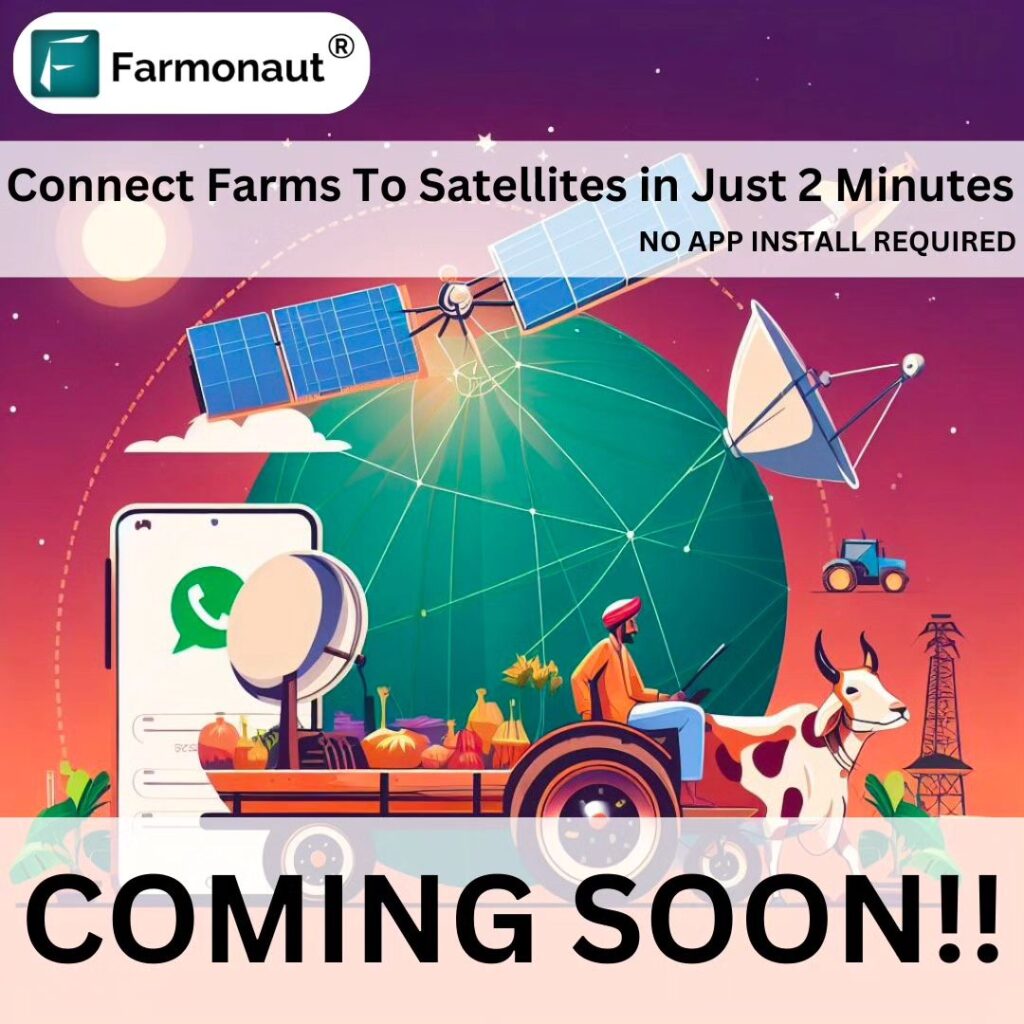
Revolutionizing Agriculture: Farmonaut’s Game-Changing Satellite Reports in 2 Minutes Flat!

We’re thrilled to announce that something BIG is coming soon from Farmonaut!

🔍 Get ready for:
🌾 Instant, hassle-free satellite-based farm reports!
🏡 No app installation needed – all from the comfort of your home!
🌎 Multi-language support for your convenience!
🚀 Lightning-fast from mapping to report, all in just 2 minutes!

Stay tuned for the official reveal, and get ready to elevate your farming experience to a whole new level. The future of farming is almost here, and it’s going to be AMAZING! 🌱🚜 #Farmonaut #AgricultureInnovation #ComingSoon

WhatsApp Your Farm to Space: Farmonaut’s 2-Minute Revolution in Satellite Farm Mapping

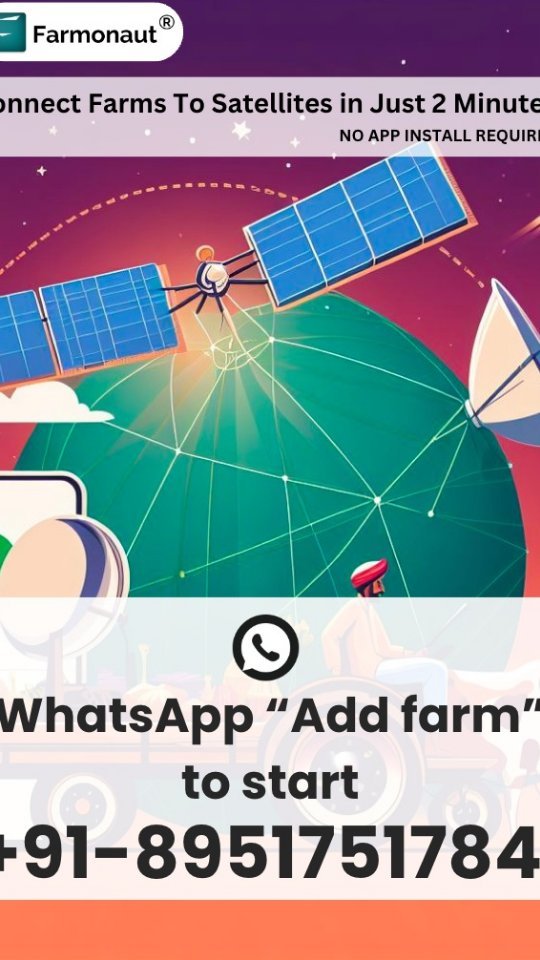
ANNOUNCEMENT! 🚀 Farmonaut is about to change the way farmers manage their farms through satellites. 🛰️

Now, with our new system, farmers can map their farms using WhatsApp in just 2 minutes. Yes, you heard that right! In just 120 seconds, you’ll been able to connect your farm to satellites and have your very first farm intelligence report straight from space within next 1 minute. 🌱📡

This feature is super fast, supports multiple languages, requires no app installation, and is incredibly easy to use. All you have to do is drop a pin inside your farm, and our smart AI/ML system will do the rest – it’ll magically identify your farm’s boundaries. 📍🌾

We’ve been providing this solution for a few weeks now with our fellow farmonaut farmers, and they’re buzzing with excitement. 🌟 They love how simple and groundbreaking this solution is for managing their farms.

The process couldn’t be easier. Just send a WhatsApp message saying “Add Farm” to +91-8951751784, and our AI/ML system will handle the rest. 🤖🌍

Share this with as many farmers, startups, businesses, research organizations and agricultural stakeholder which may benefit from this system.

Happy Farming!

#FarmRevolution #SatelliteFarmMapping #EasyFarmManagement #FarmingInnovation #SpaceIntelligence #NoAppNeeded #FarmersUnite #SmartFarming #TechForAgriculture #SimplicityIsKey #FarmonautFarmers #GroundbreakingSolution #WhatsAppFarming #FastAndEfficient #AIFarmHelper #SatelliteMagic

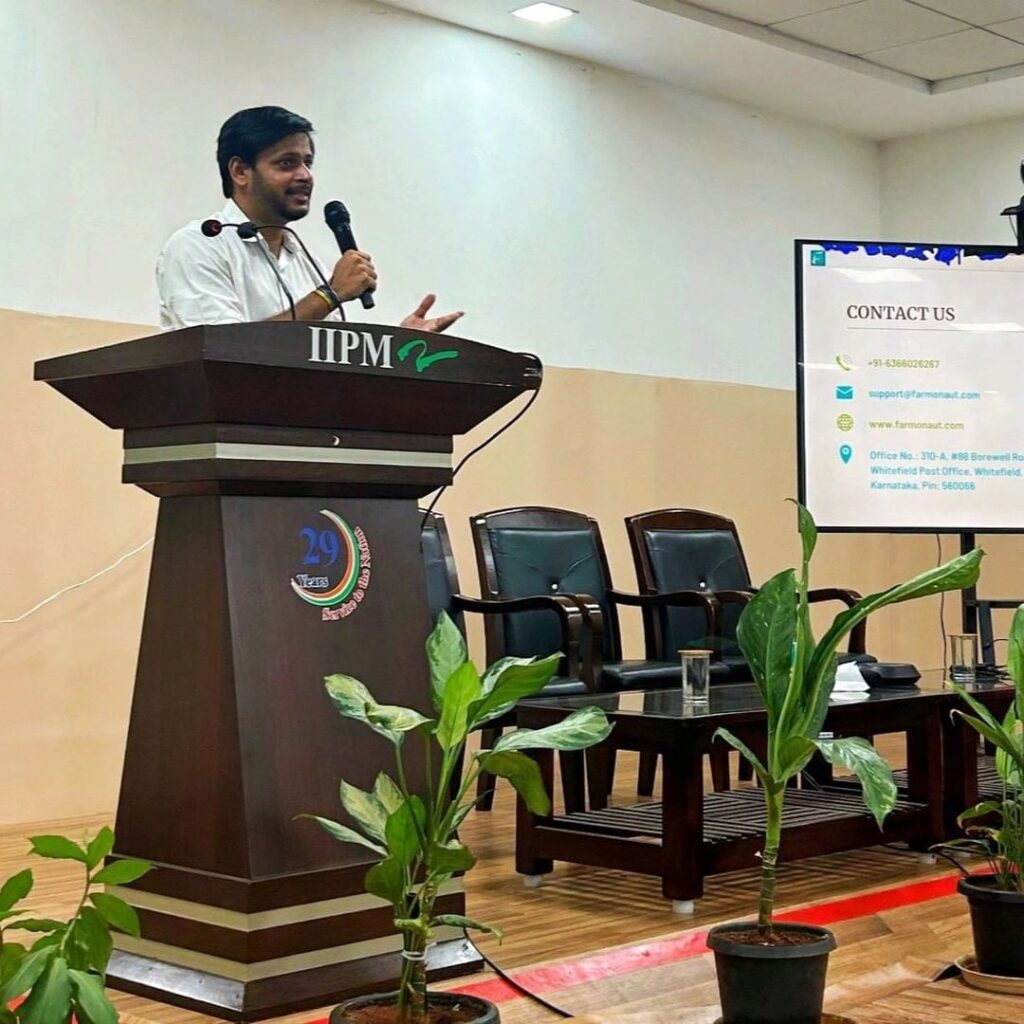
Revolutionizing Agriculture: Farmonaut CEO Shares Satellite AI Insights at IIPM Bengaluru

We are immensely #grateful to Indian Institute of Plantation Management Bengaluru – FPBM/AEBM/ABPM for the privilege of having our Director and CEO, Mr. @ankuromar Omar, as a speaker at your institution!

The session, centered around the #satellite #AI Toolkit for #agriculture excellence, highlighted the crucial integration of #remote #sensing #data in #precision agriculture for #sustainable #farming . The vibrant participation from the audience truly made the experience memorable.

Special thanks to Director Prof. Rakesh Mohan Joshi and Placement Executive Dr.Viju Samuel for their invaluable support, contributing to the success of the session.

It was a pleasure being part of Indian Institute of Plantation Management Bengaluru – FPBM/AEBM/ABPM ‘s event, and we look forward to more #opportunities to share insights and contribute to discussions on #agriculture and sustainable practices.

#Farmonaut #iipmb #agricultureexcellence #sustainableagriculture

Revolutionizing Agriculture: The Power of Vegetative and Productive Maps

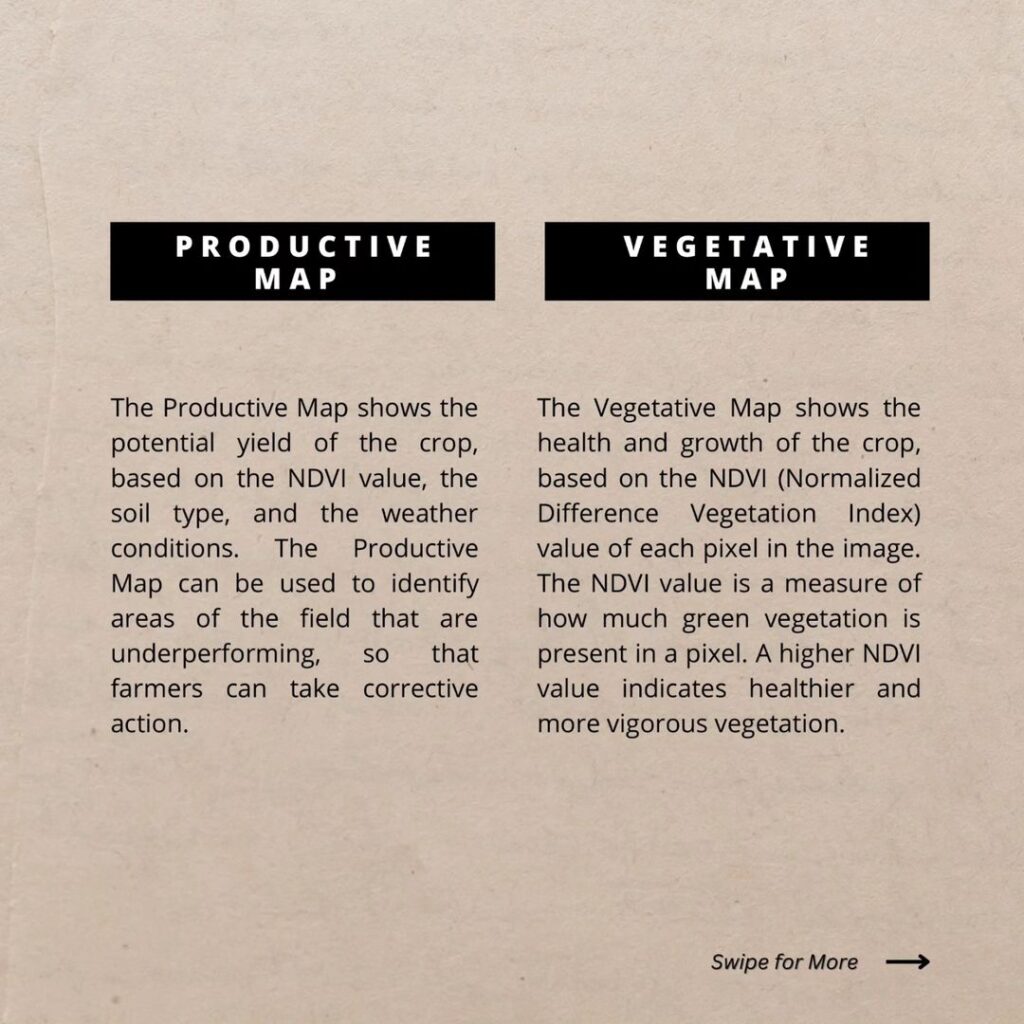
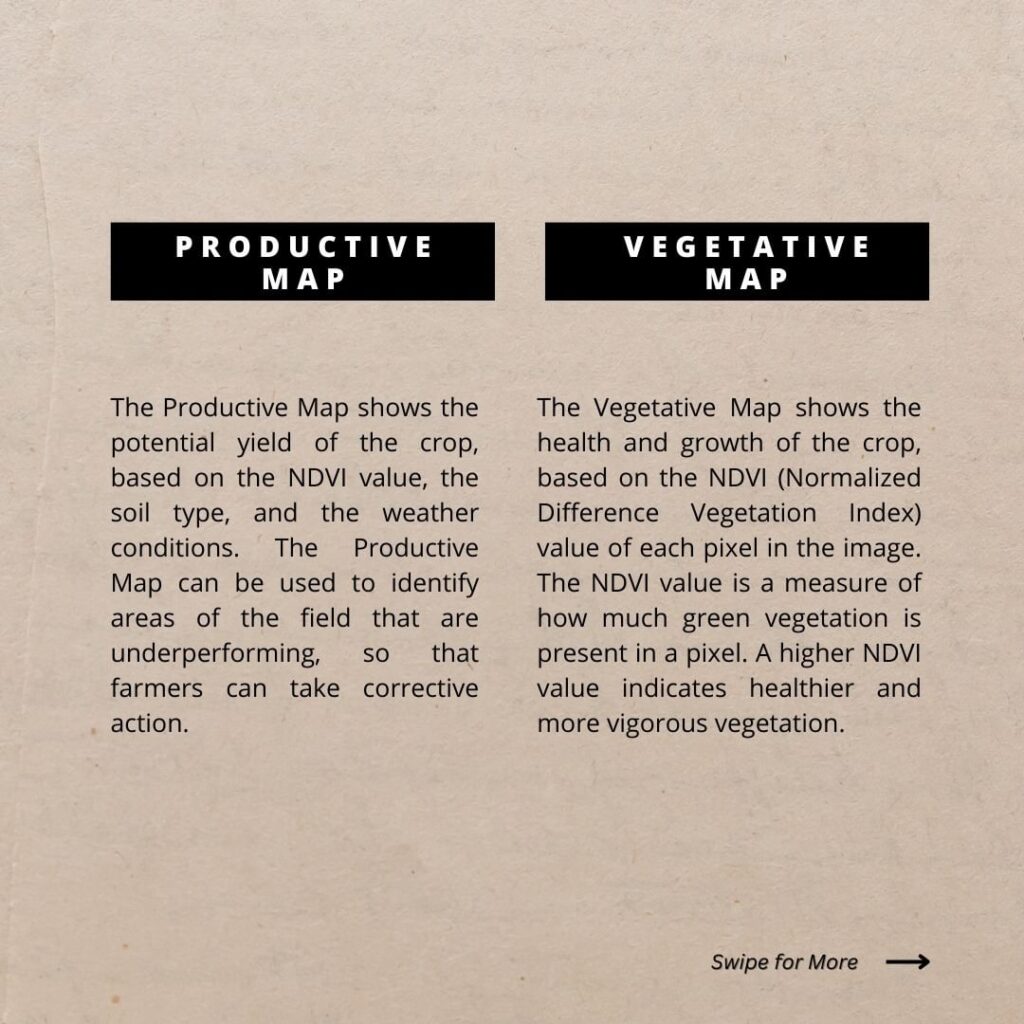
Precision #agriculture, powered by #technology, is elevating farming to unprecedented levels, with #satellite #imagery playing a pivotal role. @farmonaut ® offers advanced solutions for agri-businesses/farmers to make informed decisions using Vegetative and Productive Maps.

Productive Map: Imagine having a bird’s-eye view of your field’s yield potential – that’s precisely what a Productive Map provides. By analyzing #data from satellite imagery, this map assists #farmers in identifying varying productivity zones within their fields. It serves as a personalized guide for optimizing productivity in every corner of your land.

Vegetative Map: Think of this as a health report card for your crops. A Vegetative Map utilizes satellite imagery to evaluate plant growth, stress levels, and overall well-being. It offers real-time insights into your crops’ health, facilitating intelligent decision-making and timely interventions.

Differences between Vegetative and Productive Map:

Focus:

1. Vegetative Map: Concentrates on assessing the health and well-being of crops, including growth and stress levels.
2. Productive Map: Focuses on providing insights into varying productivity zones within the field.

Purpose:

1. Vegetative Map: Aids in understanding and managing the overall health of crops to ensure optimal growth.
2. Productive Map: Assists in optimizing #productivity by identifying areas with different yield potentials.

Information Provided:

1. Vegetative Map: Offers real-time data on plant conditions, enabling proactive measures to maintain crop health.
2. Productive Map: Highlights zones with differing productivity levels, guiding farmers in making strategic decisions for resource allocation.

Understanding these differences allows agri-businesses/farmers to leverage both maps synergistically for comprehensive farm management.

Revolutionizing Agriculture: How Farmonaut® Uses LULC for Sustainable Farming

Did you know that Farmonaut® is leveraging LULC (Land Use and Land Cover) to enhance sustainability in agriculture?

Through LULC insights, Farmonaut provides #farmers , #agribusinesses with valuable information on land utilization and natural features. This knowledge aids in making informed decisions about crop management, resource #optimization , and #conservation practices.

By integrating LULC data into #agricultural strategies, Farmonaut® contributes to a more #sustainable and efficient #farming #ecosystem.

Exciting strides are being made in harmonizing technology with nature for a greener tomorrow! Stay tuned for more updates.

#Farmonaut #LULC #SustainableAgriculture #AgTech #SmartFarming

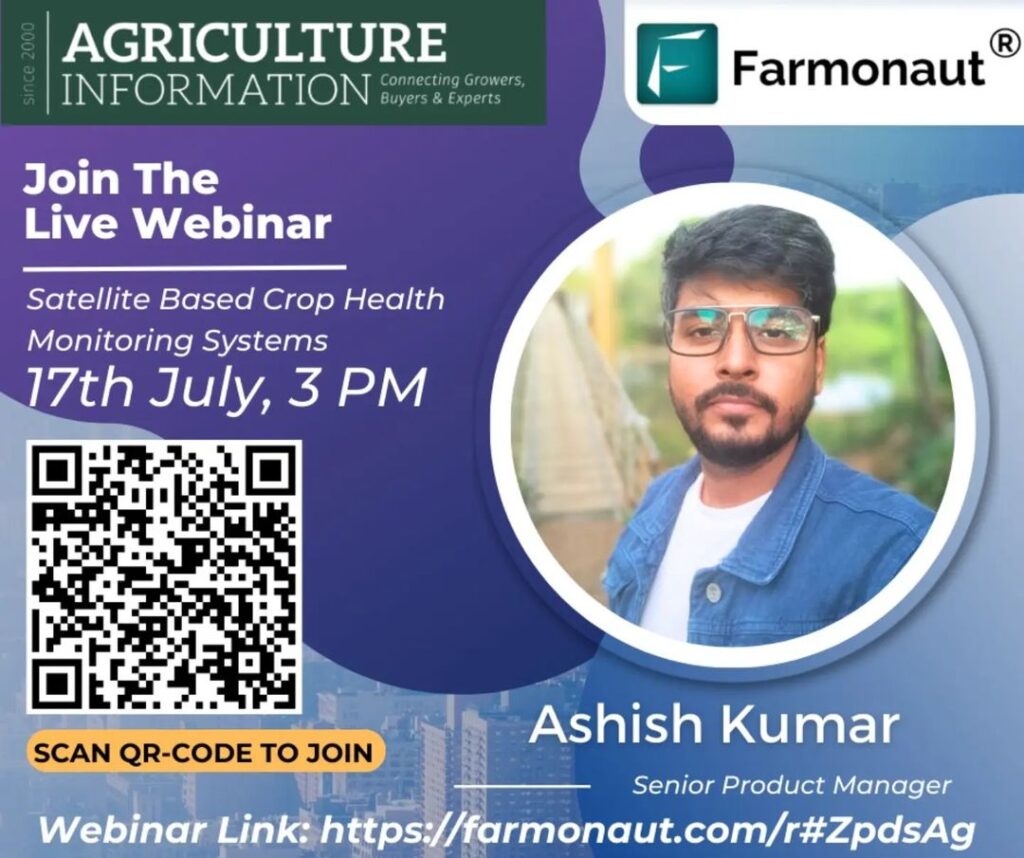
Revolutionizing Agriculture: Explore Satellite-Based Crop Health Monitoring in Farmonaut’s Live Webinar

📢 Join the Live Webinar Hosted by Agricultureinformation.com! 🌾🛰️

Topic: Satellite-Based Crop Health Monitoring Systems
🗓️ Date: 17th July
🕒 Time: 3 PM

In this session, Mr.ASHISH KUMAR, our Senior Product Manager, will delve into the innovative use of satellite technology in monitoring crop health. Learn how advanced satellite imagery and data analytics can transform agricultural practices by providing real-time insights into crop conditions, helping farmers make informed decisions, and ultimately boosting yield and sustainability.

Farmonaut® is at the forefront of agricultural technology, providing farmers with cutting-edge tools to monitor and manage their crops effectively. Our satellite-based solutions offer precise and actionable data, enabling farmers to detect issues early, optimize resource usage, and ensure healthy crop growth. We are dedicated to empowering farmers with technology that drives efficiency and sustainability in agriculture.

🔗 Webinar Link: https://lnkd.in/gCbPuWQT
You can ccan the QR Code as well to Join the webinar!

#Webinar #SatelliteTechnology #CropHealth #Farmonaut #AgricultureInnovation #AgTech #Farming #SustainableAgriculture #PrecisionFarming

From Space to Field: How Satellite Tech is Revolutionizing Farming on National Space Day

On this National Space Day, we’re celebrating the incredible technology that fuels our mission at Farmonaut! By leveraging advanced satellite data, we provide farmers with real-time insights into their crops, empowering them to make data-driven decisions for better yield, reduced costs, and sustainable farming practices. From monitoring crop health to optimizing resource use, our cutting-edge solutions are transforming agriculture, making it smarter and more efficient. The vast expanse of space isn’t just a frontier—it’s the foundation of our innovation!

#NationalSpaceDay #Farmonaut #AgriTech #SatelliteTechnology #PrecisionFarming #SustainableAgriculture #SpaceInnovation #TechInAgriculture #SmartFarming #DigitalFarming

Revolutionizing Crop Health Monitoring Using Remote Sensing: A Comprehensive Review of Farmonaut’s Web App

In the ever-evolving landscape of agriculture, crop health monitoring using remote sensing has emerged as a game-changing technology. Farmonaut’s web app for satellite monitoring stands at the forefront of this revolution, offering farmers and agricultural professionals a powerful tool to optimize their crop management practices. This review will delve into the features, benefits, and potential impact of Farmonaut’s platform on modern farming.

Enhancing Precision Agriculture: Farmonaut’s Impact on Boosting Sugarcane Yields

Introduction Sugarcane, a tall, perennial grass of the genus Saccharum, is primarily cultivated for sugar production. It is a robust tropical plant that contributes to about 70% of the world’s sugar production and has a great potential for biomass and biofuel production. It is the most important source of sugar production in India, with about 359 million tonnes produced annually. In the 2022-23 sugar season, approximately 360 million tons of sugar is anticipated to be procured by sugar mills. The Fair and Remunerative Price (FRP) for sugarcane, as approved for the same period, is Rs. 305 per quintal. The average sugarcane yield in India ranges from 80 to 100 tonnes per hectare. Uttar Pradesh leads as the highest sugarcane-producing state, followed by Maharashtra and Karnataka The current agriculture scenario in the sugarcane sector is rapidly evolving with the integration of satellite technology. Satellite-based monitoring systems enable efficient and effective monitoring of sugarcane plantations, allowing for the delineation of field boundaries, tracking of crop growth across vast areas, and monitoring of soil moisture levels. Challenges Affecting India’s Sugarcane Sector The sugarcane sector in India faces several challenges, including stagnating production, price regulations, unstable sugarcane market, and water scarcity. Some of the key challenges faced by the sector are: Stagnating Production: Sugarcane production in India has stagnated in the last 20 years, with farmers producing around 70 tonnes per hectare. By 2030, they will need to produce around 100-110 tonnes per hectare to meet the increasing demand for sugar. Price Regulations: Sugar, being an essential commodity, is controlled through various regulatory mechanisms in India, including minimum prices. However, the sugar price for consumers is not regulated, making sugar manufacturers vulnerable. Unstable Sugarcane Market: The unstable sugarcane market poses a significant challenge for the sector, as it affects the prices paid to farmers and the overall profitability of sugarcane cultivation. Water Scarcity: India is facing an increasing lack of water, which can impact crop yields and the overall sustainability of sugarcane cultivation. Low Yield of Sugarcane: Despite being the largest producer of sugarcane in the world, India’s yield per hectare is extremely low compared to some of the major sugarcane-producing countries. This leads to low overall production and results in a short supply of sugarcane to sugar mills Economic and Social Injustices: Sugarcane farmers in India are dealing with various economic and social injustices. A majority of those dependent on sugarcane farming are small and marginal farmers, and the cultivation of the crop is their primary source of income. These farmers are vulnerable to price fluctuations and face economic and social injustices Source: Indian Council of Agriculture Research Source: Indian Council of Agriculture Research Transforming the landscape of Precision Agriculture with Farmonaut Sugarcane farming in India faces numerous challenges, impacting both yield and sustainability. Thankfully, innovative solutions like Farmonaut can equip farmers with the tools and insights to overcome these hurdles and cultivate sweeter success. Let’s explore how Farmonaut can address key challenges in the sugarcane industry: 1. Fluctuating Sugar Prices: Market Intelligence: Farmonaut provides real-time market data and analysis, empowering farmers to make informed decisions about planting, harvesting, and selling their sugarcane based on anticipated price trends. 2. Water Scarcity: Precision Irrigation: Farmonaut leverages satellite imagery, soil moisture sensors, and weather data to recommend customized irrigation schedules, optimizing water usage and minimizing wastage. Drought-Resistant Varieties: The platform provides information on high-yielding, drought-resistant sugarcane varieties suitable for specific regions, helping farmers adapt to water scarcity. 3. Climate Change: Climate-Smart Practices: Farmonaut offers guidance on adopting climate-resilient practices like cover cropping, mulching, and integrated pest management, mitigating the impact of extreme weather events. Crop Monitoring: Satellite imagery and on-field sensors enable real-time crop health monitoring, allowing farmers to identify and address climate-related stresses promptly. 4. Pest and Disease Management: Targeted Application: The platform guides farmers in applying fertilizers, pesticides, and herbicides only where and when necessary, reducing the cost of inputs and environmental impact. 5. Yield Optimization: Data-Driven Insights: Farmonaut analyzes farm data to identify yield-limiting factors like soil deficiencies, inadequate irrigation, or pest infestations, guiding farmers towards corrective actions. Precision Agriculture: The platform recommends optimal planting densities, fertilizer application rates, and harvesting times based on specific field conditions, maximizing yield potential. Effective Methods for Managing Sugarcane Farm Losses: Case Study  Understanding the Impact on Production Loss A conducted study revealed that  50% of agricultural losses can be directly attributed to the deficiencies in water and nitrogen. Tamil Nadu Agricultural University (TNAU) reports that regions, including Tamil Nadu and nearby states, witness approximately 20% loss in sugarcane yield. TNAU additionally notes a 15% decrease in sugar yield, attributing the losses to insects like borers, sucking pests, and soil-dwelling insects..  The complexity of the problem deepens as the research identifies an extensive array of approximately 200 insect species affecting sugarcane. Optimize Operations with Farmonaut Management Farmonaut Technologies provides satellite-based services to help farmers manage their sugarcane farms more effectively. By utilizing satellite images and data, farmers can address issues such as water deficiency, pest and disease infestations, and declining yields. The technology allows for early detection of these problems, enabling farmers to take necessary actions to mitigate losses and improve crop health.  Additionally, Farmonaut’s services include crop health monitoring, water stress assessment, and crop area and yield estimation, all of which are crucial for optimizing farming practices and increasing yields.  The innovative technological interventions for sugarcane improvement, production, and management have helped the industry progress towards a more sustainable and self-reliant future. Exploring Success: Case Studies of Successful and Satisfied Farmer (Mr. Ashok Shinde : Shree Datta Shetkari Sahakari Sakhar Karkhana Ltd.) Mr. Ashok Shinde, a sugarcane farmer from Maharashtra, has effectively utilized Farmonaut Services to address irrigation challenges and monitor crop health. By leveraging NDMI, NDWI, and evapotranspiration data, he optimized his irrigation strategies, leading to improved yields.  The reports generated by Farmonaut Services also provided valuable insights into crop health, temperature, pests, and diseases, enabling Mr. Shinde to take proactive measures to control pest and disease intrusions.  In addition to addressing irrigation

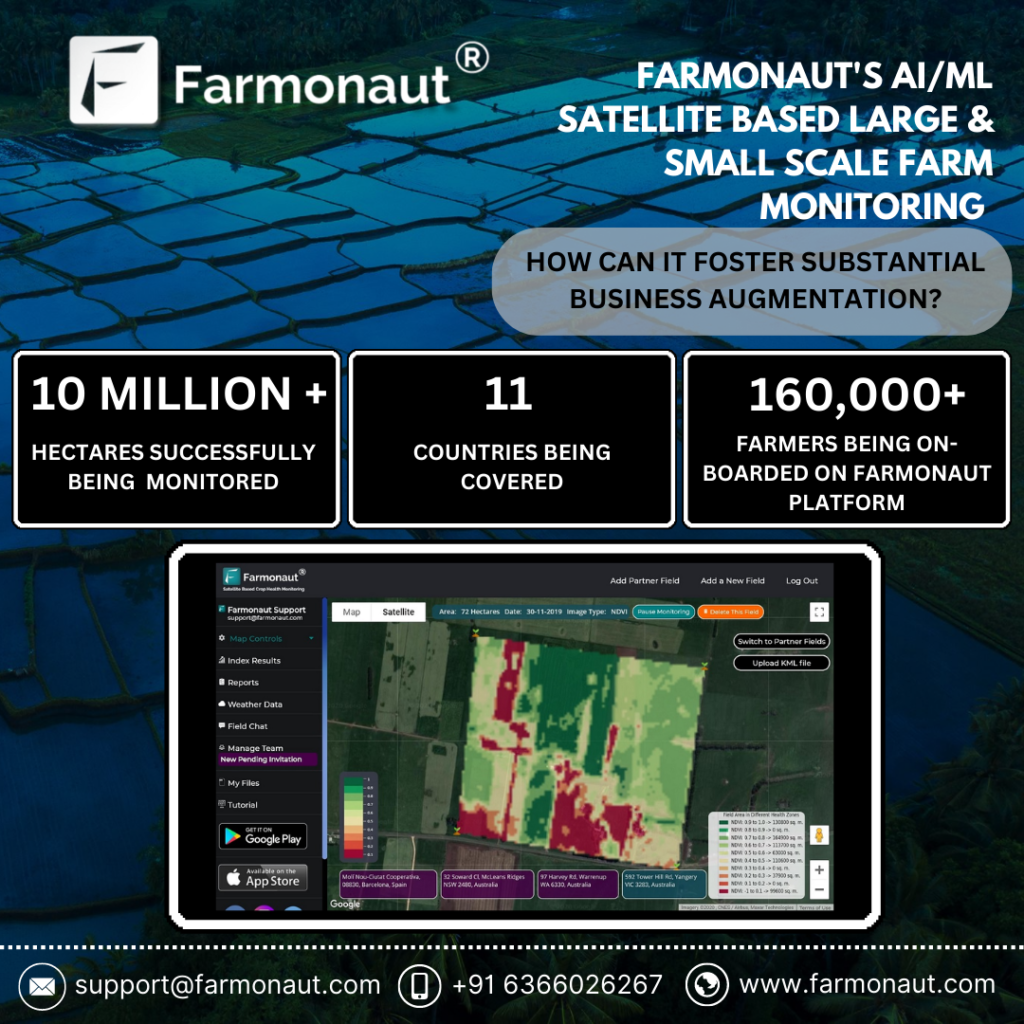
How can Farmonaut’s AI/ML Satellite-based Large Scale Farm and Small Scale Farm Monitoring serve businesses?

INTRODUCTION Agriculture is one of the world’s most important industries, providing food and fiber for billions of people. However, it is also one of the most challenging, due to the variability of weather, pests, and diseases. In recent years, there has been a growing interest in using artificial intelligence (AI) and machine learning (ML) to improve agricultural productivity. This is where Farmonaut uses AI and ML to monitor large and small scale farms. The company’s platform provides businesses with a variety of insights, including crop health, soil moisture, irrigation efficiency, evapotranspiration soil organic carbon and also provides different services such as crop area and yield estimation, radar data weather forecasting , land Use classification and plantation management FARMONAUT’S SATELLITE BASED CROP HEALTH MONITORING Farmonaut employs satellite-based crop health monitoring and utilizes remote sensing technology to gather crop data from space. This valuable information offers farmers and agricultural experts essential insights into crop growth, development, and overall health. COMPREHEND THE OPERATIONAL FEATURES Satellite-based crop health monitoring operates through a series of well-defined steps. Initially, advanced sensors on orbiting satellites capture imagery in both visible and infrared spectra, detecting variations in light reflectance that signify changes in vegetation health and crop parameters. Subsequently, Farmonaut’s system automatically processes and analyzes the satellite data using diverse algorithms and models. By integrating this information with weather data and soil samples, a comprehensive assessment of crop health and growth is obtained. The outcomes are presented to farmers and agricultural experts in visually appealing formats, including maps and other visualizations that highlight areas requiring attention or intervention. Additionally, Farmonaut offers easily downloadable reports available in over 50 languages. This valuable information guides decisions on irrigation, fertilization, pest control, and other aspects of crop management, ultimately leading to enhanced crop yield and improved quality. With the help Farmonaut, farmers have the flexibility to choose their fields and detect any areas with abnormal crop growth. Upon identifying such regions, farmers can visit the specific parts of their fields to assess the situation. If the issue has not yet manifested, farmers can proactively apply preventive measures like additional fertilizers or plant growth regulators. In case the problem has already emerged, they can seek assistance from Farmonaut’s crop issue identification system, which offers real-time government-approved remedies. To aid farmers in this process, our system presents two distinct sets of images. The first set of images provides insights into the crop health during the early stages of growth, while the second set focuses on the crop health in the later stages of growth. This targeted approach enables farmers to make well-informed decisions and take timely actions to safeguard their crops effectively. Farmonaut® Satellite Based Crop Health Monitoring – Explanatory Video Through the implementation of an automated crop monitoring service, farmers will receive regular crop health reports and vegetation water level reports derived from the most recent satellite imagery at intervals of 5 to 10 days. Additionally, they will be kept informed with near real-time weather updates relevant to their specific fields, sourced from the nearest weather station. Farmers have the convenience of monitoring multiple fields by including them in their profile. To ensure the technology’s efficacy for farmers, the satellite imagery is refreshed every 5 to 10 days, offering a resolution of 10 meters. For this service to be beneficial, a minimum land area of 2 hectares needs to be monitored. To put it in a nutshell, Farmonaut’s AI/ML satellite-based large-scale farm and small-scale farm monitoring represent a transformative force in modern agriculture. By utilizing the potential of advanced technologies, the company is empowering farmers to embrace data-driven decision-making, optimize resource utilization, and adopt sustainable practices. As the agricultural sector continues to evolve, businesses that make use of Farmonaut’s innovative solutions are poised to gain a competitive edge, reaping the benefits of enhanced productivity and profitability.

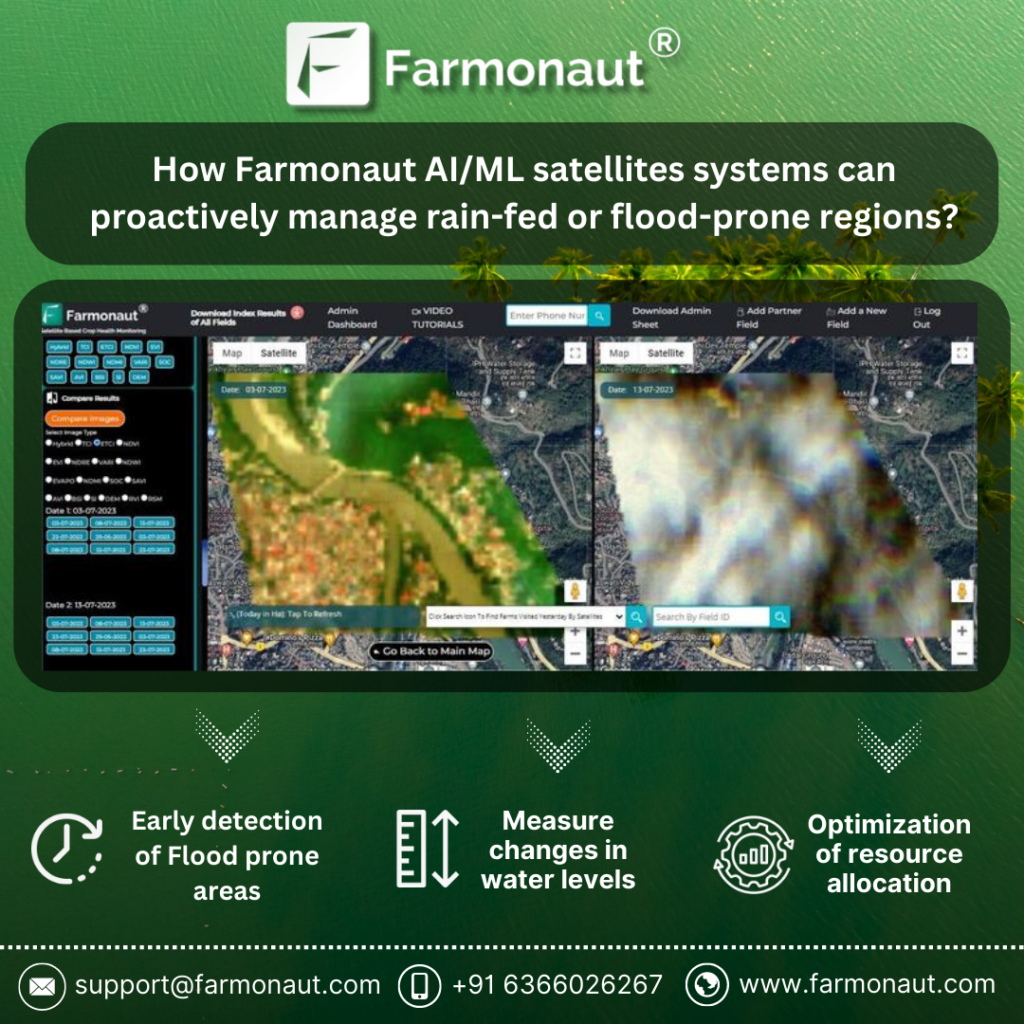
How Farmonaut AI/ML Satellites Systems Can Proactively Manage Rain-fed or Flood-prone Regions?

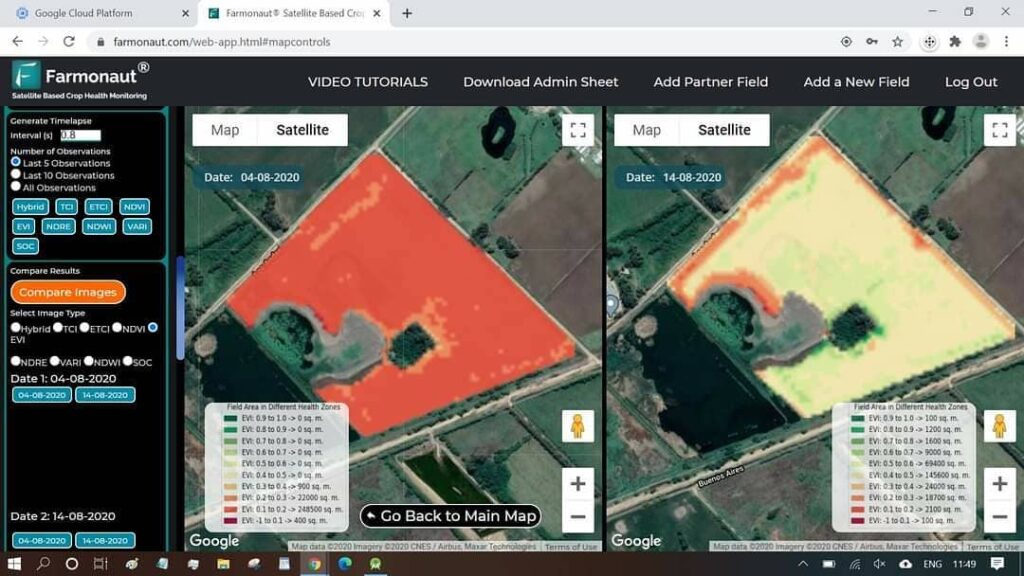
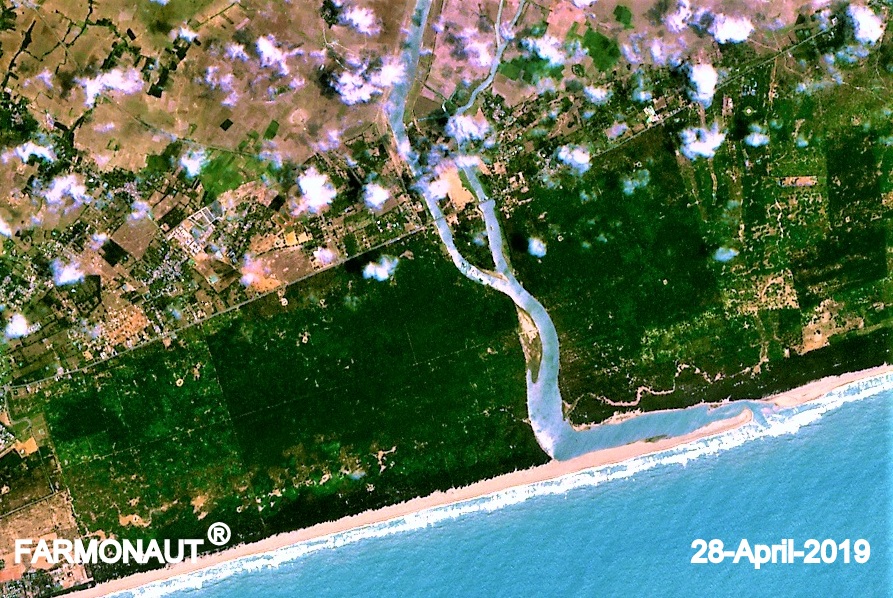
Floods are one of the most ubiquitous and pernicious natural calamities. They can wreak havoc on property and infrastructure, and even result in fatalities. In recent years, there has been a burgeoning interest in the use of AI. So the quest is Can AI/ML satellite technologies identify early indicators of floods and enhance flood management strategies? Let’s Find out ! Understanding AI/ML Satellites Systems AI/ML satellites are those systems that uses AI/ ML models to process and analyze data. This data can include images, videos, and other types of sensor data that can use this data to perform a variety of tasks. AI/ML  satellites systems integrate algorithms with advanced remote sensing capabilities, enabling them to analyze vast amounts of data collected from Earth’s surface. These satellites can process and interpret this data in real-time, providing valuable insights and actionable information.   How Farmonaut AI/ML satellite technologies can help? Farmonaut visualizes the capabilities of these satellite technologies in detecting early signs of floods in a number of ways. First, they can be used to monitor changes in land cover and vegetation. These changes can be an early warning sign of flooding, as they can indicate that the ground is becoming saturated with water. Second, Farmonaut system can be used to measure changes in water levels. This information can be used to track the progress of a flood and to predict when it is likely to reach a critical level. In addition to detecting early signs of floods, the satellite technologies can also be used to improve flood management strategies. For example, Farmonaut platform can be used to analyze satellite data to identify areas that are at risk of flooding. This information can be used to develop targeted flood mitigation strategies. Remote sensing data can also be used to optimize the allocation of resources during flood response operations. For example, this data can be used to identify areas that need to be evacuated, and to track the progress of rescue and relief efforts. What Farmonaut Brings Forth ? Farmonaut’s Satellite-based crop health monitoring primarily uses remote sensing technology to collect data on the health and condition of crops from space, providing individuals and organizations with valuable insights into the growth, development, and health of crops. Contemplating the early detection of floods, Farmonaut envisions a possibility to mitigate the occurrence of such unlikely natural disasters with the optimization of satellite data. Following are some of the perks of using Farmonaut’s remote sensing data for early detection of floods: Monitoring changes in land cover : Farmonaut uses highly efficient satellite imagery to monitor changes in land cover and vegetation. This data can be used to identify areas that are at risk of flooding, as well as to track the progress of a flood. Measuring changes in water levels: Farmonaut also uses high resolution satellite imagery to measure changes in water levels. This data can be used to track the progress of a flood and to predict when it is likely to reach a critical level. Provide insights into flood risk: Farmonaut can use its satellite data to provide insights into flood risk, such as the areas that are most likely to flood and the factors that contribute to flooding. This information can be used to develop targeted flood mitigation strategies. Optimizing the allocation of resources during flood response operations: Farmonaut’s data can also be used to optimize the allocation of resources during flood response operations. For example, Farmonaut’s data can be used to identify areas that need to be evacuated, and to track the progress of rescue and relief efforts. How Does Farmonaut Makes It Possible ? Farmonaut’s web app allows continuous monitoring of an area in case of unlikely events. The ‘Farm mapping’ option in the application permits the flood prone areas to be mapped and constantly receive insights about those regions. For example, if an individual is using Farmonaut to monitor their farm for flooding, they might see that the water levels in a nearby river are rising rapidly. This would be an indication that the region is at risk of flooding. In this way, people could then take steps to protect their crops and livestock, such as moving them to higher ground or evacuating them from the area. Further, the option ‘Request Historical Satellite Data’ under Map Controls section which lays the opportunity to acquire data of any previous dates. In addition the ‘ Compare Images’ option in the Map Controls provides the images of two different dates and allows you to analyze the overall difference between both.  This option was used by Farmonaut in analyzing the various in the land cover and rise in water level during the 2023 North Indian floods.  Find below the differences between the satellite images of the Manali region before and after the floods in July 2023. Farmonaut’s Case Study : Cyclone Fani , May 2019 In May 2019, Farmonaut conducted a study on the Cyclone Fani, which inflicted severe damage on several east coast states of India, causing significant damage to the Balukhand-Konark Wildlife Sanctuary in Odisha. The impact of the cyclone resulted in the complete devastation of vegetation in the area. Additionally, the cyclone’s aftermath led to the disappearance of over 4000 spotted deer. In response to this disaster, a comprehensive analysis was conducted to explore the practicality of utilizing remote sensing techniques to optimize rescue efforts during such calamities.  Therefore,  the AI/ML systems hold immense potential in transforming flood detection and management strategies. Farmonaut’s remote sensing data services play a crucial role in providing accurate and timely information, empowering authorities and communities to make informed decisions and take proactive measures against floods. We are committed to working with our customers to help them to use these technologies to save lives and property.

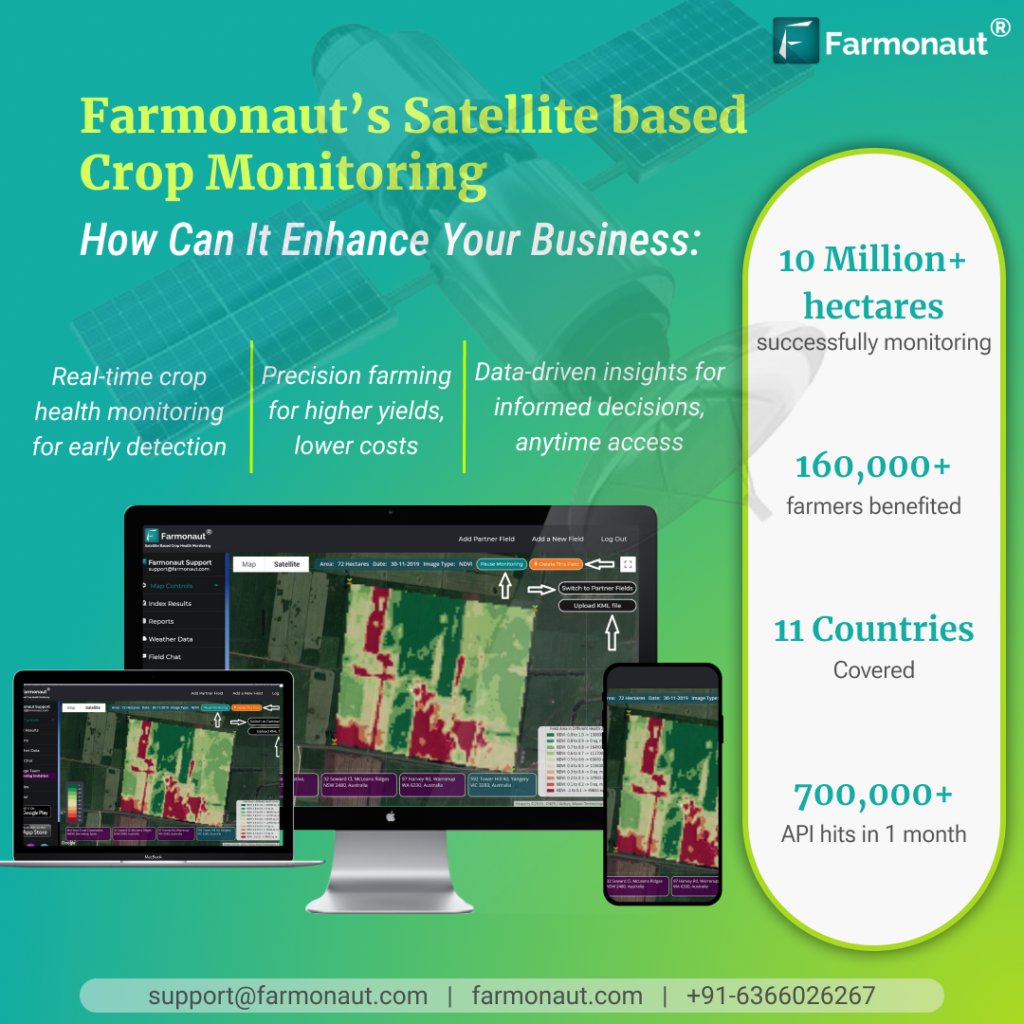
Farmonaut’s Satellite based Crop Monitoring: How can it enhance your business?

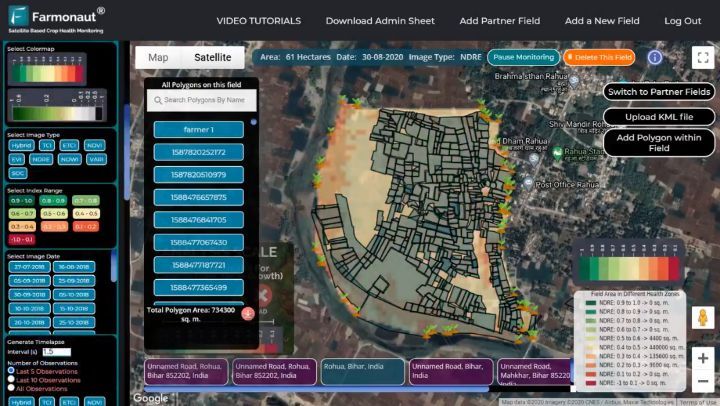
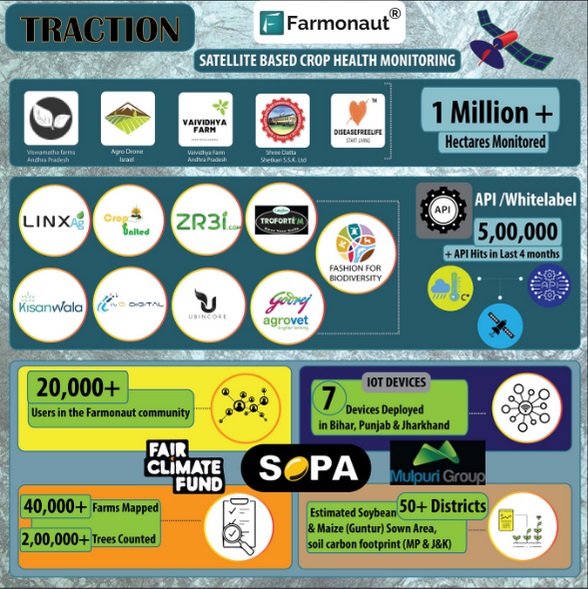
Farmonaut’s Satellite based Crop Monitoring: Optimizes farming with satellite data insights Farmonaut’s satellite-based crop monitoring employs remote sensing data for real-time insights on crop health and growth. This precision farming approach optimizes resource usage detects early stress and diseases enables informed decisions to boost productivity Start Now Unique Proposition We provide you with real-time crop health monitoring for early detection of issues. Coverage Our satellite gives high resolution imagery upto 10m resolution. Optimizes Our technology will optimize your way of farming and save your resources up to 10-30%. Crop Health Monitoring to enhance yield: Farmonaut’s satellite-based crop monitoring offers real-time insights into crop health, allowing businesses to detect potential issues at an early stage. Through instant alerts and data analysis, farmers can identify signs of stress, diseases, or nutrient deficiencies. Early detection enables prompt action, preventing further damage and increasing overall yields. By closely monitoring their crops’ health, farmers can respond quickly to changing conditions and implement targeted interventions to ensure optimal growth and productivity. Saves 10-35% on crop losses For Precision farming and resource optimization to boost yields and reduce costs: Precision farming is revolutionizing agriculture, and Farmonaut’s satellite-based monitoring plays a crucial role in optimizing resource usage. By analyzing remote sensing data, the app provides detailed information on crop health variability across the field. Armed with this knowledge, farmers can make informed decisions on resource allocation, applying water, fertilizers, and pesticides precisely where and when needed. This targeted approach minimizes resource wastage, reduces operational costs, and maximizes yields, ultimately leading to more sustainable and profitable farming practices. Saves 10-25% on farm inputs For Data-Driven Insights & Remote Accessibility: Farmonaut’s app provides powerful data-driven insights for informed decision-making in modern agriculture. By analyzing historical crop performance data and satellite imagery, farmers can identify trends and make strategic choices on crop selection, rotation, and farming practices. Additionally, the app offers remote accessibility, allowing farmers to access real-time data and updates from anywhere via web and mobile platforms. This flexibility enables timely responses to critical situations and ensures constant monitoring for successful outcomes. 10 Million+ hectares successfully monitoring 160,000+ farmers benefited 11 Countries Covered 700,000+ API hits in 1 Month [email protected]      |      farmonaut.com        |      +91-6366026267

Farmonaut | SOLVING FARMING PROBLEMS USING SATELLITE DRIVEN TECHNOLOGY IN UZBEKISTAN

Problem #1: Inefficiency due to human factors. Problem arises when the Company doesn’t receive yield as per the efforts and investment made by them. Due to various human factors throughout the chain the estimated yield is not received by the company. Solution: By providing satellite data to monitor farms at different levels. Farmonaut has provided satellite data to reduce the human errors at different levels such as clusters, region and farmer level. The various satellite parameters help to track consistent actions taken on the field which examines the inefficiencies. Problem #2: Burdensome Machinery Management at large scale. The management issues caused are also due to human malfunction. Company’s Unawareness regarding the usage of machinery creates chaos which leads to loss in the capital invested by the company. Solution: By Tracking each and every machinery through GPS for various data. GPS trackers help to capture data every 10 secs and pass on to the systems. Hence, the data captured can be used for multiple benefits such as performance evaluation, to know oil usage, work done, capacity of machinery, etc. PROBLEMS & SOLUTIONS Farmonaut has been providing solutions to farmers and businesses at large scale to solve different problems faced in the agriculture sector. We have managed to monitor over 10 million hectares of land world-wide and mapped over 1 lakh farms globally benefiting more than 50,000 farmers. We are also working with 25+ large scale businesses including Coromandel International, Torforte Innovation based in Australia, Zr3i.com in Egypt, ITC, Godrej Agrovet, Mulpuri Group and many more. ABOUT US Satellite data captured are being processed and segregated by the Farmonaut system which makes them easy to understand. Monitoring large numbers of farms can be inaccurate and tedious. The Farmonaut system captures the data and generates reports according to the clusters. The dashboard, data and reports can be obtained in Uzbek language which makes it more convenient for the locals. WHY FARMONAUT..??? SATELLITE BASED CROP HEALTH MONITORING: It is a technique which helps companies to manage and organize their vehicles. In order to manage machinery Farmonaut provides a system which monitors and tracks each and every machinery. How does it work? GPS devices are installed on each and every machinery of TTG. The devices are connected to Farmonaut’s servers. The data is captured by devices and it is received on the server every 10 seconds. There are many different parameters that are captured by the devices such as Coordinates (Latitude Longitude), Speed, Angle, Stopped or Working, oil container is open or not, etc. FLEET MANAGEMENT Field mapping Mapping of farms at large scale can be done with ease and accurately. Soil carbon content Soil carbon content tracking for better yield and knowing status of necessary actions taken in the soil. Satellite based soil health monitoring Timely data on diseases and pests would help n tracking whether the required inputs have been given or not. Crop area estimation It can be helpful to know the areas under which crop is sown and make decisions on contract farming regarding capital and machinery. Identifying location requiring irrigation Helps to know the location where irrigation is required and track the actions taken by farmers. FEATURES  USE Interface to plan jobs for machine based on needs Can get an expertised driver for a particular region. Helps in job management effectively Choose accessories for a particular machine. Can pick equipment as per pocket allowance and based on requirement. Interface for performance tracking based on machine type. Helps in inventory management, market predictions and knowing future requirements. Dashboard in Uzbek Language anyone can easily understand. Assigning team member for each machine Can evaluate performance in different work domains. Estimation of machine capacity. Helps in overall performance and requirements for long run viability. Generated cumulative data Helps in estimation of optimal machine performance. Day-to-day data entry datasets Know underperforming machines Helps in comparison of planned and actual work Booking machines by our farmers by Android Easy to book. Introducing payment plans or accounts Helps in account management of organization See performance of clusters and individual machines. Helps in evaluating performance at macro level for resource allocation and tackle unforeseen situations. Fuel consumption monitoring Stops any false reporting or incorrect strategies used by humans. Advanced features provided as well as proposed by Farmonaut for Fleet management: The motion tracking feature and the parameters tracked helps to create insights/visualization of the machinery used on the dashboard as follows: Track real-time location of farm machine updated every 10 seconds. Track total distance covered by machine on a given day. Track total number of hours machine was running. Track current speed, maximum speed and average speed of machine. Track number of farms visited on a particular day. Track the amount of time spent by machine on each farm. Track entry time and exit time of the farm machine on each farm it visited. Track area of each individual farm. Time lapse feature backtracks the path machine travelled through. Maintain an accounting record of each field at which machine went. Access to the historical data of the machine. GPS devices work on any power operated machines. Home location fencing. Maintenance records of all vehicles and accessories with its expenses. Helps to know market trends and identify problem areas. Monitor driver attendance and work performance Helps in effective management of payroll and manage schedules. SERVICES CARRIED OUT FOR TTG For the month of July and August in 2022 for cotton farming, Farmonaut has mapped and monitored 8800 farms contributing to over 2 lakh+ hectares of land. The reports for which were generated through satellite visits every 5 days. Around 12 reports were generated throughout the period of 2 months which were in English and Uzbek language. Farmonaut has also created a custom account for TTG on the Farmonaut’s platform for access of the data throughout the period. Farmonaut has also created a customized page to access the report in infographics format as shown below. Dashboard in English Language Dashboard The dashboard is provided in the Uzbek and English

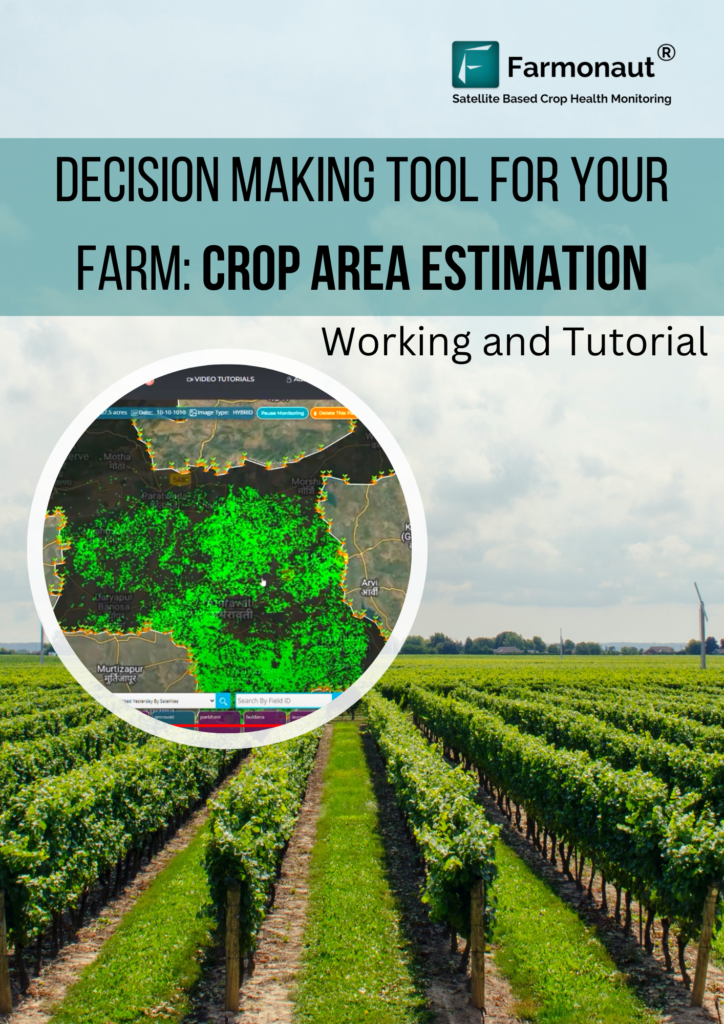
Farmonaut | How To Use Farmonaut Crop Area Estimation Tool

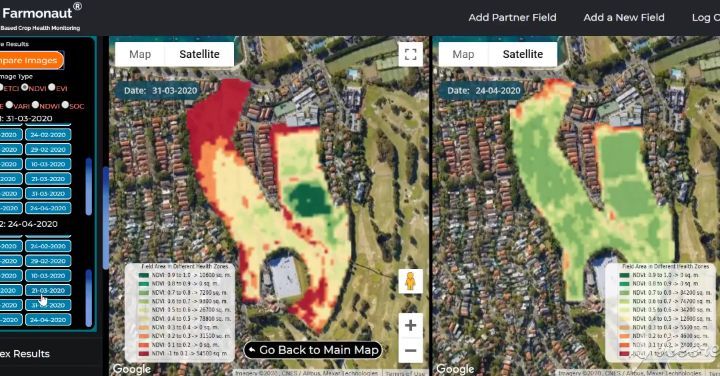
Crop classification helps to know which crops are grown in which areas. The estimation of agricultural production is necessary for decisions to be made. The crop area estimation allows the farmers to predict or calculate the tonnage of the particular crop. Identifying the specific crop grown at different village level, taluka level, district level and state level can be done. The estimation and identification of the crops could be useful in many ways: Deciding agricultural policies. Planning supply chain management. Making decisions on procurement, storage and distribution. Adjusting effective food prices. Allocation of resources. Identify the purpose of the vegetation such as food, feed and fiber. Can help in controlling water usage. How does it work? In order to identify a particular crop or vegetation the model requires few sample images to train the model for classification. How the classification model works can be explained as follows with an example. # Training data and classes are needed: For example, if an area is sown with paddy the model must know the crop that has to be classified. The class must be paddy in this case. # Sample data: In order to train the model few sample locations are needed. The sample location helps the satellite to create wavelength and identify the crop. Hence helps to know the crop cycle and the changes taking place during every satellite visit. Marking locations is known as Ground Truthing. # Study images of location: In order to predict, the unknown study area location must be added which identifies whether the class mentioned is expected in which area. For example, which locations are expected to have rice and which areas do not expect rice. Problematic area The working of the crop area estimation manually creates many problem in the process such as Requires more time. Resources are required in a high amount such as labor. Cost increases. Accuracy gets compromised. What does Farmonaut provide? Farmonaut is providing Crop Area Estimation to deal with the problem caused due to the manual estimation. It helps to predict accurately and precisely the crop classification. How to access data? Once you login to your Farmonaut account. On the Farmonaut platform the Crop Area Estimation panel is added by which you can access it. By clicking on the “Crop Area Estimation”, DashBoard opens. Dashboard contains all the paid and unpaid area Estimations which are added by you as shown in the image. To add new crop: The Dashboard has a button on the top right corner, “Add New Crop”. Click on it. A dialog box opens where you have to enter information as Crop Name: Select crop you want the data for. Study Year: Select year for which you want to have classification for. Can be done for past years. Sowing Date: The date the crop was sown as it can be different in different states and countries. Harvest Date: The Expected harvest date of the crop. Total Area: the area in which the crop is sown. Country: The country in which the farm is located. Contact Number: Your contact number for future useful deeds. After the information is entered. Click on “Submit”. A dialog box will appear for the Payment stating the amount to be paid. Click on the “Pay” button to complete the payment. In case of large areas, it suggests a request and hence the Farmonaut team will contact you. Also email and contact number are provided in case you want to contact our team. And then click on the “Submit Requirement” button. Ground Truthing In order to classify the crop, the system needs few locations on which the crop is shown, known as ground truthing. It can be done through web or mobile applications. How to do Ground truthing? Step 1: Login with the ground truthing email and ground truthing password provided on the dashboard for a particular crop request on Farmonaut platform. Step 2: Select atleast 20 locations on the field to train the model. Study Location: Locations for which you want the classification are to be given. For which following steps are to be followed: Step 1: Login on the Farmonaut platform using Study Email and Study Password provided on the Dashboard. Step 2: Select the study area by adding a new field. Step 3: Submit location for which you want classification done. On submitting all the information, the Farmonaut system will study the information and process it for the crop classification. The results will be then sent to the farmers on Email. Also, you can check the data on the study email account.

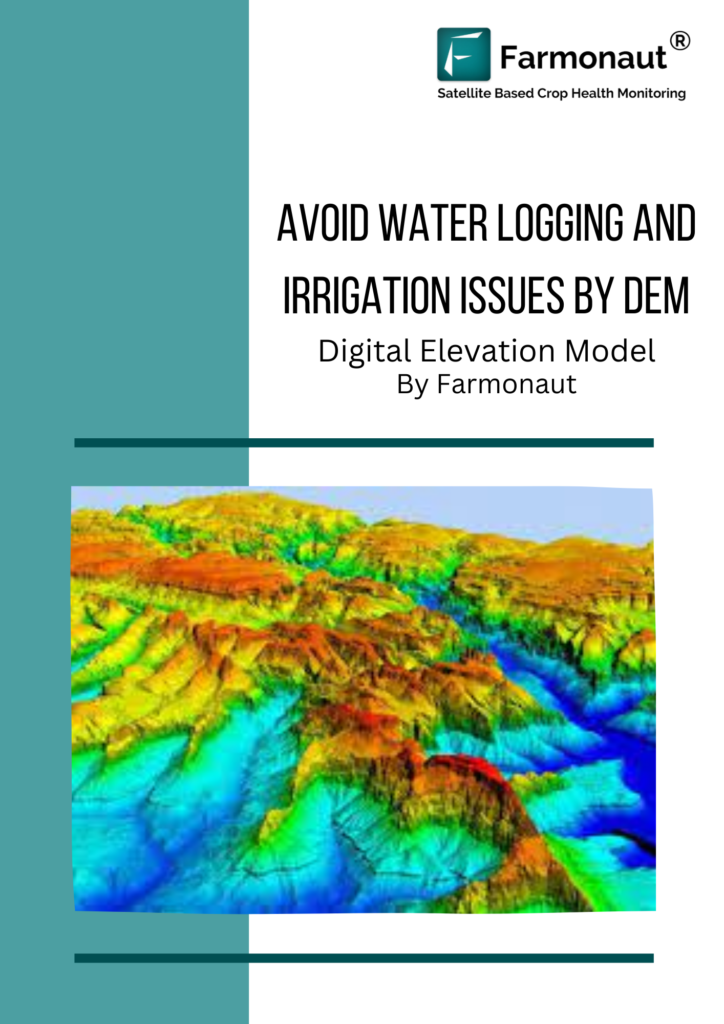
Farmonaut | Avoid Waterlogging and Irrigation Issues Using DEM

DEM (Digital Elevation Model) All fields/farms are not of the same elevation, with different fields lying on different slopes it requires to know the slope. DEM helps in representation of elevation data to depict the terrains. It represents the bare ground of the earth by eliminating the trees, buildings and any such other objects. Hence, the elevation would be accurate according to the needs of the user by using DEM. Problems Due to excessive rainfall or intensive irrigation in various areas, the water logging in the terrain leads to the damage of crops. Elevation in the farms clogs the water at the low terrain areas and hence creates issues such as soil erosion, soil degradation, etc. To get an idea of the terrain regions of the farmland Farmonaut has been providing DEM satellite data for avoiding such issues caused by elevation. Solution provided by Farmonaut Farmonaut technologies is providing satellite data to all the farmers for knowing their farm crops better and helping them handle it. DEM data are also provided by farmonaut which are easy to analyze and interpret for your farms. The farmers can have a look at the DEM image of their farm in different color codes which is analyzed using the analysis scale which represents the low terrain and high terrain region. Knowing the terrain at different areas on the farm, the farmer can take precautions for the water logging conditions that may occur such as building temporary water drain passage or any other water removal mechanism. How to Access the DEM image? Step 1: Login to your account on the Farmonaut application. Step 2: Select the farm you want the satellite image for. Step 3: Click on the DEM button under the image for topography. Step 4: the DEM image will be displayed on the farm you selected. Step 5: Interpret the image using the analysis scale provided below the farm. Shown in figure below.

Farmonaut | Manage Your Farms From Sowing to Harvesting | Guide to Colormaps

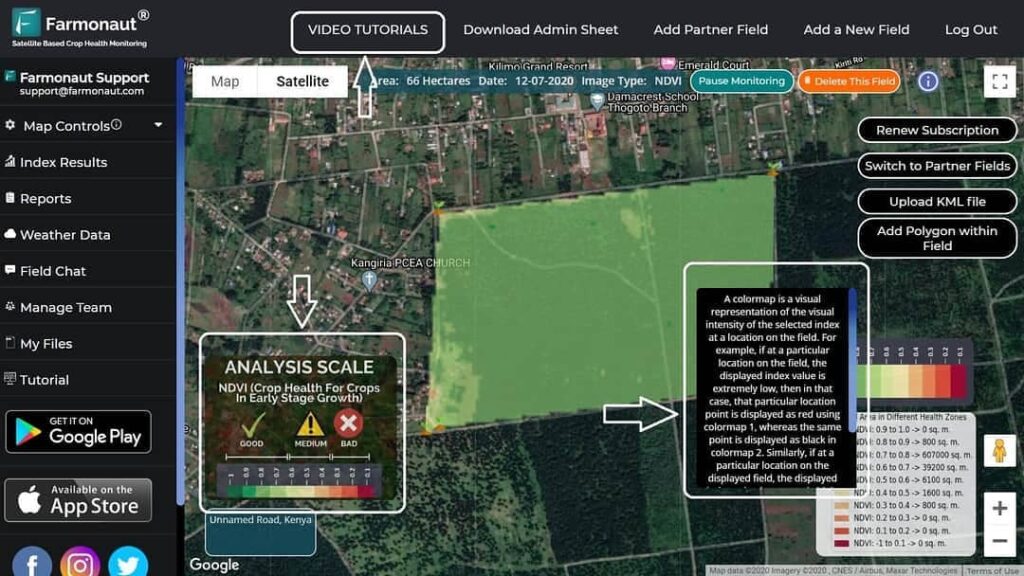
Satellite data obtained for the vegetation are based on what actually has been seen. For example, for the land which is sown, the soil is exposed to the satellite and based on which the satellite images are generated. Similarly the height of the vegetation also plays an important role in knowing the crop health and condition. Interpretation of such data requires different color coding or analysis. The accuracy of crop health will help farmers in managing their farms better. Problem: Vegetation at an early stage seems like the soil is more exposed to the satellite and hence the indices obtained would be based on the default analysis scale. However for taller vegetation the data images obtained are much more accurate. The issues faced at an early stage of vegetation would not be recognised and hence the decision to be made would be unidentified. To clear such circumstances Farmonaut has introduced 2 types of colormap. Colormap Colormaps helps to recognised the condition of vegetation at early stages.The two kinds of colomaps are: Colormap 1: It ranges from 0.1 to 1. It can also be called as the default color map which is shown at first for all indices. Its color ranges from green to red stating green as good vegetation and red as danger. The color map is as shown in the figure below. Colormap 2: It ranges from -1 to 1. It is basically used for the early growth stages or for low heighted vegetation. The color ranges from different shades of green. It is recommended to use colormap 2 during the early growth stages. The colormap 2 is shown in the figure below. The colormap 2 states the accuracy and sensitivity of the crops. The color map 1 range 0.1 to 0.2 is magnified and shown as the colormap 2 in different shades of green. When a whole farmland is sown on a particular day still there may be growth issues in some areas which cannot be identified with the colormap 1 and hence colormap 2 can be used. However, the colormaps are available for NDVI, NDRE, NDMI, NDWI, SAVI, EVI, VARI and RVI. The colormaps are not required for the TCI, ETCI, Hybrid image, DEM and Colorblind Visualization. How to Access Color maps? Step 1: Login to your account on the Farmonaut application. Step 2: Select the field you have sown recently or it at an early growth stage. Step 3: Select the image you want such as NDVI. Step 4: Click on the colormap 1 or 2 as per the vegetation. Step 5: Analyze the image shown as per the scale.

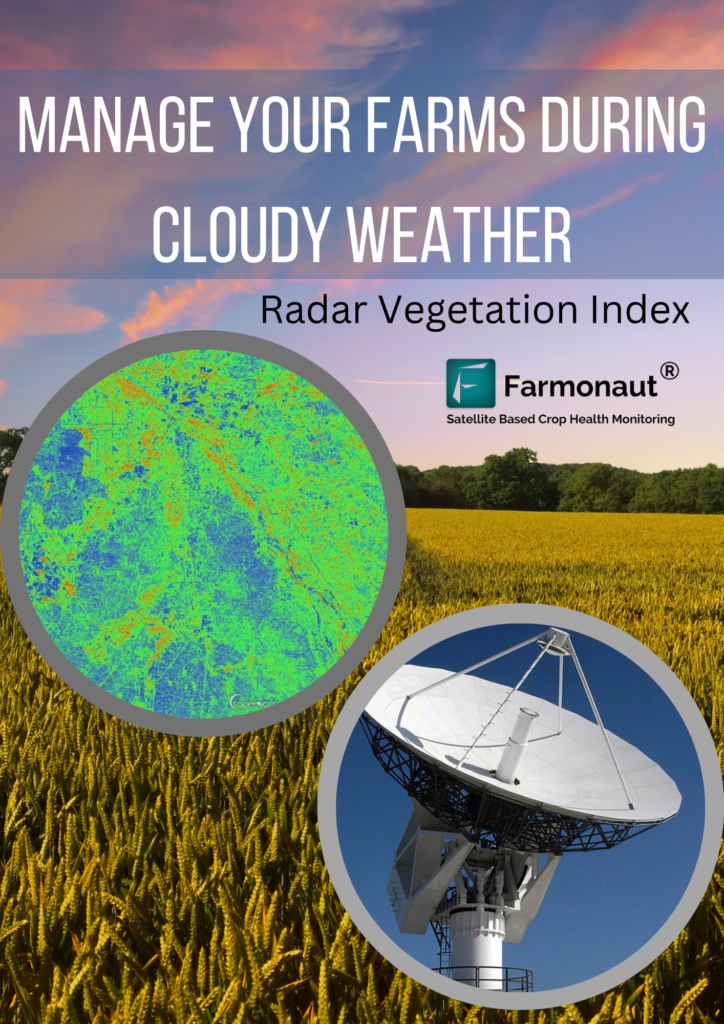
Farmonaut | Manage Your Farms Through Satellite Data During Cloudy Weather

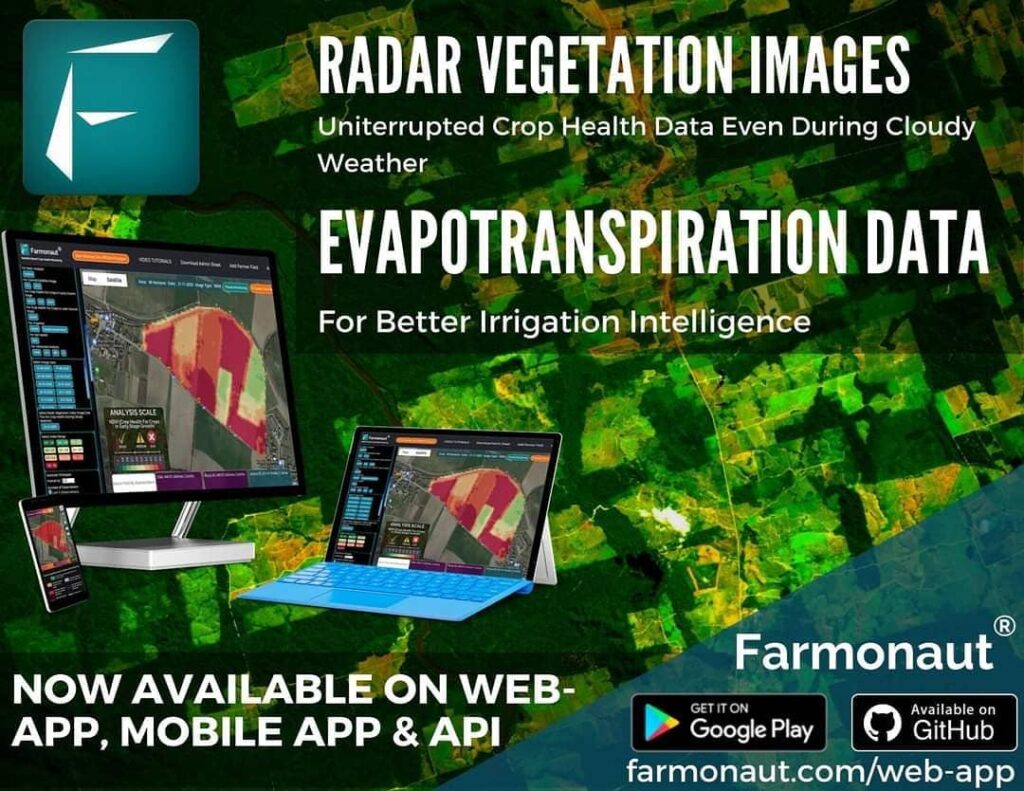
Radar Vegetation Index (RVI) Radar data is obtained by a detection system with the use of radio waves which helps in determination of some parameters such as altitude, height, etc. Radar vegetation Index is used in agriculture for knowing the condition of the vegetation by measuring the linear scattering intensities. The radar data are obtained by the usage of Synthetic Aperture Radar. RVI can also be known as the alternative to NDVI (Normalized Difference Vegetation Index). Problem caused: Different satellite data has been collected for knowing crop health, soil health and irrigation. Obtaining data through satellite can cause issues during cloud cover. Cloud cover specially occurring in monsoon season makes it infeasible to collect data of crop health during the satellite visit. “To deal with the cloud cover and to solve the issues faced in collecting data through satellite during cloudy weather, Farmonaut provides Radar Vegetation index in time series analysis.” Farmonaut offers: The satellite data is captured when the satellite passes through the field. The satellite visit occurs every 5 days to capture the crop health data. Monsoon season generally faces cloud cover everyday which makes it difficult for the satellite to capture the data during every visit. Not only during monsoon but also during regular days cloud cover can be seen on the field. The satellite visibility gets blocked and hence results in no data. Not compromising on the data and to overcome the inconvenience caused by cloud cover to capture the data, Farmonaut has introduced RVI which helps get crop health data during the cloud cover. The data obtained can be visualized in the time series by selecting the date on which farmers need the data. The Radar data recorded assure that during any condition the crop health data would be provided to the farmers. How to Access RVI Data? Step 1: Login to your account on the Farmonaut application. Step 2: Select the farm you want the data for. Step 3: When there is cloudy weather, Go to Radar Vegetation Index in the Controls. Step 4: Select the date for which you want to visualize the data. Step 5: The crop health image appears, analyze it using the scale provided.

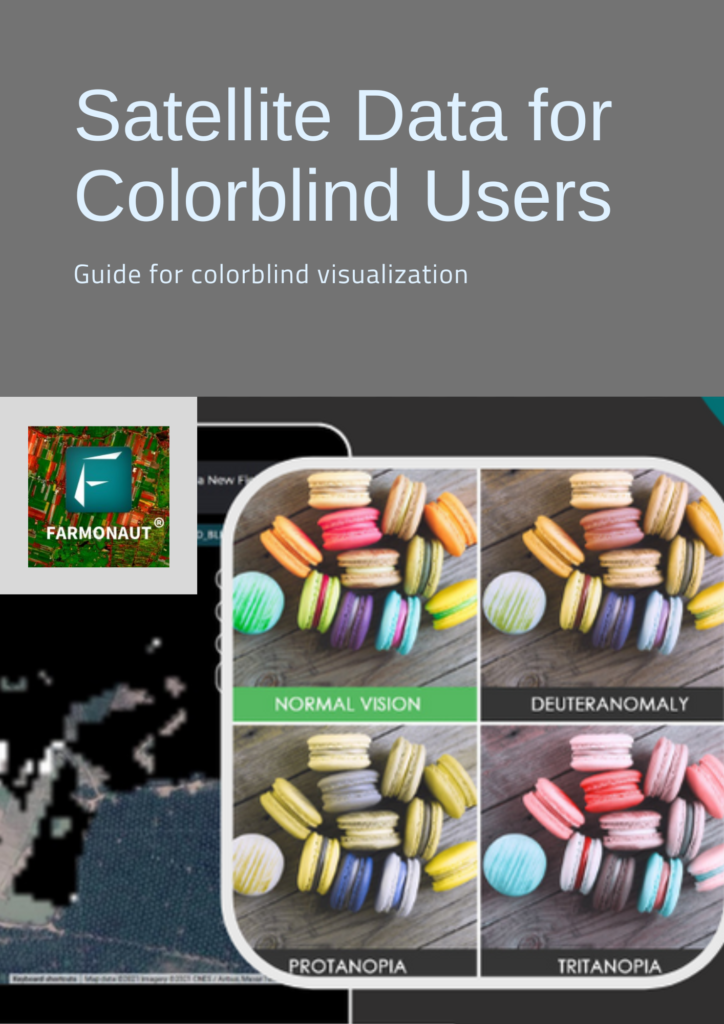
Farmonaut | Satellite Data For Colorblind Users

There are less number of people having color blindness who deal with identification of colors on a daily basis. There are multiple kinds of color blindness like Red-Green Colorblindness, Blue-Yellow Colorblindness, Complete color blindness, etc. Where they have issues in differentiating colors such as red and green or in some cases even all the colors. Even some farmers do have color blindness. For which they cannot be neglected for the services we provide. Problem faced: Colourblind people face challenges in identifying multiple colors. Due to various kinds of colorblindness one may or may not be able to differentiate between different colors. However, Color coded images are easy to interpret and understand, they’re not of much use to colorblind farmers. Farmers having color blindness would face difficulty in interpretation of coloured satellite images. To provide a solution to this problem, Farmonaut has developed the Colourblind Visualization feature. Colorblind Visualization Farmonaut has taken into account the colorblind farmers as well and developed colorblind visualization. The satellite image for a coloublind farmer would be in black and white color contrast because all types of colorblind people can at least differentiate black and white colors. The analysis of which would be much easier for them. Hence, the color coded images of crop health and irrigation are converted to black and white images without compromising on the depth and quality of images. This feature is available on Android apps as well as on the Web. Receive and Analyze the Colorblind Visualization Step 1: Login to your account on Farmonaut Application. Step 2: Select the field you want to see data for. As a default it will show a color coded image. Step 3: Click on the Colorblind Visualization button, it will display the black and white coded image. Step 4: Interpret the image using the analysis scale provided. Note: Cloud cover areas would be displayed in black as well so that farmers can look after those areas too. The analysis scale is represented as follows: Black: the area requires a visit to the farm to check the crop health or irrigation issues. White: area has the irrigation issues only No color: the area is in good condition

Farmonaut | Beginner Guide For Farmers | How To Interpret Satellite Data

Remote Sensing data are of different types for different use cases in agriculture. Farmonaut is providing around 18 different satellite data parameters for examining your farms. The data must be understood first to take necessary or required actions. Satellite data for different problems are: For crop health monitoring: NDVI, EVI, SAVI, NDRE, VARI For irrigation: NDWI, NDMI, Evapotranspiration, DEM For Cloud Cover: RVI For Soil health: SOC Problem: Majority of individual farmers in India have less knowledge on using smartphones. However, there are few farmers which own smartphones but aren’t aware of the features or operations that can be performed. Due to the lack of educated farmers it can be difficult for them to understand all the different satellite data provided by us. Imposing the use of multiple satellite images can overwhelm the early adopter of the technology. To tackle the problem faced, Farmonaut has come up with images known as “Hybrid image/analysis.” What is a Hybrid Image? “Hybrid image includes all the parameters of crop health, irrigation, soil and cloud cover in a single image for easy understanding of new farmers.” Not compromising on the quality of data, the Farmonaut system processes the data into a hybrid image, making it readable and accessible. One image makes it easier for beginners to get used to the technology and understand it as well. Need of Hybrid Image New farmer friendly: Analyzing multiple images for a new user/ farmer can overburden the farmer to process the needed information. Hence, Easy to interpret: Undereducated farmers can easily access and interpret the hybrid images rather than multiple images. The color coding analysis scale available gives a simplified explanation of the image. Always Handy: Hybrid images can be seen on the web, smartphone app and also can be shared. Access and Understand Hybrid Image Step 1: Farmers must login to the application to access the data. Step 2: After logging, the fields already marked are seen in the My fields icon. Click on “My Fields”. Step 3: A page showing the map opens. Select the field you want to get an image of. Step 4: The field visible will be shown with a hybrid image. The Hybrid image of the field is shown by default. Step 5: The analysis scale is provided at bottom of the page as shown in figure. The analysis can be obtained in any desired language for local farmers to understand. Different colors indicate different issues caused. Once you get along with the Hybrid images, we encourage you to use all the images and parameters provided by us for better health of your crops. Tutorial of web app: Farmonaut Hybrid Image And How To Interpret It

Farmonaut | Guide For Knowing Irrigation Parameters (NDWI, NDMI, Evapotranspiration)

INTRODUCTION Zr3i is a digital agricultural platform that provides data to the small farmers, agriculture businesses and all workers in the agriculture sector. Zr3i has developed a website and an android application for Egypt and the Arab World that are available in Arabic language for better understanding for local farmers. “Zr3i’s main objective is to provide detailed information/reports to farmers regarding soil data, vegetation cover indicators which are necessary for increasing productivity.” The platform works on API between the Zr3i and Farmonaut (as a service provider). Hence, the developed platform majorly depends on Farmonaut Technologies. PROBLEMS FACED IN AGRICULTURE SECTOR Farmers face many problems during each stage of farming, from cultivation to harvesting. Being unaware of various weather parameters and soil parameters that affect the quality and quantity of production and decreases profit. Due to the use of traditional methods problems mainly faced are: Water Stress, Carbon level and usage of chemicals. HOW DOES ZR3I WORKS? Zr3i helps the user in providing relevant important services which would be helpful to get rid of all the problems faced during farming operations. It provides crop health analytics, weather data analytics and reports in more than 50+ languages including Arabic. Detailed Reports includes The Farmonaut helps the user of Zr3i to have detailed reports of the farm that are created by their system directly. Everytime a user visits, the system creates a detailed report which helps the farm owner to monitor all activities going on in his/her farm. The reports are generated with the help of satellite images which helps to determine the crop health and weather conditions of the farm. The crop health can easily be estimated through image colors: Light/dark Green: healthy crops. Yellow: crops that need attention. Red: Barren land. Through this color, farmers can easily open GPS and track their field using the images. The images can also be provided in the two color coding based on the height of the vegetation: Colormap 1: It is used for vegetation attending normal height. Colormap 2: It is used for vegetation having 2-3 inches height. Zr3i also provides the NDVI images, EVI images, SAVI images and AVI images that helps in the early growth stages of crops. Whereas, NDRE images are useful in the later stage of crop growth. The images helps as per following: NDVI (Normalised difference vegetative index): NDVI images help to differentiate the bare soil from forests or grassland, detect plants under stress and know the different crops and crop stages. AVI (Advanced Vegetation Index): AVI is used to study the changes in the crops and forests over time. It helps farmers through the satellite images about the various vegetation indicators. EVI (Enhanced Vegetation Index): EVI index uses additional wavelengths of light to correct NDVI errors. However, the NDVI results are very accurate in estimating crop health; there are few errors at atmospheric or ground level that affect the field results.Hence, the errors at atmospheric and ground level are corrected through EVI images. SAVI (Soil Adjusted Vegetation Index): SAVI is used to correct the NDVI index for the soil brightness in areas where vegetative cover is low. Hence, with the help of SAVI to know the soil health, schedule crop irrigation, monitor evaporation, drought and transpiration of the crops. NDRE (Normalized difference red edge) images: NDRE indexes are mainly used at the later growth stages of plants when they are mature and ready to harvest. It helps to know the amount of chlorophyll in the plants. The images such as NDWI (Normalized Difference Water index) are also provided which can be used to monitor changes in the water content and help control irrigation in real time. From the satellite images, the difference between the water level in the current soil and the water level in the actual soil is discovered and the difference between each of them is calculated to address the defect. The report also includes Carbon data also known as soil organic carbon. It helps to know which part of the farm has a low level of carbon so that required treatment can be applied. The report also helps in providing time series data. Time series data gives a sequence of data points collected over an interval of time. For example, if we need the NDWI index for the past 10 days. It can easily be accessed by providing the dates. However, the data will be displayed as values change per time. It also gives precise information if needed. If a farmer having 10,000 m2 land wants to know areas having NDVI 0.6-0.7, it can easily be obtained for increasing productivity. Farmers can also have access to the field images by just knowing the latitudes and longitudes of the farmland. Apart from this the user can also request for the historical data of the area. ACHIEVEMENTS Zr3i was shortlisted in top 10 finalist among 160 Egyptian StartUps for GDEXA | Mentoring and Skilling “Social Up for StartUp”. Zr3i is featured on a regional level across the Arab World. Zr3i is also starting digitization of the agriculture industry in Egypt with the German Government and Ministry of Agriculture. Zr3i has secured a place in the list of 9 most innovative Egyptian based Companies and Startups. Zr3i was announced as the Finalist at Northern African StartUp Awards 2021.  https://www.youtube.com/watch?v=UseRL7K7Q3Ehttps://www.youtube.com/watch?v=lJ56zIdt58Yhttps://www.youtube.com/watch?v=TD43Iz68bh0https://www.youtube.com/watch?v=G2iZ-fmFnsk&t=2s

Farmonaut | How Large Corporates Can Manage Multiple Farms Effectively

Farmonaut has been working with the large corporations by providing them the system for the use of better management of the farms. They have been using the “Remote Sending technology” to grab the data at large scale for the farmers to impart better management of farms. Managing multiple farms at a large scale can be tedious and inaccurate at some point. Hence, to overcome the drawbacks faced by the corporates, Farmonaut is providing Admin application for the large corporates. Through the mobile application they can map fields and monitor, manage and access data with the help of advanced web-app. Benefits to Large Corporations: It helps to manage farms at a large scale at district/village level. Data can be obtained in a couple of seconds within no time. Track the crop health and progress at every stage. Can provide data to multiple farmers at a faster rate. Help farmers to increase the yield and productivity. Downloading, sharing and accessing data is more convenient. About Data you will get: Using the satellite data provided by Farmonaut in the form of comprehensible information, farmers can: Reduce chemical/Fertilizer consumption by applying it only at the locations where crop health is in bad condition. Reduce Labour costs by directing the labour only to the areas where crop health is low. Reduce irrigation water wastage by knowing the water stress. Increase the overall yield. Maintain nutrient composition by knowing the soil carbon content. Some of the concepts most commonly used for high level analysis by Farmonaut are NDVI, NDRE, EVI, VARI, SOC, NDWI, etc according to the use cases of each parameter. For Crop health of crop at early growth stage NDVI (Normalized Difference Vegetation Index) NDVI is used as a measure to identify the state of plant health based on the light reflected by the plant at certain frequencies. Though we cannot perceive it with our eyes, everything around us (including plants) reflects wavelengths of light in the visible and non-visible spectrum. Taking into account how much of a certain wavelength is reflected, we can access the current status of plants. EVI (Enhanced Vegetation Index) EVI is further an optimized index designed to enhance the vegetation signal with improved sensitivity in high biomass regions and improved vegetation monitoring through a decoupling of the canopy background signal and a reduction in atmosphere influences. For Crop health of crop at later growth stage NDRE (Normalized Difference Red Edge) NDRE is a spectral index that helps in gathering the data at the later stages of a crop when chlorophyll content is relatively higher in the crop. For irrigation: NDWI (Normalized Difference Water Index) NDWI index can help us control irrigation, significantly improving agriculture, especially in areas where meeting the need for water is difficult. The high NDWI corresponds to high plant water content and coating of high plant fraction, whereas the low NDWI values correspond to low vegetation content and cover with low vegetation. NDWI rate will decrease during periods of water stress. Hence, through NDWI, the early detection of water stress can prevent many of the negative impacts on crops. NDMI (Normalized Difference Moisture Index) NDMI is used to know the moisture index/water stress in vegetation which helps in monitoring the drought condition of the areas. The kind of vegetation must be taken into account to further know the amount of water to use at particular growth stages of crops. Evapotranspiration Evapotranspiration measures the rate at which evaporation and transpiration occurs at multiple locations. Through evapotranspiration one can easily schedule the irrigation based on the indicators received by the data. Nevertheless, it can be ignored if NDWI and NDMI data result in a good condition. For Advance Analysis VARI (Visible Atmospherically Resistant Index) VARI is minimally resistant to atmospheric effect, allowing vegetation to be estimated in a wide variety of environments. Hence, it is ideally recommended to be used for arm level decision making if TCI or ETCI images show visible atmospheric distortion such as mild clouds or haze above the field. For Topography DEM (Digital Elevation Model) DEM is used to know the waterlogging prone areas in the field. During heavy rainfall or excess irrigation, the areas where the water logged or flood occurs can be identified through DEM. Hence, by knowing such areas the passage for the outsourcing of the water can be ensured by installing more motors in the area. For Soil Health: Soil Carbon Content (SOC) SOC is a measurable component of the soil organic matter that indicates the better health and yield of any land once the cultivation process ends. Remote Sensing technology plays a vital role In enabling farmers to ensure high SOC content by taking the right measures at the right time and the right place. Farmonaut creates a SOC image with a colour map of the percentage of organic matter present in the selected field. The land area appears green in the colour map if SOC content is more than 5% and red if the SOC content is less than 1%. Once the locations with lesser SOC levels are identified by Farmonaut, farmers can get the soil testing done on specific regions, and the required actions can be taken. For Crop Health during Cloudy Weather RVI (Radar Vegetation Index) RVI is measured by the backscattering which does not affect the data. The RVI data was designed to be the time series data which can be a great alternative to the NDVI. However, RVI can be obtained at extreme weather conditions when the satellite data could not be obtained due to cloudy or any other weather conditions. Hence, Farmonaut ensures the data at any conditions. Farmonaut also provides RGB images of the field. (Coloured satellite images) TCI (True Color Image): It is basically raw image of the field captured by satellite of a particular farm. This is not an index image, but a RGB representation of how the field looked like in human perceivable colors upon its last visit. ETCI (Enhanced True Color Image): It is a TCI image

Farmonaut | Annual Newsletter 2021-2022

NO MORE MANUALLY EXAMINING YOUR FARMS GET YOUR HANDS ON KNOWLEDGE ABOUT EMERGING AGRI-TECH Decrease in the crop yield when compared to the investment made by farmers is a major issue. To overcome the issues Remote Sensing technology has been emerging in the Agri-Tech world. Farmonaut Technologies is helping businesses as well as farmers. Know how we are helping them in the Newsletter. Farmonaut started in 2018 with a vision to bridge the technological gap between farmers and bring the latest state-of-the-art technologies in the hands of each and every farmer in the most cost-effective way.   YOU WILL FIND HERE: Emerging technologies in Agriculture Sector by FARMONAUT What our clients/Farmers needs to know Know the technology you are using Providing Solution to the Businesses Managing Individual Farms Recognition and awards Conclusion Our Clients and Partners EMERGING TECHNOLOGY IN AGRICULTURE SECTOR BY FARMONAUT With increase in the advance technologies, the agriculture domain is booming at a high pace. Agri-Tech boosting over the past few years have found the solutions for the problems faced by farmers all over the world. Geospatial technology used in agriculture collects, analyses and stores geographic information. Due to which, the agriculture sector has been growing substantially. Remote Sensing (RS), Geographic Information System (GIS) and Global positioning system (GPS) are a part of the Geospatial Technology used. Farmonaut Technologies uses this technology to help farmers. It was started with the vision to provide technology to each and every farmer in the most cost-effective way. It has been providing Satellite based Crop health Monitoring System, Voice and Text based plant issue identification and database to over lakh of farmers and various businesses based in India as well as in other countries. The services are easily accessible through web, android and iOS apps. For the convenience of farmers, it is available in 50+ languages. Remote Sensing is being widely used in agriculture to help farmers in monitoring the field through satellites. Farmonaut has come up with a cost-effective way to solve the farmers’ problems to a great extent without compromising on the quality of data. A detailed report is generated by the Farmonaut’s system does crop health monitoring of the field through the satellite data which gives away crop health, vegetation water stress and soil organic carbon. We have also been working with individual farm owners in different states of India. Farmonaut has also started providing various services to the businesses like providing database, GPS for fleet management, being API service provider, IOT devices for managing fields and Traceability of the product through block chain system. We have experience of working with International Corporates: Troforte Innovations, Textile Technologies Group Uzbekistan, Fair Climate Fund Netherlands, etc. WHAT OUR CLIENTS/FARMERS NEEDS TO KNOW With the emergence of Remote Sensing in agriculture, we are providing service to our clients and farmers for better crop yield and productivity in a cost-effective way. According to the research conducted, it has been seen that the productivity of crops has been decreasing over the years. This is caused due to improper management of the farmlands. The defects in the farmland and crops cannot be witnessed by the human eye and hence fail to take preventive measures.   Remote Sensing can be the key to the problems of farming. As it can be used for knowing the Crop Damage and Progress on a large scale as well as individual farmlands. Also, identifying the crop health through remote sensing would improve the production by controlling diseases and pests beforehand. Apart from it, remote sensing can also be used for Crop Area and yield estimation which gives an upper hand in planning and resource allocation, evaluating prices and in decision making such as procurement, storage, etc. Soil Mapping is also possible with GPS. Farmonaut is not only providing solutions to the problem of farmers through remote sensing but also helping them to cut down on the investment. An Indian farmer, on an average, spends between Rs.47,000 (580 USD) to Rs.350000 (4300 USD) annually on each hectare of arable land. By using Remote sensing the cost of labour, chemicals, insecticides, pesticides, plant growth regulators, etc. can be reduced up to 30%. KNOW THE TECHNOLOGY YOU ARE USING Using the satellite data provided by Farmonaut in the form of comprehensible information, farmers can: Reduce chemical/Fertilizer consumption by applying it only at the locations where crop health is in bad condition. Reduce Labour costs by directing the labour only to the areas where crop health is low. Reduce irrigation water wastage by knowing the water stress. Increase the overall yield. Maintain nutrient composition by knowing the soil carbon content. Some of the concepts most commonly used for high level analysis by Farmonaut are NDVI, NDRE, EVI, VARI, SOC, NDWI, etc according to the use cases of each parameter. For Crop health of crop at early growth stage NDVI (Normalized Difference Vegetation Index) NDVI is used as a measure to identify the state of plant health based on the light reflected by the plant at certain frequencies. Though we cannot perceive it with our eyes, everything around us (including plants) reflects wavelengths of light in the visible and non-visible spectrum. Taking into account how much of a certain wavelength is reflected, we can access the current status of plants. EVI (Enhanced Vegetation Index) EVI is further an optimized index designed to enhance the vegetation signal with improved sensitivity in high biomass regions and improved vegetation monitoring through a decoupling of the canopy background signal and a reduction in atmosphere influences. For Crop health of crop at later growth stage NDRE (Normalized Difference Red Edge) NDRE is a spectral index that helps in gathering the data at the later stages of a crop when chlorophyll content is relatively higher in the crop. For irrigation: NDWI (Normalised Difference Water Index) NDWI index can help us control irrigation, significantly improving agriculture, especially in areas where meeting the need for water is difficult. The high NDWI values correspond to high plant water content and coating of

Farmonaut | Connecting Soil Testing Labs With Farmers

SOIL TESTING : INTRODUCTION Soil tests are conducted on one or more varieties of soil for knowing the health of soil or to analyze various possible soil parameters. Soil testing is majorly performed in Agriculture and construction industries to possibly know the health and to get better results. However, in India agriculture isn’t much aware about the importance of soil testing for crop health and soil health. The parameters involved in soil testing are Soil temperature, Soil pH, Nutrients such as N, P, Mg, K, Cl, etc. IMPORTANCE OF SOIL TESTING IN AGRICULTURE: In agriculture, 60% of crop yield depends on soil fertility which accounts into making sure of the good quality of soil. With better quality results in better yield of crops. Some other importance of soil testing can be as follows: Know the current health of soil and improve it: Testing reports provides various soil parameters which would be helpful to know the condition and add on the required nutrients or maintain the soil moisture as well. Eventually results in better soil fertility and higher yield. Avoid soil erosion, degradation, etc: With each year soil fertility has been decreasing due to erosion which has caused imbalance in soil management. Also, soil degradation affects the livelihood and health of people. However, Soil restoration is a costly and time consuming process hence, soil management is the efficient and effective way of maintaining soil conditions. Minimize the use of fertilizers: Excess use of fertilizers can degrade the soil quality and fertility. With soil reports excess use of fertilizers can be avoided. Decrease the cost: Unawareness of excess fertilizers used in the farms, the cost of fertilizers and labor increases. It can be reduced by knowing the required amount of fertilizers. Maintain uniformity in nutrients across fields: the soil testing provides all the nutrients data as well which gives an idea to the farmers on what nutrients are to be used. Soil samples from different locations on farms would help to maintain uniformity in the soil nutrients along the field. Improve in yield: Knowing all the parameters of soil would result in better soil quality and improve the yield. SOIL SAMPLING: Soil sampling is done by the farmers by collecting the soil samples from different locations on the farms. It is basically the soil collected from different locations of the farms (based on the area) and sent to the labs for knowing the nutrients and soil health. The soil must be clean from plants and must be taken from a depth of 6-12 inches (varies according to the test). What FARMONAUT offers? Farmonaut, along with crop health monitoring, has introduced a feature to reduce the work of farmers and help them in efficient soil testing procedures. Soil reports can be obtained by the Farmonaut platform. The feature is currently available on the web application of Farmonaut, they have been working to provide the same on mobile application as well. The farmers already associated with Farmonaut have been using this feature for soil testing their farms. They have also been providing the services to businesses and individual farmers as well. Troforte Innovations is an example of using this feature for their farmers in collaboration with Farmonaut. The soil testing would as follows: COLLECTION OF SOIL: The farmer must collect the soil from his/her farm from different locations in the bags. The bags provided have barcodes with 8-10 digits on them for digital use. FORWARD THE SAMPLES: The bags are sent to the soil testing Labs for soil testing. TESTING THE SOIL: Soil testing Labs performs multiple tests nearly 10-15 tests. The tests help to identify various parameters such as pH, EC (electric conductivity), Carbon content, Saturation percentage and Nutrients like Potassium, Nitrogen, Magnesium, Phosphorus,etc. UPLOADING THE RESULTS: The result of soil tests were obtained manually by the farmers. Farmonaut has made it easier through technology which provides the data digitally on their devices. The soil testing labs can upload the results of the tests through API endpoint which then will match with the barcode added by the farmers in order to display the results on their device. EASY ACCESS TO RESULTS: The access to the soil tested data can be gained by scanning the barcodes on the bag. The farmer/user have to add the field and the soil sample information which includes 3 data points as shown in the figure below: Select the field: The field must be selected from the fields that have already been marked/geotagged by the user. Barcode: The barcode can be scanned or barcode number can be typed by the user. Sample Location: The user has to select the location on the map from where the soil sample was taken. The platform has an option “REPORTS” which displays the soil results and also helps to add the soil sample data as above. After adding the field if the results of the test are available it shows Purple color otherwise gray if results are not available. The reports that are obtained from the testing labs included more than 100 parameters. Also, the user can easily search for the parameters they need. CONCLUSION: Soil fertility has been a major issue over the past years in agriculture production. Soil sampling is done by the farmers from their farms which is then sent to testing labs. The reports generated were manually sent to the farmers which may take more than a day. To overcome this, Farmonaut has come up with a service that provides data with ease to the farmers on their devices just by a few clicks.

Manage Losses In Your Sugarcane Farms Using Satellite Data

SUGARCANE Sugarcane is the main cash crop of India as it can ensure returns even at extreme conditions with low risk. The sugar industry is the second largest agro-based industry after the textile industry. In India about 65% of farmers indulge in sugarcane farming. Sugarcane is mainly procured by the sugar mills situated at every corner of India. It is used as raw material for producing chemicals, Alcohol, paper and cattle feed apart from sugar. INDIAN SUGARCANE MARKET India is the second largest producer of sugarcane in the world. With the increase in production the sugar industry is expanding at a fast rate. The average yield of sugarcane in India is 80-100 tonnes per hectare. Uttar Pradesh is the highest sugarcane producing state of India, followed by Maharashtra and Karnataka.  According to the Cabinet Committee on Economic Affairs (CCEA), around 360 lakh tons of sugar is likely to be purchased by the sugar mills in 2022-23. However, Sugarcane prices in India are decided by the CCEA as FRP (Fair and Remunerative prices). The approved FRP of sugarcane for 2022-23 is Rs.305 per quintal.The farmers get the prices based on the quantity and quality of sugarcanes. LOSS IN PRODUCTION DUE TO VARIOUS FACTORS:  According to a study conducted, it was found that 50% of losses are due to deficiency of water and Nitrogen. Hence it becomes a major issue in the decrease of the yield.   According to TamilNadu Agricultural University (TNAU), Tamil Nadu and the nearby states account for about 20% loss in sugarcane yield and 15% loss in sugar yield due to the insects such as borers, sucking pests and soil dwelling insects.  According to research conducted, insect infestations reduce sugarcane productivity by 20-25%. Sugarcane is plagued by about 200 insects, almost a dozen of which cause significant losses in crop quality and quantity.   MANAGE IT THROUGH FARMONAUT Farmonaut Technologies are actively providing services to various farmers for managing their farming problems through a click. Losses caused due to various parameters in sugarcane farming could be effectively controlled to a great extent by taking care of the crops. Farmonaut provides satellite images to the farmers of their farms to take necessary actions.  To elaborate, the deficiency of water, pests and insect attacks, diseases caused, etc can be easily recognized at a very early stage. Once the farmer locates their farm, the satellite data gets captured that automatically generates reports for the farmers that are delivered virtually.  Farmonaut does provide data on crop health monitoring, area estimation, water stress, carbon content, soil health and various other parameters as well.   Crop Health monitoring: With the satellite data, crop health is monitored on the app. The crop health parameters such as temperature, humidity, etc are included in the reports generated. The health of the crop at different locations on the farm can be examined with the different images of satellites. The images can be easily examined through the scale provided for every image. At early growth stages, NDVI, EVI images are more likely to be accessed as it gives the state of the plant through light reflectance. However, at the later growth stage NDRE images give better results as the chlorophyll content is higher. In extreme weather conditions, the satellite may or may not provide accurate data, hence Radar data is also provided by us so that farmers don’t miss any important changes taking place. Water Stress: For knowing the condition of the farms, NDWI, NDMI and evapotranspiration data are provided. It gives away the areas needed to be irrigated or are in extreme irrigated condition.  Crop area and yield estimation: Farmonaut has also accurately performed the Crop area and yield estimation  for various different crops. It becomes extremely useful for large areas, hilly areas or areas that are inaccessible. The estimation can be obtained just by mapping the boundaries of the farm on the map. It would give information such as crop area sown, crop identification and sowing and harvesting pattern of the producers.  SIGNIFICANCE OF EFFECTIVE MANAGEMENT OF SUGARCANE FARMING. The main objective of farmers is to get better quality and quantity of sugarcane for higher profits. Knowing their farms better would result in high yield. As the losses caused by various pests and insects would be reduced. As the FRP of sugarcane is decided by the Government, the farmers have to indulge in getting higher yield for high profits. For the sugar industries, the procurement of sugarcane would be high and the quality of the sugar production would be increased as the quality gets better. Higher recovery of sugar is important for the sugar mills as farmers want higher weight but mills want better recovery. Through water deficiency, pests, diseases, etc not only the yield for farmers gets affected but also provides low quality raw material for production of sugar, paper, alcohol, etc. Through the estimation of crop area and yield, mills procuring sugarcane from farmers would have an upper hand in knowing the sugarcane sown area that would benefit them in decision making and allocation of the materials. CASE STUDY OF SUCCESSFUL AND SATISFIED FARMER (Mr. Ashok Shinde: Shree Datta Shetkari Sahakari Sakhar Karkhana Ltd.) Ashok Shinde, a farmer based in Kolhapur District of Maharashtra and associated with Shree Datta Shetkari Sahakari Sakhar Karkhana Ltd., has been using Farmonaut Services for his sugarcane farms since October 2021. He also provides advice to the nearby farmers engaged in sugarcane farming.   Mr. Ashok was mainly using the Farmonaut services for the irrigation problem caused, to know the irrigation patterns and to know the required areas to be irrigated. Hence, the data of NDMI, NDWI and evapotranspiration played a major role for the purpose. He received data on his mobile phone and by knowing the current status of the fields he took the necessary actions for better yield. Not only did he take actions but also cross-verified the data after the actions were taken.  As the reports generated give data on the crop health and other parameters, it helped Mr. Ashok
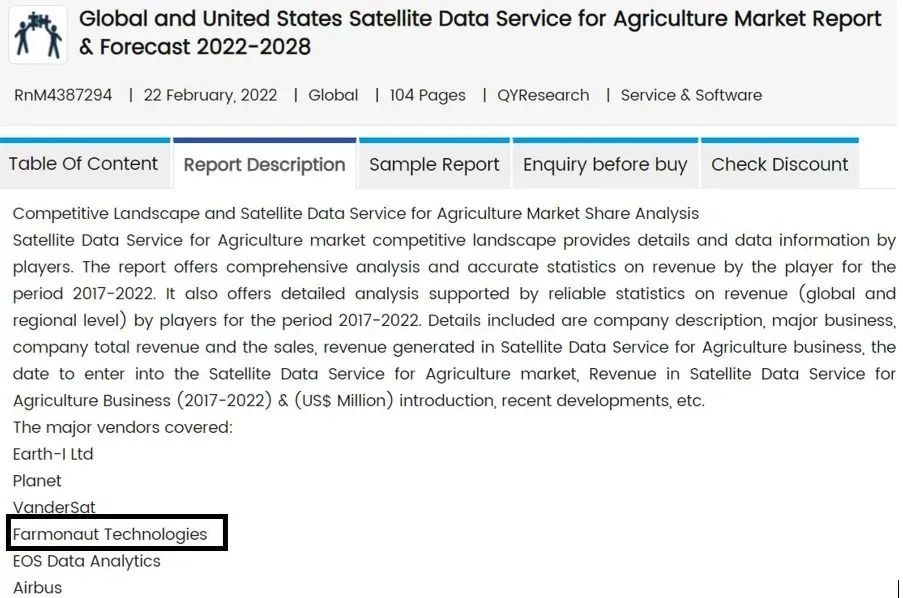
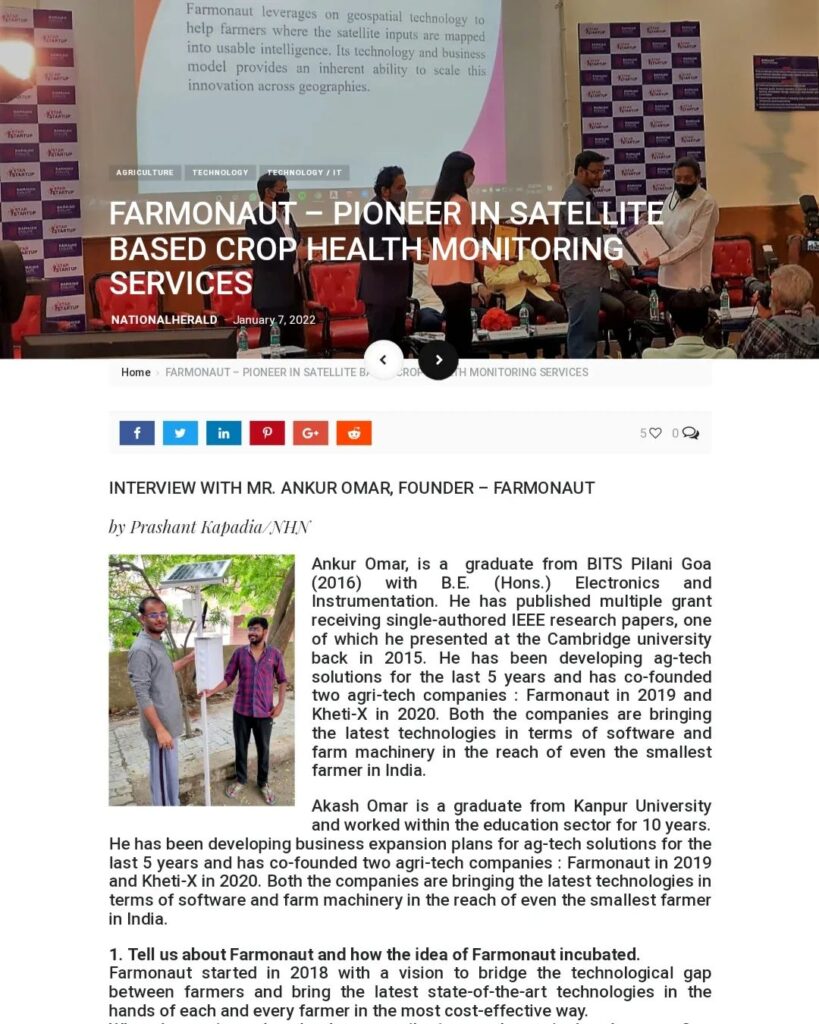
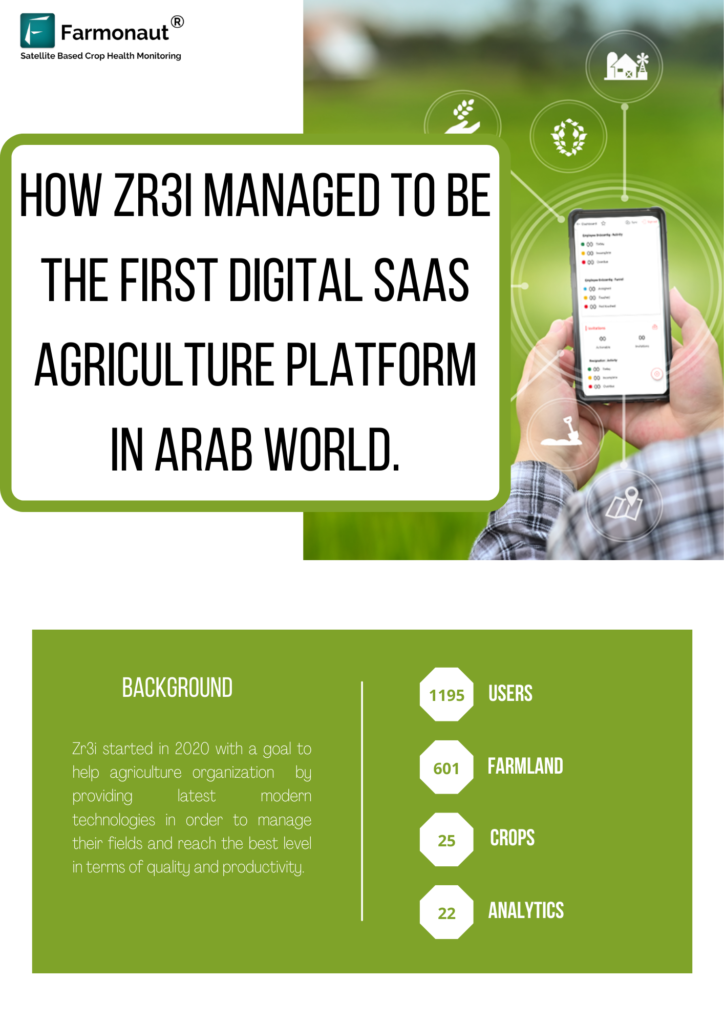
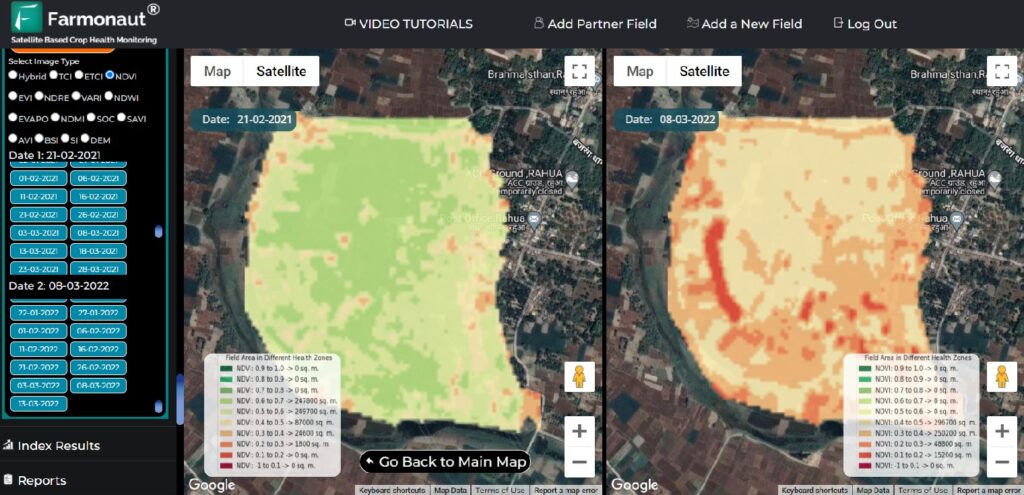
How Drones Combined With Satellite Data Provide Cost Saving Inputs

INTRODUCTION Agrodrone is an Israel based company with a great experience of UAVs (Unmanned Aerial Vehicles commonly known as Drones). The company is currently associated with the application of UAVs in the field of agriculture to help farmers with the help of satellite images and airborne equipment. They have also been certified operational by CAAI (Civil Aviation Authority of Israel). Agrodrone has looked forward to the safety and effective working of the drones by managing to get certified drone pilots and certified drones as well. EMERGING UAVs IN AGRICULTURE Drones were commercially used since the 1980s, due to the vast applications in various fields it has built an impact on the world. As a result, many companies are creating various business opportunities through UAVs. For better understanding, it has been named as precision agriculture in modern terms. However, AgroDrone has been working for the farmers of Israel having large farm areas i.e, >100 hectares. Farmers with large land holdings have had many use cases of the UAVs which has many opportunities for the farmers to lead a better way towards increasing their productivity and income as well. There has been many applications of drones in the agriculture field as mentioned below: Crop health monitoring Weed identification Soil and field analysis Cattle monitoring Spraying Planting Irrigation LIMITATIONS OF UAVs Agriculture applications drones also do have some drawbacks which need to be solved for precise farming. Requires trained operators for drones: For flying the drones the pilot must take license from the country Government. Less flight time: Due to battery backup drones don’t have enough flight time to scan large farms. Less range: there are different range drones: small, medium and large. The large drones are expensive for the farmers and less range drones aren’t much useful for large farmers. More features drones are expensive: More features in machinery gets at higher prices. Can cause accidents with manned armed aircrafts. Difficult to operate in extreme conditions: Changing weather conditions can disrupt the flying of drones which can affect the data driven from it. Due to the drawbacks mentioned above, drones solely cannot be used for precision farming. SATELLITE DATA Due to various drawbacks of drones, satellites can be of great use to capture data of the farmland. Satellites capture the data based on the concept of NDVI (normalized Difference vegetative index) that states the stressed areas and dry/wet areas too.. It also provides information such as crop health, soil health, vegetation index, etc. HYBRID APPROACH AS A SOLUTION In order to overcome the problem faced by drones in agriculture, Agrodrone has been opting for a hybrid solution. Hybrid Approach is basically a combination of satellite data and drones to find a feasible solution to the farming problems. With the similar approach Daybest, an India based company, is carrying the same use case on the large scale. Daybest also uses UAVs and satellite data in different sectors including Agriculture for precise results. As mentioned above, usage of only drones leads to scalability issues as well as is not feasible for large farms to locate the issues. Apart from it, it does bend towards the expensive side. How does it WORK? To start with, Agrodrone inserts the locations of the farms of their clients(farmers) on the Farmonaut’s platform. Hence, whenever the satellite passes over the locations it collects data on the information of vulnerability of the areas on the farms. Satellite data would help to decrease the drone flight time and cover a large range in a very short time. In spite of flying the drone over the whole land area, it can be flown over the vulnerable areas where the satellite has indicated risk for the farms. The information from satellites and drones is processed which is used to report to the growers/farmers and help them in the management of the farms through machinery. Therefore, the farmers owning the drones can easily manage the areas through satellite data and drone usage. BENEFITS OF THE APPROACH The usage of drones with the satellite images have helped the Agrodrone to make their client’s farm more advanced and increase the productivity. The benefits of this approach would be that it would be less expensive than using drones only. Apart from that the data can be gained in the extreme weather conditions also. Also, it becomes more feasible for farmers to adopt the technology and it is easy to understand. CONCLUSION Agrodrone being the UAVs expert tried applying it to the field of agriculture to overcome the limitations of Drones in agriculture. They have been combining the drone technology with the satellite data to benefit the large farmers in Israel. This combination has various benefits such as it would be less expensive as compared to only using drones. Also it would decrease the flight time of drones and as the range of inexpensive drones is low satellite plays a major role in finding the data. The satellite data is gained when Agrodrone locates the farm on the Farmonaut platform.

Farmonaut For Crop Area and Yield Estimation

INTRODUCTION: CROP AREA ESTIMATION The two components of agricultural production estimation are crop area and yield estimation. In order to estimate yield, Producers generally measure the amount of a particular crop harvested in a sample area to estimate crop yield. The harvested crop is then weighed, and the entire crop production of the area is approximated from the sample. A method for estimating and forecasting termed as a crop estimation allows analysts or farm owners to predict or calculate the potential tonnage of a particular crop. The estimation of the crop can be done at different levels such as village level, taluka level, district level, state level and national level. To obtain the most accurate results, it is advisable to estimate the crop area at distinct periods all across the season. “WHY IS IT NECESSARY?” Planning and resource allocation for the progress of the agricultural sector mainly rely on data on crop area, yield, and production. The planners and policymakers are incharge of formulating effective agricultural policies and making critical decisions on procurement, storage, public distribution, import, export, and other similar matters rely on accurate and timely information on crop area, yield, and production. Crop area estimation also ensures global or national food security and helps in making reasonable import/export policies, as well as for adjusting food prices effectively. “METHODS FOR CROP AREA ESTIMATION” The best measuring technique for estimating crop area is determined by a number of operational parameters, such as land design, field shape, type of crop, cropping pattern, and available skills and resources. Farmer assessment of crop area: In this method, the farmers are asked to estimate their field area by visiting the farmers’ field. However, this method is less time consuming and inexpensive. In contrast, this method is subjective and requires knowledge and experience. GPS: GPS provides location and time information anywhere on earth. This method gives rapid and feasible measurements. But this method has a drawback that data would be missing for fields located in the remote areas and data could be affected due to weather conditions. Rope and Compass method: this has been the traditional method majorly used. To its advantage, it provides accurate area measurements and errors can be evaluated on spot. However, it is a laborious and expensive method. Remote Sensing and GIS: Remote sensing helps to collect data through satellite that helps to estimate crop area. The satellite images used give accurate results for the crop area estimation. For large areas such as district level, state level, this method works precisely. It is also useful in estimating hilly areas and the areas that are inaccessible. Farmonaut Technologies provides crop area estimation services to various agencies by Remote sensing method majorly for decision-making. USE CASES OF CROP AREA ESTIMATION FOR DIFFERENT REGIONS Soybean Processors Association Of India (SOPA) SOPA has been performing Crop Area Estimation in 50 districts of Madhya Pradesh, Maharashtra and Rajasthan. Soybean being the high valued oilseed crop requires information on the crop production to understand the crop sown. For the estimation of crop area and yield, optical remote sensing data source was used. Crop leaves being sensitive to the visible and infrared regions helps to estimate accurately. With the help of optical satellite images and Synthetic Aperture Radar (SAR) the kharif season crop could be mapped. SAR has the ability of operating wavelengths that can access data during cloud cover too. This estimation method helped SOPA to determine Crop Area Sown, Crop Identification, Tracking of Sowing and harvesting patterns of the producers. All this information helps them in suggesting the prices of soybean oilseeds, export/import decisions and storage and distribution of oilseeds. For more information on Project: Click here Rice Yield Calculation in Saharsa (Bihar)- 2021 The research was carried out in the rice crop in Saharsa, Bihar at the final stage of vegetation (i.e., 10-30 days before harvesting). For forecasting the yield of paddy, the data from Sentinel-2 satellite and Farmonaut’s Satellite based crop monitoring system. The yield was calculated using the NDVI (Normalized Difference Vegetation Index) and the Farmonaut platform helped in field mapping. As a result the prediction of average yield was approximately similar to the data from the KVK (Krishi Vigyan Kendra). The yield forecasting with remote sensing gives less errors. For more information on Project: Click here Makhana Area and Yield Calculation in Saharsa (Bihar) – 2022 Bihar being the largest producer of fox nuts, commonly known as makhana. Makhana is grown in stagnant water of wetlands or ponds. The study was conducted for the estimation of Makhana crop acreage using remote sensing. Sentinel-2 satellite data was used to determine the area with the parameters such as NDVI and LSWI (Land Surface Wetness Index). As a result, the makhana area calculation is feasible. However, the accuracy of which can be improved by using different models. Also, it was found that depth of the pond also affects the accuracy therefore must be considered. For more information on Project: Click here Potato Yield Estimation Estimation of potato crop yield before the harvest period would be useful in making marketing decisions. Also, the early estimation of yield can help in detection of problems and help them reduce the losses. According to the survey, it can be concluded that estimation of yield of potatoes using Remote sensing is a very tough process. In order to calculate yield various indices like NDVI, EVI, VCI, NDWI can be used. For more information on Project: Click here Wheat yield Calculation in Saharsa(Bihar) – 2022 Using remote sensing data and specific algorithms with different vegetation indices, Farmonaut estimated wheat yield in the Saharsa district of Bihar during the Rabi season 2020-21. Similar to the other crop estimation, Sentinel-2 was used in mapping the fields and the area and yield were calculated using NDVI and LAI (Leaf Area Index). In the procedure the estimation was done by using the LAI with WTGROWS model for mapping yield. If the weather conditions seem normal then the yield achieved would have less error. In

How ZR3I Managed To Be The First Digital Agri SaaS Platform in the Arab World

INTRODUCTION Zr3i is a digital agricultural platform that provides data to the small farmers, agriculture businesses and all workers in the agriculture sector. Zr3i has developed a website and an android application for Egypt and the Arab World that are available in Arabic language for better understanding for local farmers. “Zr3i’s main objective is to provide detailed information/reports to farmers regarding soil data, vegetation cover indicators which are necessary for increasing productivity.” The platform works on API between the Zr3i and Farmonaut (as a service provider). Hence, the developed platform majorly depends on Farmonaut Technologies. PROBLEMS FACED IN AGRICULTURE SECTOR Farmers face many problems during each stage of farming, from cultivation to harvesting. Being unaware of various weather parameters and soil parameters that affect the quality and quantity of production and decreases profit. Due to the use of traditional methods problems mainly faced are: Water Stress, Carbon level and usage of chemicals. HOW DOES ZR3I WORKS? Zr3i helps the user in providing relevant important services which would be helpful to get rid of all the problems faced during farming operations. It provides crop health analytics, weather data analytics and reports in more than 50+ languages including Arabic. Detailed Reports includes The Farmonaut helps the user of Zr3i to have detailed reports of the farm that are created by their system directly. Everytime a user visits, the system creates a detailed report which helps the farm owner to monitor all activities going on in his/her farm. The reports are generated with the help of satellite images which helps to determine the crop health and weather conditions of the farm. The crop health can easily be estimated through image colors: Light/dark Green: healthy crops. Yellow: crops that need attention. Red: Barren land. Through this color, farmers can easily open GPS and track their field using the images. The images can also be provided in the two color coding based on the height of the vegetation: Colormap 1: It is used for vegetation attending normal height. Colormap 2: It is used for vegetation having 2-3 inches height. Zr3i also provides the NDVI images, EVI images, SAVI images and AVI images that helps in the early growth stages of crops. Whereas, NDRE images are useful in the later stage of crop growth. The images helps as per following: NDVI (Normalised difference vegetative index): NDVI images help to differentiate the bare soil from forests or grassland, detect plants under stress and know the different crops and crop stages. AVI (Advanced Vegetation Index): AVI is used to study the changes in the crops and forests over time. It helps farmers through the satellite images about the various vegetation indicators. EVI (Enhanced Vegetation Index): EVI index uses additional wavelengths of light to correct NDVI errors. However, the NDVI results are very accurate in estimating crop health; there are few errors at atmospheric or ground level that affect the field results.Hence, the errors at atmospheric and ground level are corrected through EVI images. SAVI (Soil Adjusted Vegetation Index): SAVI is used to correct the NDVI index for the soil brightness in areas where vegetative cover is low. Hence, with the help of SAVI to know the soil health, schedule crop irrigation, monitor evaporation, drought and transpiration of the crops. NDRE (Normalized difference red edge) images: NDRE indexes are mainly used at the later growth stages of plants when they are mature and ready to harvest. It helps to know the amount of chlorophyll in the plants. The images such as NDWI (Normalized Difference Water index) are also provided which can be used to monitor changes in the water content and help control irrigation in real time. From the satellite images, the difference between the water level in the current soil and the water level in the actual soil is discovered and the difference between each of them is calculated to address the defect. The report also includes Carbon data also known as soil organic carbon. It helps to know which part of the farm has a low level of carbon so that required treatment can be applied. The report also helps in providing time series data. Time series data gives a sequence of data points collected over an interval of time. For example, if we need the NDWI index for the past 10 days. It can easily be accessed by providing the dates. However, the data will be displayed as values change per time. It also gives precise information if needed. If a farmer having 10,000 m2 land wants to know areas having NDVI 0.6-0.7, it can easily be obtained for increasing productivity. Farmers can also have access to the field images by just knowing the latitudes and longitudes of the farmland. Apart from this the user can also request for the historical data of the area. ACHIEVEMENTS Zr3i was shortlisted in top 10 finalist among 160 Egyptian StartUps for GDEXA | Mentoring and Skilling “Social Up for StartUp”. Zr3i is featured on a regional level across the Arab World. Zr3i is also starting digitization of the agriculture industry in Egypt with the German Government and Ministry of Agriculture. Zr3i has secured a place in the list of 9 most innovative Egyptian based Companies and Startups. Zr3i was announced as the Finalist at Northern African StartUp Awards 2021.  https://www.youtube.com/watch?v=UseRL7K7Q3Ehttps://www.youtube.com/watch?v=lJ56zIdt58Yhttps://www.youtube.com/watch?v=TD43Iz68bh0https://www.youtube.com/watch?v=G2iZ-fmFnsk&t=2s

Farmonaut Overview 2021-2022

Farmonaut was a vision seen in 2018 to bridge the technological gap between the farmers and their outputs. It also offers a satellite-based crop health monitoring system to agricultural companies to map more than 25000 farmers’ fields. Farmanaut uses geotagging to map fields and provide smart data to farmers through its robust and advanced web app.

Farmonaut Impact Analysis (April – October 2021)

Last 6 Months have taught us so much at Farmonaut. We faced the dangerous 2nd wave of covid-19 which affected all of us on the team as well as family level. For a bootstrapped startup like Farmonaut® it was a very important battle to be fought. It feels great to see us achieve so many milestones even in these tough times.

Snow Cover Analysis Using NDSI

The differentiation between clouds and snow can be difficult because of similarity in spectral characteristics in the visible wavelength range. It is important to differentiate between cloud and snow to improve in accuracy of cloud detection.

Scroll to Top