

Italian farmland · Buyer's guide
Buying a Farm in Italy: Land Prices, Laws and Steps
Foreigners can usually buy Italian farmland. The price (CREA: €22,400 per hectare on average in 2024), a 15% registration tax for most buyers who are not farmers enrolled in farm social security and a right of first refusal for some tenants and neighbours shape the deal. Check every rule with a notary or lawyer.
Key takeaways
- Italian farmland averaged €22,400 per hectare in 2024 (CREA), from about €8,600 in the islands to €47,100 in the northeast.
- Most buyers who are not farmers enrolled in farm social security pay 15% registration tax on the declared price, at least €1,000, plus €50 each in mortgage and cadastral tax. Reliefs exist for some farmers and some buyers under 40, so ask the notary which rate applies.
- Some tenant farmers and neighbouring farmer-owners can match your offer: 30 days to accept, and up to one year to take the land back if the seller never told them.
- EU citizens can buy on the same terms as Italians. A non-EU buyer needs a valid residence permit or reciprocity, and the notary checks which applies.
- Rates and rules change. Use the calculator for a rough budget, then confirm every figure with a notary or lawyer.
In this article
- Italian Farmland Prices by Region
- The Right of First Refusal — What "Prelazione Agraria" Actually Means
- Who actually holds the right of first refusal
- Legal Requirements for Purchasing Agricultural Land
- Why the process varies by town
- What Italian Farmland Actually Produces
- CAP Subsidies, Taxes, and the Real Cost of Ownership
- Purchase taxes by type of buyer
- Purchase Cost Calculator
- Using Satellite Data to Vet Land Before You Buy
- Overcoming the Five Common Friction Points
- Step-by-Step: Securing an Italian Farm Purchase
- Sustainable Farming Considerations
- Financial Considerations for Foreign Buyers
Reviewed October 2026 against CREA, Eurostat, the Agenzia delle Entrate and the Italian registration-tax code.

Foreigners can buy agricultural land in Italy — farmland (terreno agricolo, the standard translation for “land” when the context is farming) is open to EU citizens and to non-EU citizens legally resident in Italy (the notaries’ council states this for property in general). Other non-EU buyers can buy where their home country gives Italians the same right (the reciprocity rule). The notary checks reciprocity case by case, if necessary with data from the Italian Foreign Ministry, so confirm your country’s position before making an offer. In 2024, Italian agricultural land averaged €22,400 per hectare, according to CREA (Consiglio per la ricerca in agricoltura e l’analisi dell’economia agraria), with area averages ranging from about €8,600/ha on the islands to €47,100/ha in the northeast. The catch isn’t nationality — it’s a legal mechanism called diritto di prelazione agraria (agricultural right of first refusal), and a 15% registration tax on the declared price for most buyers who are not farmers enrolled in farm social security (reliefs exist for some farmers and some buyers under 40).
This guide walks through what those numbers mean in practice, plus a calculator to estimate your all-in purchase cost before you make an offer.
“In Italy, qualifying tenant farmers and some neighbouring farmer-owners have a statutory right of first refusal when agricultural land is sold.”
Italian Farmland Prices by Region
Before anything else, get the price context right, because “farmland in Italy” spans a range of more than 5 to 1 depending on where you’re looking. CREA’s 2024 survey put the national average agricultural land price at €22,400 per hectare (roughly €9,070 per acre at standard hectare-to-acre conversion). That average hides sharp regional variation:
Chart
Average farmland price by area of Italy, 2024
Euro per hectare of utilised farmland; CREA’s survey areas and the national average
| Region | Average price per hectare (2024) | Approx. per acre |
|---|---|---|
| Northeast Italy (area average; includes mountain land in Trentino-Alto Adige) | €47,100 | ~€19,060 |
| Northwest Italy | €35,200 | ~€14,240 |
| National average (all regions) | €22,400 | ~€9,070 |
| Islands (Sicily, Sardinia) | €8,600 | ~€3,480 |
For context on the trend: Eurostat’s EU27 average price of arable land rose 6.1% in 2024, from €14,343 to €15,224 per hectare. Land in Italy is not cheap relative to the EU average (in 2020, the last year Eurostat shows for Italy, arable land cost €35,447 per hectare against €12,361 in the EU27), and CREA reports a rise of about 1% for Italy in 2024. CREA’s average prices are lowest in the islands (about €8,600), the south (€13,300) and the centre (€15,100).
These CREA figures are for 2024. CREA published them in November 2025 and runs its survey every year, so check its site for a newer regional table before you budget.
How big are farms in Italy?
Most are small. In Eurostat’s 2023 farm structure survey, 60.6% of Italian farms worked less than 5 hectares (about 12.4 acres), and the country’s utilised agricultural area was 12.4 million hectares, or 7.9% of the EU total (source). Many land sales are small: 57% of the recorded sales in 2024 were worth under €10,000 (CREA summary). A larger holding can mean several separate purchases, each with its own prelazione check.
Why prices differ so much
CREA’s 2024 summary says the gap between north and south comes from more plains and irrigated land in the north, and from towns that take farmland and cut the supply. Prices of marginal, less productive land tend to fall, while prices of easy-to-reach land and land suited to quality products tend to rise. In the northeast, mountain land in Trentino-Alto Adige lifts the average: little land is farmed there, but it earns a lot. CREA also warns that its 2024 results cannot be compared with older editions, because it revised its survey areas and agrarian regions. The chart below shows how far zone averages swing inside each area.
Chart
How far prices swing inside each area, 2024
Lowest and highest of the altitude-zone averages in each area (mountain, hill, plain), euro per hectare
The Right of First Refusal — What “Prelazione Agraria” Actually Means
Prelazione is one of the legal checks a notary or lawyer must run before you sign. Italian law grants tenant farmers already working the land, and some neighbouring owners who farm the adjoining land themselves (confinanti), the right to match any offer on agricultural land before it can be sold to an outside party, foreign or Italian.
If the seller never notifies a qualifying neighbour or tenant, that person can take the land from the buyer within one year of the sale being recorded in the land registry (trascrizione). The point is not that foreign buyers cannot own Italian farmland — they can — but that the check on tenants and neighbouring farmers has to be done before you sign.
Steps to Clear the Right of First Refusal
- Identify Neighboring Landowners: Your notary (notaio) or lawyer pulls the cadastral map and lists every adjoining parcel owner, not just the visibly obvious ones.
- Formal Notification: The seller must legally notify all qualifying parties of the sale terms before closing.
- Waiting Period: Qualifying neighbours and tenants have 30 days from receiving notice to match the offer.
- Claim or Waiver: If a holder accepts within the 30 days, the holder takes the land on the terms offered to you. Ask your lawyer how a written waiver, or the end of the 30-day period, is documented.
- Documentation: Obtain signed waivers from every party with a potential claim before you rely on the sale being final.

Who actually holds the right of first refusal
Not every neighbour can block a sale. Under Law 590/1965 (art. 8) and Law 817/1971 (art. 7), the right belongs to two groups, as Confagricoltura Bologna summarises:
- A tenant farmer already working the land being sold.
- A neighbouring owner whose land touches the parcel, who is a direct cultivator (coltivatore diretto) or professional farmer (IAP), and who has farmed that land for at least two years. The neighbour has no right if a tenant or sharecropper is settled on the parcel for sale.
The timetable is fixed by law:
- The seller sends each holder the preliminary contract by registered letter, with the buyer’s name, the price and the terms.
- The holder has 30 days from receipt to accept, and then three months to pay.
- If the seller skips the notice, the holder can later buy the land back from the buyer, and from any later owner, within one year of the sale being recorded in the land registry (riscatto).
So the practical check is narrower than “every adjoining owner”: your notary needs to know which adjoining owners are registered farmers who have worked their land for two years, and whether a tenant farms the parcel. Waivers from those people, or proof that the 30 days have passed without an answer, are what make the title safe.
More details from Confagricoltura Bologna that are easy to miss. A tenant must have farmed the parcel for at least two years, and a neighbour must have farmed the adjoining land for two years. The sold parcel has to touch the neighbour’s land, with no road or canal between. A neighbour can claim only part of the land, and several neighbours can each claim a share. If the right holder asks for a mortgage to buy, the three months to pay stop for up to one year. This is a summary, not legal advice: a lawyer or notary must apply it to your parcel.
Legal Requirements for Purchasing Agricultural Land
Beyond prelazione, checks that a notary or lawyer typically makes include:
- Right of First Refusal Clearance: Covered above — the precondition for a clean title.
- Land Use Verification: Confirm the parcel’s registered agricultural classification (uso agricolo) and any restrictions on converting it to residential or commercial use.
- Legal Documentation: Cadastral records and, where relevant, historic land-use certificates.
- Zoning Certificate: The deed needs a certificato di destinazione urbanistica from the town hall confirming the land’s zoning.
A lawyer experienced in Italian agricultural property is not a formality here — it is standard advice for foreign buyers, alongside the notary who draws up the deed. A qualified lawyer will typically:
- Run the neighboring-owner search before you sign a preliminary contract, not after.
- Confirm the land’s registered use and any building or development restrictions.
- Liaise directly with local authorities and any neighboring landowners with a claim.
- Translate and explain every document before you’re asked to sign it.
On foreign buyers, the Italian notaries’ council says a non-EU citizen can act if a valid residence permit or long-term residence permit proves lawful residence, and that the notary checks reciprocity case by case for other non-EU buyers. The implementing rule, DPR 394/1999, article 1, lists permits for which the check is not required: the long-term residence card, and permits for employment, self-employment, an individual business, family, humanitarian or study reasons. Which case applies to you depends on your permit and your country, so ask the notary early.
Why the process varies by town
Practical friction varies by town: zoning, access rights and the number of neighbours to notify differ from parcel to parcel.
The minimum wait is set by the 30-day prelazione notice; beyond that, timing depends on how quickly the zoning certificate and cadastral records come through, which your notary can estimate before you make an offer.
What Italian Farmland Actually Produces
If you’re evaluating farmland for its productive potential rather than as a lifestyle purchase, the scale of the sector helps. Italy has about 1.3 million farms working 12.4 million hectares of agricultural land, per Eurostat‘s 2023 farm structure survey.
Olive groves alone cover about 1.1 million hectares across Italy (1.08 million hectares in Eurostat’s 2024 crop statistics) — a useful benchmark if the parcel you’re considering is planted with olives, since it tells you the scale of the industry you’d be joining rather than starting from nothing. Eurostat’s 2024 figures for Italy are 3.63 million tonnes of durum wheat, 2.62 million of common wheat and spelt, 4.94 million of grain maize and 6.61 million of wine grapes. National yields were 3.1 tonnes per hectare for durum wheat, 5.0 for common wheat and 10.0 for grain maize. If you need a per-hectare yield estimate for a specific parcel, a local agronomist or the seller’s farm records are the fastest way to get a number specific to that land.
CREA says prices are higher where plains and irrigated land are common and where growing towns limit the supply of farmland, and lower on marginal, less productive land (CREA, 2024).
CAP Subsidies, Taxes, and the Real Cost of Ownership
Two cost lines matter beyond the sale price: the one-time registration tax, and the ongoing subsidy income if you actively farm the land.
Registration tax: Purchases of agricultural land in Italy carry a 15% registration tax on the price declared in the deed in most cases when the buyer is not a farmer enrolled in farm social security (reliefs exist for some farmers and some buyers under 40; see below) — well above the reduced rates for a primary residence. Budget for this as a fixed line item alongside notary fees, not an afterthought.
CAP direct payments: If you farm the land and it qualifies, EU Common Agricultural Policy payments can apply. Payments per hectare vary by entitlement and region, so ask a farm assistance centre (CAA), which keeps the farm file (fascicolo aziendale), which paying agency and rate apply to the parcel.
CAP income is one financial argument for buying working agricultural land rather than treating it purely as a residential purchase. Direct payments depend on the farm file held through a CAA and on the paying agency for your region: Italy pays through AGEA and several regional paying agencies. Eligibility and rates change between CAP periods, so ask a CAA what the parcel would receive before you budget.
Agricultural IMU is set by each municipality (and some owners are exempt), so ask the seller for recent bills and confirm with the municipality or a tax adviser. For input costs per hectare (fertilizer, irrigation, fuel), ask the seller for recent input invoices, which are a fair thing to request during due diligence.
For a broader view of how agricultural subsidies compare across markets, see our guide to US agricultural subsidies and farmer aid programs, and for the investment case more generally, 7 ways agricultural land investment can pay off.
Renting instead of buying
CREA’s 2024 summary says renting has become the preferred route for people who lack the cash to buy or want flexibility. Bank lending for buying rural property fell 3.5% in 2024, to about €268 million (Bank of Italy figures in the CREA summary). In Eurostat’s 2020 data, Italian arable land rented for €1,195 per hectare a year against a price of €35,447, a gross yield of 3.4% before tax, repairs and empty periods. Among the 12 countries with both figures that year, Italy had the highest rent per hectare. Among those 12, gross rent as a share of price ran from 0.3% in Portugal to 4.3% in Bulgaria. These are Farmonaut’s calculations from Eurostat’s two series, and each country defines rent and price in its own way.
Chart
Rent against price for arable land, selected countries, 2020
Each dot is one country; Italy is highlighted
Purchase taxes by type of buyer
The rate depends on who is buying, not on nationality. It is charged on the price declared in the deed, and the tax office can check that value against market value (NotaioFacile).
| Buyer | Registration tax | Mortgage and cadastral taxes |
|---|---|---|
| Anyone who is not a coltivatore diretto or IAP enrolled in farm social security (some buyers under 40 can qualify for the relief; ask the notary) | 15% | €50 each |
| Direct cultivator or IAP enrolled in farm social security, no five-year farming commitment | 9% | €50 each |
| Direct cultivator or IAP enrolled in farm social security who keeps the land and keeps farming it for five years, or loses the relief | Fixed amount | Fixed mortgage tax, 1% cadastral tax |
The 15% rate is in article 1, part I, of the tariff in Annex 1 to Legislative Decree 123/2025, the consolidated registration-tax code that applies from 1 January 2026 and replaced Presidential Decree 131/1986. Notary fees come on top. The land must also carry a certificate of urban use (certificato di destinazione urbanistica) from the town hall, which confirms it is zoned agricultural (NotaioFacile).
Four details sit behind the table. First, for the 15% and 9% rates the registration tax is at least €1,000 per deed, and the mortgage and cadastral taxes are €50 each (Legislative Decree 123/2025, Annex 1, part I, article 1). Second, the farmer relief known as small farm property (piccola proprietà contadina) is in article 173 of the same decree. It is for a coltivatore diretto or IAP enrolled in farm social security, with fixed registration and mortgage tax, cadastral tax at 1% and notary fees cut by half. The buyer loses it by selling or ceasing to farm the land within five years. Third, buyers under 40 who state in the deed that they will enrol in farm social security within 24 months can also qualify for the small-farm relief (article 173, paragraph 2), and young farmers can get reduced rates under article 172; ask the notary whether you qualify. Fourth, a buyer who gives up the relief in the deed pays 9% (Agenzia delle Entrate, ruling 7/2020).
Rates and rules change, and the right treatment depends on who you are and what the deed says. A notary or lawyer must confirm the tax on your purchase. This guide is not legal or tax advice.
Purchase Cost Calculator
Use the figures above to estimate your all-in cost before making an offer — enter the parcel size, price per hectare and the registration tax rate that applies to you (check it with a notary).
Try the numbers for your own farm below.
Calculator
What will an Italian farm purchase cost in total?
Enter your own price and quotes. The values shown are an example for a 5 hectare parcel.
- Land price: 100,000 EUR
- Registration tax (minimum 1,000): 15,000 EUR
- Mortgage and cadastral tax: 100 EUR
- Agency, notary, lawyer, survey, reserve: 12,000 EUR
- Costs on top of the price: 27.1%
Example values only, not benchmarks. Registration tax: 15% for most buyers who are not farmers enrolled in farm social security, 9% for an enrolled farmer who gives up the small-farm relief, with a minimum of €1,000 (Legislative Decree 123/2025, Annex 1; Agenzia delle Entrate, ruling 7/2020). Mortgage and cadastral tax are fixed in the formula at €50 each. The reliefs for enrolled farmers, young farmers and some buyers under 40 use other amounts and are not covered. Tax is charged on the price declared in the deed, here the price you enter. Agency, notary, lawyer, survey and reserve figures are placeholders: replace them with written quotes, and check whether VAT applies. Rates and rules change; a notary or lawyer must confirm the figures for your purchase. This is not legal or tax advice.
Using Satellite Data to Vet Land Before You Buy
None of the legal or price research above tells you whether a specific parcel is productive land or a marketing photo of one. Before you commit to a purchase, satellite monitoring gives you an independent read on the land’s actual condition — separate from what the listing agent or seller tells you.
- Satellite-based crop health monitoring shows vegetation vigor trends on the parcel over multiple growing seasons, not just the day the photos were taken.
- AI-driven advisory data can flag whether the soil and climate profile suit the crop the seller says it produces.
- Historical imagery reveals whether the land has been actively farmed recently or left fallow — relevant both to productivity and to whether it still qualifies as agricultural use.
- Resource management data helps you plan irrigation and input needs before you’re locked into a purchase.
Farmonaut’s web and mobile platform provides exactly this kind of independent field data, and developers integrating land-monitoring data into their own due-diligence tools can use the Farmonaut API directly.
“Five areas deserve attention when you buy farmland in Italy: language, bureaucracy, unexpected costs, shifting regulations and local customs.”
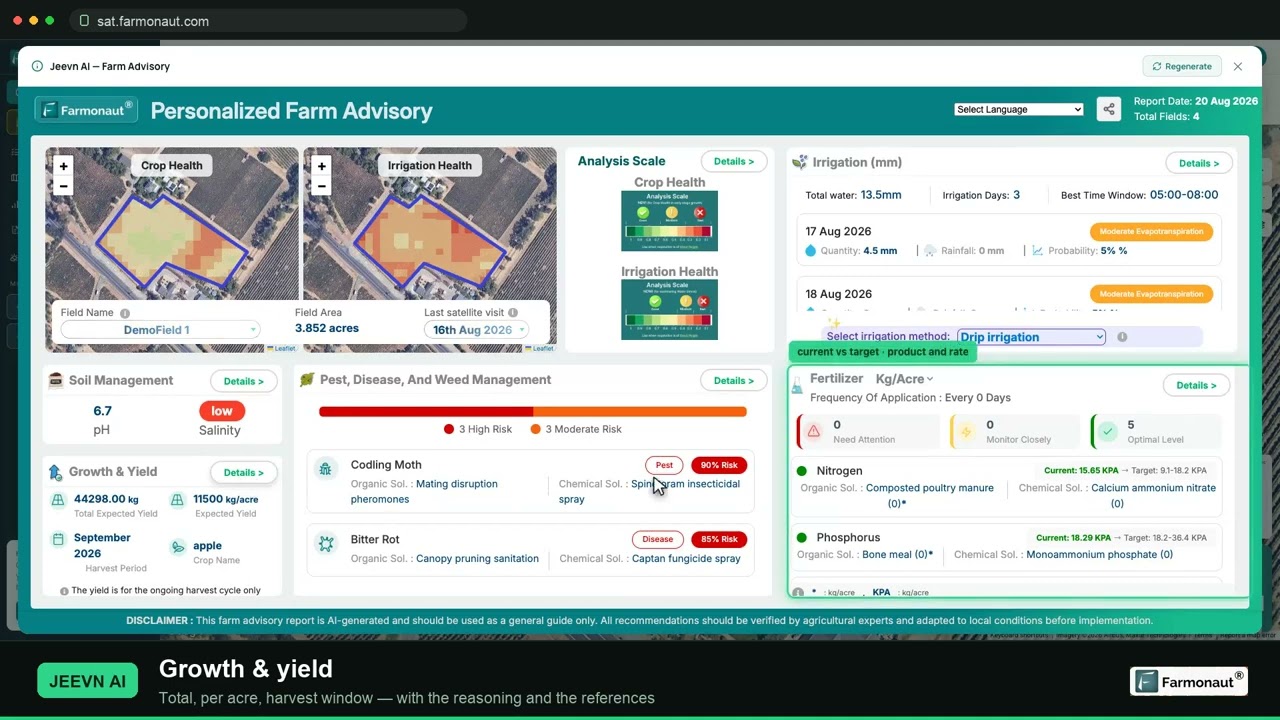
▶ A walkthrough of reading NDVI and pulling a report for one field in Farmonaut · 19:36
Overcoming the Five Common Friction Points
1. Language Barriers
Contracts, cadastral records, and negotiations are conducted in Italian. A bilingual lawyer — not a general translator — should review anything before you sign it.
2. Cultural Differences
Local customs and personal contacts can matter in a rural land sale. A local lawyer or agronomist can help you read the situation before you make an offer.
3. Bureaucratic Complexity
Paperwork varies by town and parcel. Ask your notary for a written estimate of required approvals before you commit to a timeline.
4. Unexpected Costs
Costs beyond the price can include notary and lawyer fees, surveys and taxes. Budget a reserve on top of the registration tax for costs you cannot yet quantify.
5. Changing Regulations
CAP payment rates and registration tax rules are set at the EU and national level respectively and can change between budget cycles — check the current year’s rates before budgeting.
Staying current on land-related data between visits is easier with Farmonaut’s mobile app or the API services, particularly if the parcel is far from where you currently live.
Step-by-Step: Securing an Italian Farm Purchase
This is the durable part of this guide — the sequence below doesn’t change even when prices, tax rates, or CAP payments do, so it’s worth bookmarking independent of this year’s figures:
Infographic
Buying Italian farmland in 6 steps
- 1Check the priceCompare the asking price with CREA’s area and zone averages.
- 2Hire a lawyer firstDo this before any preliminary contract (compromesso).
- 3List the rights holdersYour lawyer or notary finds tenants and neighbouring farmers with a possible claim.
- 4Wait out the noticeA holder has 30 days from receiving the registered letter to accept.
- 5Get the zoning certificateThe town hall issues the certificato di destinazione urbanistica for the deed.
- 6Sign and registerThe notary draws up the deed. Registration tax is due on the declared price.
- Research the regional price band: Use the CREA table above to sanity-check any asking price against the 2024 regional range (about €8,600 to €47,100/ha by area), then check CREA directly for the current year’s figures.
- Engage a lawyer before signing anything preliminary: Not after a preliminary contract (compromesso) is signed — before.
- Run the prelazione search: Have your lawyer or notary identify every neighboring owner with a potential claim, in writing, before you rely on a clean title.
- Verify land use and history: Confirm registered agricultural classification and pull recent satellite or historical imagery to check actual land condition.
- Budget the full cost stack: The sale price, the registration tax that applies to you, notary and lawyer fees, and a reserve for costs you cannot yet quantify.
- Confirm CAP eligibility if you plan to farm: Ask a farm assistance centre (CAA) which paying agency applies and whether the parcel qualifies for direct payments.
- Set a realistic timeline: allow at least the 30-day prelazione notice period, plus time for the zoning certificate and deed.
By working through this sequence and using tools like Farmonaut for independent land verification, you reduce two risks: an undiscovered prelazione claim, and a parcel that doesn’t match its listing.
Explore Farmonaut’s solutions:
Sustainable Farming Considerations
If you’re buying with an eye toward long-term value rather than a quick resale, sustainable management of the land matters both environmentally and financially:
- Organic certification: Italy had the third-largest organic area in the EU in 2024, about 2.5 million hectares or 19.5% of its farmland, behind Spain and France (Eurostat).
- Water management: Irrigation infrastructure and water rights vary significantly by region — confirm what’s attached to the parcel before purchase, since this is not standardized nationally.
- Biodiversity and soil health: Mixed cropping and maintained hedgerows can support long-term soil quality; ask the seller what practices the parcel has had.
- Established practices: Regional farming methods, such as terracing in hillside olive groves, can be adapted to the terrain; ask what the parcel needs to keep up.
Satellite monitoring tools can track vegetation health and resource use over time, which is useful both for managing the land post-purchase and for verifying a seller’s claims about current practices pre-purchase.
Financial Considerations for Foreign Buyers
- Purchase costs: Land price, the registration tax that applies to you on the declared price (15% for most buyers who are not farmers enrolled in farm social security), notary and lawyer fees, and a reserve for other costs.
- Ongoing expenses: Property taxes (agricultural IMU is set by each municipality and some owners are exempt, so ask the seller for recent bills and confirm with the municipality or a tax adviser), maintenance, and potential agricultural subsidy offsets if you’re comparing against US programs.
- Currency exposure: Euro-denominated purchases mean US or UK buyers carry exchange-rate risk between agreeing a price and closing.
- Financing: Italian mortgage terms for foreign non-resident buyers differ from domestic terms — confirm eligibility with an Italian bank before assuming financing is available.
- CAP income: if you farm the land and it qualifies — factor this into your return calculation, not just the purchase cost.
Chart
Arable land price: Italy and the EU27, 2013 to 2020
Thousand euro per hectare; Eurostat’s series for Italy ends in 2020
Consult a financial advisor familiar with both Italian agricultural property law and your home country’s tax treatment of foreign real estate before finalizing a budget.
Price history against the EU average
Eurostat’s arable land price series gives one yardstick for many countries. Italy’s series stops in 2020. Between 2013 and 2020 it moved between €30,569 and €40,153 per hectare, while the EU27 average rose from €9,761 to €12,361. The EU27 average reached €15,224 in 2024. Eurostat’s Italian figure uses a different method from CREA’s survey, so do not set the two side by side. Past prices say little about future ones.
The Bottom Line
Buying agricultural land in Italy is legally open to foreign buyers, priced from about €8,600/ha on the islands to €47,100/ha in the northeast (2024 CREA data), and subject to a registration tax (15% for most buyers who are not farmers enrolled in farm social security) plus a right of first refusal that some tenants and neighbouring farmers hold. Nationality rules depend on your permit and country, and the legal checks apply to everyone, so have them done before signing. Ask your lawyer to check for tenants and neighbouring farmers first, budget the tax that applies to you plus a reserve for other costs, and verify the land itself with independent data rather than the listing photos, and you reduce the one-year buy-back risk that follows a missed notice.
Frequently Asked Questions
Q: Can foreigners own agricultural land in Italy?
A: Yes. EU citizens and legally resident non-EU citizens can buy on the same terms as Italians; other non-EU buyers can buy if their country grants Italians the same right (Italian notaries’ council). Foreign buyers must comply with the same rules as Italian buyers, including the right of first refusal that some tenant farmers and neighbouring owner-farmers hold.
Q: What does “land” translate to in Italian, and does the translation matter legally?
A: “Land” translates to terreno; agricultural land specifically is terreno agricolo. The distinction matters because a parcel’s registered classification (agricultural vs. residential vs. commercial) determines which taxes, subsidies, and use restrictions apply — not the English word used in a listing.
Q: What is the right of first refusal in Italian land law?
A: Prelazione agraria gives some tenant farmers working the land, and some neighbouring owner-farmers, the right to match a sale offer on agricultural land before it can go to an outside buyer, foreign or domestic.
Q: How much does agricultural land cost in Italy?
A: CREA’s 2024 data puts the national average at €22,400/ha, ranging from about €8,600/ha in the islands to €47,100/ha in the northeast. CREA runs the survey every year, so check its site for a newer table.
Q: How long does purchasing agricultural land in Italy take?
A: There is no fixed national timeline. Qualifying neighbours and tenants have 30 days to respond to the sale notice; the rest depends on paperwork such as the zoning certificate and whether a prelazione claim is asserted.
Q: What taxes apply when buying agricultural land in Italy?
A: Most buyers who are not farmers enrolled in farm social security pay 15% registration tax on the declared price, plus €50 each in mortgage and cadastral tax; some farmers and some buyers under 40 pay less. Agricultural IMU is set by each municipality (and some owners are exempt), so ask the seller for recent bills and confirm with the municipality or a tax adviser.
Q: Are CAP subsidies available to foreign farm owners in Italy?
A: If you farm the land, it qualifies and your farm file is registered through a farm assistance centre (CAA) and the paying agency for your region, CAP direct payments can apply. The rate per hectare depends on entitlements and region.
Q: Do I need a lawyer to purchase agricultural land in Italy?
A: It isn’t a legal requirement, but it is standard practice and strongly recommended — a notary must draw up the deed, and a lawyer can check prelazione claims before you sign.
For more on how Farmonaut’s technology supports agricultural land investment decisions, visit our API Developer Docs, or get the mobile apps for Android and iOS.
Farmonaut crop monitoring
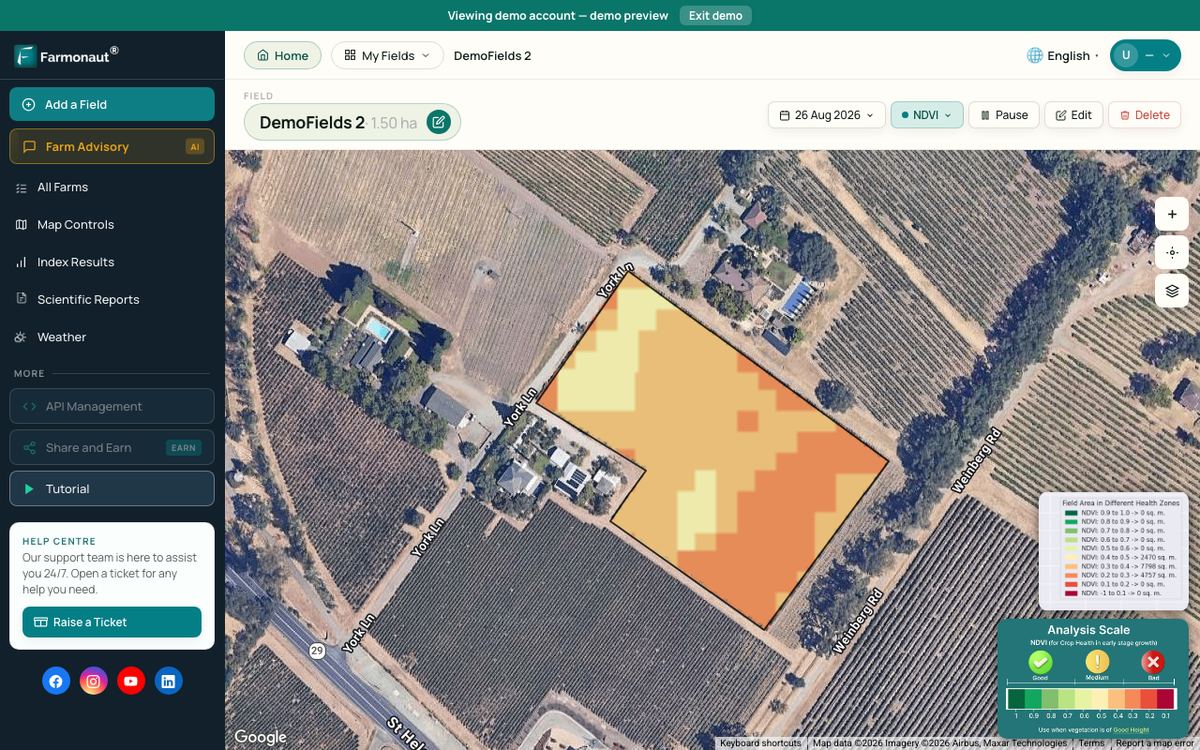
Check a parcel's crop history from space
Draw the boundary of a parcel you are considering and view satellite crop health maps for it in the Farmonaut Satellite + AI Farm Monitoring System.



Keep reading
Sources
- CREA, Terreni agricoli: mercato fondiario e degli affitti in Italia nel 2024, press release (11 November 2025): crea.gov.it
- CREA, L’andamento del mercato fondiario in Italia nel 2024, summary with Table 1 (2025): crea.gov.it
- Eurostat, Agricultural land prices by region (apri_lprc): ec.europa.eu
- Eurostat, Agricultural land renting prices by region (apri_lrnt): ec.europa.eu
- Eurostat, Crop production in EU standard humidity (apro_cpsh1), 2024: ec.europa.eu
- Eurostat, Organic crop area by agricultural production methods (org_cropar), 2024: ec.europa.eu
- Eurostat, Farms and farmland in the European Union (2023 farm structure survey): ec.europa.eu
- Italian Republic, Legislative Decree 123/2025, registration-tax code with Annex 1 tariff (applies from 1 January 2026): normattiva.it
- Agenzia delle Entrate, Risposta n. 7 (2020), small farm property relief waived in the deed: agenziaentrate.gov.it
- Confagricoltura Bologna, Prelazione del confinante: confagricoltura.org
- Consiglio Nazionale del Notariato, Notarial services for foreigners: notariato.it
- Italian Republic, DPR 394/1999, article 1 on reciprocity (copy hosted by Regione Lazio): regione.lazio.it
- NotaioFacile (Italian notaries), Acquisto terreni agricoli: regole, imposte e diritto di prelazione: notaiofacile.it
Discussion
Questions, corrections or field experience? Share them below. First-time comments are reviewed before they appear, and your email is never published.
No comments yet. Be the first to add a question or your experience.

 LatConnect 60
 Disease Free Life
 WebsEdge
 Blickwinkel
 Agricultural Credit Policy Council
 BayWa
BayWa MCSOD
MCSOD Marei Nursery
 eKGIS
eKGIS Mostas Tech
 Native Seeds
 Andex
Andex FCF India
 Unifrutti Gulf
 Deluxe Conseil
 WICO
WICO Chimera Innovation
 Licence holder · Niger · Gold
 Licence holder · Nigeria · Gold + lithium










