

AI mineral stocks · Company comparison
AI Mineral Stocks: Copper Miners and Explorers Compared
No listed company is a pure AI stock. Data centres could use 945 TWh of electricity by 2030 (IEA), which points to copper. Four copper miners and two AI explorers are compared here on their own filings.
Key takeaways
- IEA: data centres used about 415 TWh in 2024 and are projected to reach around 945 TWh by 2030 (IEA, 2025).
- Copper per megawatt is disputed: 8-10 tonnes for traditional sites and 20-40 tonnes for AI-optimised ones, per S&P Global estimates reported by Skillings.
- Freeport made 3.4 billion lb of copper in 2025, Southern Copper 2,108.2 million lb, Antofagasta 653,700 t and Lundin Mining 331,232 t (company filings).
- Ivanhoe Electric and KoBold Metals use machine learning to rank exploration targets; neither has a producing mine.
- World copper mine output was about 23 million tonnes in 2025 (USGS, estimate); a 100 MW site at 25 t per MW is about 0.01% of it.
In this article
- What the AI boom means for mineral demand
- How much copper does an AI data centre use
- Which minerals sit behind the AI build-out
- AI mineral stocks compared: four copper producers and two AI explorers
- How we chose these companies
- Copper output of the listed producers compared
- Where AI is used in mining today
- What moves these shares besides AI
- Seven checks before you rely on any mining company report
- A mineral mined for metal: what the phrase means
- Frequently asked questions
No listed company is a pure “AI mineral stock”. The shares tied to the AI build-out are copper miners, because data centres need power, cables and cooling, plus a handful of explorers that use machine learning to find deposits. The International Energy Agency (IEA) puts data-centre electricity use at about 415 terawatt-hours (TWh) in 2024, rising to around 945 TWh by 2030 (IEA, Energy and AI, 2025). This page compares four copper producers, one AI-driven explorer and one private AI explorer on what their own filings say, and gives a calculator for the copper in a data centre. It gives facts only and is not investment advice.
What the AI boom means for mineral demand
Start with the electricity numbers, because every other number follows from them. The IEA reports that data centres used about 1.5% of the world’s electricity in 2024, that the United States accounted for 45% of that use, China 25% and Europe 15%, and that data-centre use has grown about 12% a year since 2017, more than four times faster than total electricity use (IEA, 2025). In its central case, use more than doubles to around 945 TWh by 2030, and in the United States data centres account for nearly half of the growth in electricity demand to 2030. The US Department of Energy, summarising a Lawrence Berkeley National Laboratory report, says US data-centre load growth tripled over the past decade and is projected to double or triple by 2028 (DOE, December 2024).
Chart
Data-centre electricity use
Terawatt-hours per year, world
Keep the scale in view. The same IEA summary says data centres make up about one-tenth of global electricity demand growth to 2030, which is less than industrial motors, air conditioning or electric vehicles. The IEA also lists large uncertainties: how fast AI is adopted, how fast chips become more efficient, and whether grid bottlenecks clear. A miner’s order book depends on the whole electrification story, and AI is one part of it.
More power means more copper. Wires, busbars (the flat metal bars that carry heavy current inside a switchboard or rack), transformers, switchgear and liquid-cooling plates are mostly copper. Antofagasta’s annual report for 2025 describes AI-driven data-centre construction as an emerging source of copper demand, with copper used in power distribution, cooling and server infrastructure (Antofagasta annual report 2025).
Supply is the other half. The IEA’s critical minerals outlook says copper prices reached record highs in the first months of 2026, and that the projected copper supply deficit in 2035 has narrowed to around 25% from around 30% a year earlier as new projects advance, particularly in the Democratic Republic of the Congo and Zambia (IEA, Global Critical Minerals Outlook, 2026). Tight supply is why copper miners, not software firms, sit at the centre of this topic.
Our own film on the wider economics of mining shows where the money goes, from exports and jobs to the metals the energy transition needs.
▶ Follows the money from the ground up: exports, jobs, revenue and energy-transition minerals. · 5:03
How much copper does an AI data centre use
There is no single agreed figure, and some of the widely repeated ones are wrong. The Skillings Mining Review reports that traditional data centres needed 8 to 10 tonnes of copper per megawatt (MW) of capacity, and that S&P Global estimates modern AI-optimised sites need 20 to 40 tonnes per MW, because racks draw far more current and use liquid cooling (Skillings Mining Review). Those ranges include power distribution, cooling and cabling, not only the servers.
Chart
Copper per megawatt of data-centre capacity
Tonnes of copper per MW, reported ranges
A second claim shows why you should check the unit. A technical brief that circulated in 2025 appeared to say the rack busbars of a one-gigawatt data centre could need half a million tons of copper. Analysts pointed out that the same brief gives about 200 kilograms of busbar copper per megawatt, which is about 200 tonnes for a gigawatt, and that “half a million pounds” (roughly 226 tonnes) was almost certainly the intended figure (investingLive, 13 January 2026). The busbars are one small part of a site, so the two sets of numbers do not contradict each other, but the typo inflated headlines by a factor of about 2,500.
The calculator below lets you set your own tonnes-per-MW figure and see what it means against world mine output. The default shows a 100 MW site at 25 tonnes per MW, which is an example, not a benchmark.
Calculator
How much copper would your data centre need?
Enter a capacity and a copper intensity from your own source.
- Share of 2025 world mine output (%): 0.01
- Value at your price (US$): $27,557,750
Example values only, not a benchmark. World mine output of 23 million tonnes is the USGS Mineral Commodity Summaries 2026 estimate for 2025 (rounded). The price is an input: example, use today’s price. Money is in US$.
Which minerals sit behind the AI build-out
Copper is the largest volume. According to the US Geological Survey (USGS), world copper mine production was about 23 million tonnes in 2025 (estimate, rounded), led by Chile at 5.3 million tonnes, the Democratic Republic of the Congo at 3.2 million, Peru at 2.7 million, China at 1.8 million and the United States at 1.0 million (USGS Mineral Commodity Summaries, 2026). USGS also reports that the United States relied on imports for 57% of its apparent copper consumption in 2025 (estimate).
The second group is by-product metals. Gallium is a good example of a “mineral mined for metal” that nobody mines for itself. USGS says primary gallium is recovered mostly as a by-product of processing bauxite (aluminium ore), and sometimes from zinc ore (USGS gallium summary, 2026). In the United States, integrated circuits made from gallium compounds took 73% of domestic gallium use, and the listed uses include high-performance computers. USGS reports that the United States had no domestic primary gallium production and 100% net import reliance in 2025, with imports of gallium metal estimated at 25,000 kilograms at an average import value of US$580 per kilogram.
What follows for stocks: the by-product metals are small markets, so the exposure in this table is mostly copper, plus silver, zinc and molybdenum that copper mines produce on the side.
AI mineral stocks compared: four copper producers and two AI explorers
The table lists each company’s market, what it mines, its latest filed output and its AI or data angle. All figures come from the company documents linked in the sources list. Share prices are not shown, and nothing here is a recommendation.
| Company | Listing | Main product | Latest filed output | AI or data angle |
|---|---|---|---|---|
| Freeport-McMoRan | NYSE: FCX | Copper, gold, molybdenum | 3.4 billion lb copper in 2025; 786 million lb in Q2 2026 | Reports leach and technology initiatives; no AI claim in the release |
| Southern Copper | NYSE and BVL: SCCO | Copper, molybdenum, zinc, silver | 2,108.2 million lb mined copper in 2025; 461,206 t in H1 2026 | 2025 annual report names AI as a business risk and an opportunity to improve processes |
| Antofagasta | London Stock Exchange: ANTO | Copper, gold | 653,700 t copper in 2025; 285,000 t in H1 2026 | Machine-learning SAG mill system at Los Pelambres |
| Lundin Mining | TSX: LUN; Nasdaq Stockholm: LUMI | Copper, gold | 331,232 t copper in 2025; 76,877 t in Q2 2026 | Growth projects; no AI claim in the release |
| Ivanhoe Electric | NYSE American and TSX: IE | Explorer (copper projects) | No production | Machine-learning subsurface imaging |
| KoBold Metals | Private, not listed | Explorer and developer | No mine in production | Proprietary AI targeting |
The sections below give the facts behind each row, with a “best for” line for readers who sort by business model. These lines describe the type of exposure, not a view on the shares.
Freeport-McMoRan (NYSE: FCX)
Best for: readers who want the largest listed copper output in the table, with gold and molybdenum alongside. Freeport reported 786 million pounds of copper, 192 thousand ounces of gold and 23 million pounds of molybdenum produced in the second quarter of 2026, an average realised copper price of US$6.17 per pound and unit net cash costs of US$1.97 per pound (Freeport, 23 July 2026). It expects 2026 copper sales of about 3.1 billion pounds. Its 2025 annual report says copper made up 75% of 2025 revenue and that the Morenci, Cerro Verde and Grasberg mines together gave 70% of consolidated copper production (Freeport 10-K, 2025).
Pros: scale, a large US copper base and a diversified product mix. Cons: the company is still ramping up the Grasberg block cave after the September 2025 mud rush incident at PT Freeport Indonesia, so volumes depend on that restart.
Southern Copper (NYSE and BVL: SCCO)
Best for: readers who want copper with large by-product credits. Southern Copper reported record second-quarter 2026 net sales of US$4,289.0 million and net income of US$1,670.0 million, helped by higher LME copper (up 39.8%) and silver prices (Southern Copper, 21 July 2026). Copper output fell 3.8% in the first half to 461,206 tonnes, mainly from lower ore grades at Peruvian mines. Its 2025 annual report gives mined copper of 2,108.2 million pounds, down 1.8% from 2024 (Southern Copper 10-K, 2025).
Pros: by-product revenue lowered its operating cash cost per pound of copper to US$0.05 in the second quarter of 2026. Cons: falling ore grades in Peru reduce copper volumes, and the profit swing depends on metal prices.
Antofagasta (London Stock Exchange: ANTO)
Best for: readers who want a Chilean copper pure play with documented machine-learning use. Antofagasta reported 285,000 tonnes of copper in the first half of 2026, down 9% year on year, with lower grades at Los Pelambres and Centinela (Antofagasta half-year results, 13 August 2026). Its 2025 report records 653,700 tonnes for the year and describes a machine-learning system at the Los Pelambres SAG mill (the large rotating drum that grinds ore) that raised unconstrained operating hours by about 4% compared with 2024. The projects at Centinela and Los Pelambres are due to finish commissioning in 2027 and are expected to lift copper production by 30%.
Pros: a documented operational use of AI and a defined growth pipeline. Cons: first-half output fell, and the growth depends on the 2027 commissioning dates holding.
Lundin Mining (TSX: LUN; Nasdaq Stockholm: LUMI)
Best for: readers who want a mid-size copper producer with a large development project. Lundin produced 76,877 tonnes of copper and 33,427 ounces of gold in the second quarter of 2026 at a consolidated cash cost of US$2.11 per pound, and kept its 2026 copper guidance of 310,000 to 335,000 tonnes (Lundin Mining, 5 August 2026). It produced 331,232 tonnes of copper in 2025 (Lundin Mining, 21 January 2026). It is targeting a Stage 1 sanction decision for the Vicuña project in Argentina by the end of 2026.
Pros: production has met guidance three years running, according to the company. Cons: a large share of its growth sits in one project that has not yet been approved for construction.
Ivanhoe Electric (NYSE American and TSX: IE)
Best for: readers who want to understand a listed explorer built around geophysics and machine learning. Ivanhoe Electric describes itself as a US company that combines exploration technology with electric-metals projects, headlined by the Santa Cruz copper project in Arizona and the Tintic copper-gold project in Utah, plus a 50/50 joint venture with Ma’aden on about 48,500 square kilometres in Saudi Arabia (Ivanhoe Electric). Its Typhoon survey system is described as detecting sulfide minerals containing copper, nickel, gold and silver at depths over 1.5 kilometres (Ivanhoe Electric, Typhoon), and its subsidiary Computational Geosciences uses convolutional neural networks and other machine-learning methods to build 3D subsurface models (Computational Geosciences page).
Pros: a direct, documented AI method and US copper projects. Cons: it has no production, so its results depend on drilling, permits and financing rather than on metal sales.
KoBold Metals (private)
Best for: readers tracking the most visible AI explorer, even though no shares are listed. Miningmx, citing Bloomberg, reported in May 2026 that KoBold broke ground on the Mingomba copper project in Zambia, a project Miningmx puts at $2.3 billion, expected to reach more than 300,000 tonnes of copper a year, after using proprietary AI to find a high-grade resource deep underground (Miningmx, 5 May 2026). The same report notes KoBold had not yet brought a mine into production and faces deep, wet underground conditions at roughly 1,700 metres below surface.
Pros and cons: it shows what an AI-first explorer can do from target to mine plan, but it is private, so there is no ticker and no public financial filings to compare.
▶ Explains the three jobs an AI mining app can do and who builds one. · 3:52
How we chose these companies
We used three tests. First, the company must report copper output in a filing dated 2025 or 2026. Second, it must sit in one of two groups: producers with a stated link to data-centre or AI demand in their own reports, or explorers with a documented machine-learning method. Third, we kept the list short enough that every figure could be traced to a primary document.
The list leaves out many large miners that also sell copper to the same markets, for example the diversified majors, because their copper is a smaller share of revenue. It also leaves out exchange-traded funds and royalty companies, which carry different risks. If you extend the list, apply the same tests and record the filing date next to each number.
Copper output of the listed producers compared
The producers differ in size by a factor of about five. The chart shows full-year 2025 copper output as filed: Freeport’s figure is converted from 3.4 billion pounds (rounded in the filing), Southern Copper’s from 2,108.2 million pounds of mined copper, while Antofagasta and Lundin report tonnes directly. Lundin’s figure is on a 100% basis, so it can differ from attributable output. Together the four add up to about 3.5 million tonnes, roughly 15% of the 23 million tonnes of world mine production that USGS estimates for 2025.
Chart
Copper produced in 2025, by company
Thousand tonnes; Freeport and Southern Copper converted from pounds
Where AI is used in mining today
Three uses are documented in company or agency sources. The first is plant optimisation: Antofagasta’s machine-learning system at a grinding mill is a concrete example with a stated result. The second is exploration targeting, where Ivanhoe Electric and KoBold train models on geophysical and geological data to rank drill targets. The third is finance: the IEA notes that venture capital investment into mining recovered in 2025 and is increasingly aimed at AI technologies that could make mineral exploration and resource development more efficient (IEA, 2026).
Be careful with claims. A model can rank where to drill, but only a drill hole proves grade and width. KoBold’s Mingomba, which the company bought in December 2022, is the best-known example of AI-guided targeting, and the report on it notes that engineering studies were not yet complete when construction began. Treat any “AI finds the deposit” headline as an exploration result, not a resource estimate.
The explainer below covers what AI can and cannot do in exploration, in plain terms.
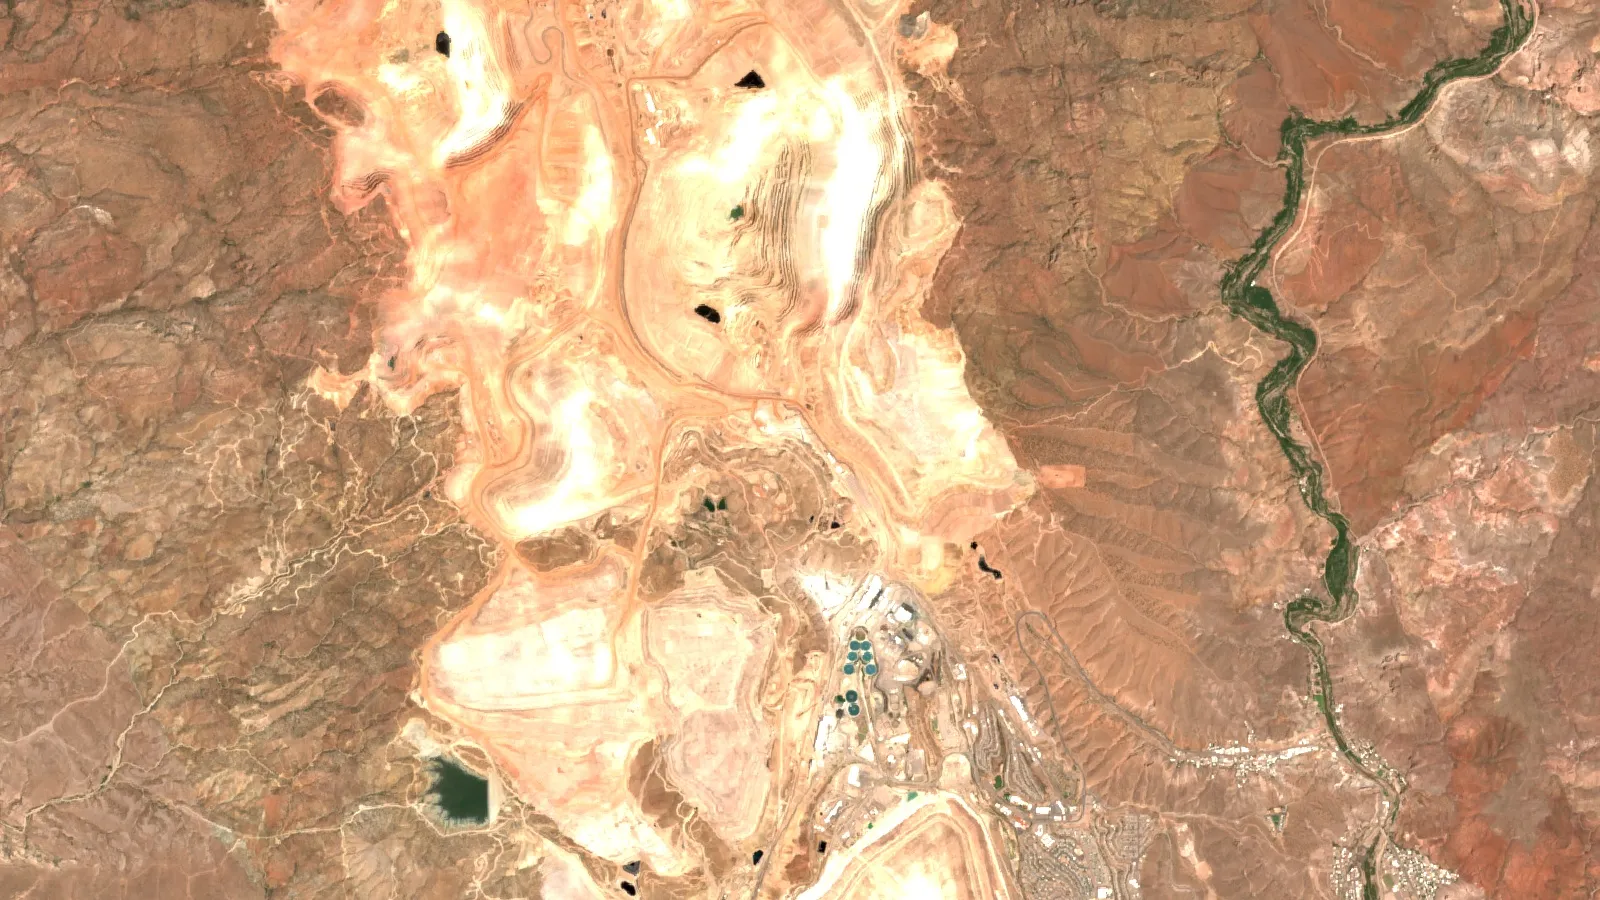
Satellite data is a lower-cost way to screen a licence area before drilling. Farmonaut applies this to licence boundaries and delivers results as exploration targets that sit ahead of any resource estimate. See our guide to automated mining and our overview of mining technology for the equipment side.
▶ What AI does in mineral exploration, where it fails and how to check a claim. · 4:37
What moves these shares besides AI
Three factors matter more than the AI story for most of these companies: the copper price, ore grade and one-off operating events. USGS data shows the London Metal Exchange (LME) annual average copper price, which was 440 US cents per pound in 2025 (estimate), up from 414.7 in 2024 and 384.8 in 2023 (USGS, 2026). Freeport’s realised price of US$6.17 per pound in the second quarter of 2026 shows how far the market moved after 2025.
Chart
LME copper price, annual average
US$ per pound
Grade and events decide volumes. Southern Copper attributes its 2026 volume decline to lower ore grades; Freeport’s output was affected by the Grasberg incident; Antofagasta’s first-half fall came from lower grades and the timing of maintenance. None of these is an AI effect. For a longer look at how copper deposits form and where new ones are found, see our guides to porphyry copper deposits and junior copper exploration. For a list of the largest producers by value, see the largest copper companies.
Other metals matter too. Our overview of gold and mineral mining innovations covers the gold side, and our guide to the environmental effects of mining explains the land and water costs that permits must address. Each mine in this table has to meet those rules before it can expand.
Seven checks before you rely on any mining company report
- Find the unit. Copper is reported in pounds, tonnes and kilotonnes; one tonne is about 2,204.6 pounds.
- Check the basis. A “100% basis” figure counts partners’ shares, while “attributable” counts only the company’s share.
- Match the period. Compare a quarter with a quarter, not with a full year.
- Read the cost definition. “Unit net cash cost” and “cash cost” subtract by-product credits and are not the same as total cost.
- Separate producers from explorers. An explorer has no sales until a mine is built, which often takes more than a decade.
- Look for the AI claim in the filing. If the annual report does not mention it, treat the claim as unproven.
- Use the regulator’s database. SEC EDGAR for US filers, SEDAR+ for Canadian ones, the London Stock Exchange news service for UK ones.
A mineral mined for metal: what the phrase means
A mineral mined for metal is an ore mineral: a mineral that holds enough metal to be extracted at a profit. Copper comes mostly from sulfide minerals in porphyry deposits, aluminium from bauxite, and gallium from the processing waste stream of bauxite and zinc ores. Whether a mineral counts as ore depends on grade, price and processing cost, so the same rock can be waste in one year and ore in another. That is why every mining company reports reserves, the part of a deposit it can mine at a profit, separately from resources.
For a closer look at a related question, see our guide: Copper Mining Stocks: 13 Producers Compared.
Frequently asked questions
Which metals matter most for AI data centres?
Copper is the largest by volume, used in power distribution, busbars, transformers and cooling. Gallium, used in chips and power electronics, is a small by-product market. The IEA says renewables and natural gas take the lead in meeting data-centre electricity demand, so grid and generation metals matter alongside chip metals.
How much copper does a data centre use?
Skillings Mining Review cites 8 to 10 tonnes per MW for traditional sites and S&P Global estimates of 20 to 40 tonnes per MW for AI-optimised ones. A 100 MW site at 25 tonnes per MW would use about 2,500 tonnes, roughly 0.01% of 2025 world mine output.
Are there pure AI mineral stocks?
Not among the companies in this table. The listed names are copper miners that sell to the same grids and data centres, plus explorers that use machine learning. Neither group sells AI products.
Which listed company produces the most copper here?
Freeport-McMoRan, at 3.4 billion pounds (about 1.5 million tonnes) in 2025, followed by Southern Copper at 2,108.2 million pounds, Antofagasta at 653,700 tonnes and Lundin Mining at 331,232 tonnes.
Does AI really find new mines?
It ranks targets from geophysical and geological data. Miningmx, citing Bloomberg, reports that KoBold used AI to identify a high-grade copper resource at Mingomba in Zambia, and construction has begun, but it has not produced metal yet. Only drilling and resource estimates confirm a deposit.
What does “net cash cost” mean?
It is the cost to mine and sell a pound of copper, after subtracting income from by-products such as gold or silver. Freeport reported US$1.97 per pound for the second quarter of 2026. It leaves out many costs, such as depreciation and exploration.
Where do I check a miner’s production figures?
Use the company’s quarterly report and its exchange filings: SEC EDGAR for US filers, SEDAR+ for Canadian filers, and the regulatory news service of the London Stock Exchange for UK filers. USGS publishes world totals in its yearly Mineral Commodity Summaries, and the 2026 edition is dated February 2026.
How does copper demand from data centres compare with total supply?
Small today. At 25 tonnes per MW, even 1,000 MW of new capacity would need 25,000 tonnes, about 0.1% of one year’s world mine output. The IEA’s concern is the wider electrification load and the 25% projected deficit in 2035, not data centres alone.
Can satellite data help find copper?
Satellites map surface rock, alteration and structure, which helps rank areas before fieldwork. Results are exploration targets, not a resource estimate or a mining permit, and only drilling can prove a deposit.
Is this investment advice?
No. This page gives filed facts with dates and sources. It does not weigh your goals or risk tolerance, and it names no price targets. Not investment advice: check the filings and speak to a licensed adviser before you buy or sell shares.
This page is for information only. It is not investment advice. It gives no share prices or targets and does not consider your goals, tax or risk tolerance. Check each company’s own filings and speak to a licensed adviser before you invest.
Farmonaut mining
Screen a licence area from space before drilling
Investors can see how satellite data screens a licence area for minerals as an exploration target, ahead of any resource estimate.

Mining Pro sample view, synthetic data
Keep reading
Sources
- IEA, Energy and AI, executive summary (2025): iea.org
- IEA, Global Critical Minerals Outlook, executive summary (2026): iea.org
- US Department of Energy, report on data-centre electricity demand (Lawrence Berkeley National Laboratory): energy.gov
- USGS, Mineral Commodity Summaries 2026: copper: pubs.usgs.gov
- USGS, Mineral Commodity Summaries 2026: gallium: pubs.usgs.gov
- Freeport-McMoRan, second-quarter 2026 results (23 July 2026): s22.q4cdn.com
- Freeport-McMoRan, Form 10-K for 2025: s22.q4cdn.com
- Southern Copper, second-quarter 2026 results (21 July 2026): southerncoppercorp.com
- Southern Copper, Form 10-K for 2025: southerncoppercorp.com
- Southern Copper, 2025 annual report (Form ARS): sec.gov
- Antofagasta plc, half-year results (13 August 2026): data.fca.org.uk
- Antofagasta plc, annual report 2025: antofagasta.co.uk
- Lundin Mining, second-quarter 2026 results (5 August 2026): thelundingroup.com
- Lundin Mining, 2025 production results and 2026 guidance (21 January 2026): lundinmining.com
- Ivanhoe Electric, company website: ivanhoeelectric.com
- Ivanhoe Electric, Computational Geosciences: ivanhoeelectric.com
- Miningmx, KoBold breaks ground on Zambia copper mine (5 May 2026): miningmx.com
- Skillings Mining Review, The 40-Ton Rule: skillings.net
- investingLive, The 500,000-ton typo (13 January 2026): investinglive.com
- Ivanhoe Electric, Typhoon technology: ivanhoeelectric.com
Discussion
Questions, corrections or field experience? Share them below. First-time comments are reviewed before they appear, and your email is never published.
No comments yet. Be the first to add a question or your experience.

 Jaunita Erss Ltd
 Almosi SARL
 SRK Consulting
 Berks Gold Limited
 Mwerezi Minerals Company Limited
 Mining SARL
 SenGold Invest SAS
 Sean Mining Limited
 NTS Group (Pty) Ltd
 Mine4Africa
 Lithspo Minerals Limited
 Tintina Mining Group
 Dalgety Minerals Pty Ltd
 Vortex Minerals Pty Ltd
 Faith At Work (Pty) Ltd
