

Gold producers · Company comparison
Gold Miner Stocks Compared: Output, AISC and Guidance
On filed 2025 results Newmont produced the most gold (5.89 Moz) and Agnico Eagle reported the lowest AISC of the large producers (US$1,339 per ounce). Seven producers compared on their own numbers.
Key takeaways
- Newmont reported 5.89 million ounces attributable in 2025; Agnico Eagle 3.45 Moz, Barrick 3.26 Moz, AngloGold Ashanti 3.09 Moz (company filings, 2026).
- 2025 AISC ranged from US$1,339 (Agnico Eagle) to US$1,709 per ounce (AngloGold Ashanti); definitions differ by company.
- All six large producers guide AISC higher for 2026, by about 10% to 24% at the midpoint.
- The World Gold Council put global average AISC at US$1,785 per ounce in Q1 2026.
- Barrick Mining Corporation now trades as NYSE: B, not GOLD.
In this article
- How we chose these gold miners and how we compare them
- Large listed gold miners side by side
- The seven gold miners in detail
- Gold miners compared output
- AISC compared: results against guidance
- How much margin per ounce do the guidance numbers imply
- Calculator: what an AISC means at your gold price
- What drives gold miner results besides the gold price
- What gold miners do: from rock to bar
- Risks and checks before you compare any gold miner
- Where satellite screening fits for investors and explorers
- Frequently asked questions
The largest listed gold producers differ far less in ounces than in cost. On filed 2025 results, Newmont mined the most gold at 5.89 million ounces (Moz), and Agnico Eagle reported the lowest all-in sustaining cost (AISC) of the large producers at about US$1,313 to US$1,339 per ounce, depending on the definition. This page compares seven listed producers on what they filed: output, AISC and their own 2026 guidance. It gives facts, not buy or sell calls.
Those seven are Newmont, Agnico Eagle, Barrick, AngloGold Ashanti, Gold Fields, Kinross and Northern Star. Together the first six produced about 20.1 Moz in 2025, which is roughly 19% of the 3,300 tonnes of world mine output that the USGS estimates for 2025. The sum mixes attributable and gold-equivalent figures, so read it as a size check, not an exact share.
AISC is the cost figure investors quote most. The World Gold Council guidance on all-in sustaining costs defines it as the cost of mining and selling an ounce, including the capital needed to keep a mine running, but not growth projects. For a deeper look at what goes into the number, see our guide to the gold production cost per ounce and the mining cost curve.
How we chose these gold miners and how we compare them
We kept the screen simple so that anyone can repeat it. A company is on the list if it meets all four tests.
- It is listed on a major exchange (NYSE, TSX, JSE or ASX) and mines gold as its main business, so copper and iron ore groups are out.
- Its latest full-year results are public and we could open the filing: a 2025 annual or fourth-quarter release, or, for Northern Star, the year to 30 June 2026.
- It publishes production, AISC and forward guidance, so every number below traces to one company document.
- It ranks among the largest by reported gold output in the filings we opened. Zijin and some other large Chinese and Russian producers are not covered because we did not open comparable filings for them.
We did not rank by share price, price targets or analyst ratings. Prices change daily and say nothing about mine quality. Output and cost come from each company’s own definition, so differences of a few percent between companies are not meaningful.
Three terms first. Attributable ounces are the company’s share of a mine or joint venture, not the full mine. Gold-equivalent ounces convert by-product copper or silver into a gold amount at set prices. Guidance is the range a company expects to deliver in the coming year, and companies set it against a stated gold price.
Large listed gold miners side by side
The table shows each company’s filed 2025 result and its 2026 guidance. Output is in million ounces (Moz). AISC is in US dollars per ounce, except Northern Star, which reports in Australian dollars and is shown separately below.
| Company and listing | 2025 gold output | 2025 AISC (US$/oz) | 2026 output guidance | 2026 AISC guidance (US$/oz) |
|---|---|---|---|---|
| Newmont (NYSE: NEM) | 5.89 Moz attributable | 1,358 by-product basis | About 5.3 Moz, plus or minus 5% | 1,680, plus or minus 5% |
| Agnico Eagle (NYSE and TSX: AEM) | 3.45 Moz payable | 1,339 (1,313 on revised definition) | 3.3 to 3.5 Moz a year, 2026 to 2028 | 1,400 to 1,550 |
| Barrick Mining (NYSE: B; TSX: ABX) | 3.26 Moz | 1,637 | 2.90 to 3.25 Moz | 1,760 to 1,950 |
| AngloGold Ashanti (NYSE: AU; JSE: ANG) | 3.09 Moz | 1,709 | 2.80 to 3.17 Moz | 1,780 to 1,990 |
| Gold Fields (NYSE and JSE: GFI) | 2.44 Moz attributable gold-equivalent | 1,645 | 2.40 to 2.60 Moz | 1,800 to 2,000 |
| Kinross (NYSE: KGC; TSX: K) | 2.01 Moz gold-equivalent | 1,571 | About 2.0 Moz, plus or minus 5% | 1,730, plus or minus 5% |
| Northern Star (ASX: NST) | 1.54 Moz sold, year to June 2026 | A$2,698 (year to June 2026) | See company reports | Reported in A$ |
Sources: company filings opened in October 2026, linked in each profile below. Newmont and Barrick figures are from Newmont’s fourth-quarter release and Barrick’s results release. Guidance gold price assumptions differ: US$4,500 per ounce for Newmont, Agnico Eagle, Barrick and Kinross, about US$4,250 for AngloGold Ashanti and US$5,000 for Gold Fields.
The seven gold miners in detail
Each profile gives a best-for line, then pros and cons taken from the filings. Order follows 2025 output.
1. Newmont: the largest producer by ounces
Best for: readers who want the biggest pure-scale gold producer, with copper as a side product. Newmont reported 5.89 Moz of attributable gold in 2025 at an AISC of US$1,358 per ounce on a by-product basis (its co-product AISC was US$1,609). Its operating statistics show Cadia and Boddington also made 82 and 24 thousand tonnes of copper.
- Pros: the largest output in this comparison, a spread of mines across several countries, and copper credits that lower its by-product cost.
- Cons: output fell from 6.85 Moz in 2024 to 5.89 Moz in 2025, and 2026 guidance of about 5.3 Moz is lower again. The AISC guidance of US$1,680 is about 24% above the 2025 result.
2. Agnico Eagle: the lowest-cost large producer
Best for: readers who value steady output and low reported costs. Agnico Eagle’s 2025 results show 3,447,367 payable ounces, total cash costs of US$979 and AISC of US$1,339 per ounce. It guides to 3.3 to 3.5 Moz a year from 2026 to 2028.
- Pros: the lowest AISC guidance in the group (US$1,400 to US$1,550) and flat three-year output guidance.
- Cons: the company expects costs to rise about 12% in 2026, around 60% of it from royalties and a strong Canadian dollar.
3. Barrick Mining: gold and copper under a new name
Best for: readers who want a gold-and-copper producer in the middle of a restructuring. The company is now Barrick Mining Corporation (NYSE: B; TSX: ABX), no longer Barrick Gold with the ticker GOLD. Its 2025 release reports 3.26 Moz of gold at an AISC of US$1,637 per ounce, and 220 thousand tonnes of copper.
- Pros: copper output (guided at 190 to 220 thousand tonnes for 2026) diversifies revenue, and, as of its February 2026 release, the board was preparing a stock-market listing of its North American gold assets, expected by late 2026.
- Cons: gold output was 17% lower in 2025 than in 2024. The 2026 range of 2.90 to 3.25 Moz compares with 3.03 Moz in 2025 once the sold Hemlo and Tongon mines are excluded. AISC guidance of US$1,760 to US$1,950 is the third highest of the six midpoints.
4. AngloGold Ashanti: global gold from a US primary listing
Best for: readers who want a geographically wide producer with a South African heritage. The company moved its primary listing to the New York Stock Exchange (NYSE: AU) in 2023 and keeps a secondary listing in Johannesburg (JSE: ANG). Its 2025 earnings release gives 3,091 thousand ounces and an AISC of US$1,709 per ounce.
- Pros: a large output near 3 Moz and 2026 guidance of 2.80 to 3.17 Moz.
- Cons: the highest 2025 AISC among the six large producers, and 2026 guidance of US$1,780 to US$1,990.
5. Gold Fields: output growth with the highest cost guidance
Best for: readers comparing producers on output growth. Gold Fields’ 2025 results show 2,438 thousand attributable gold-equivalent ounces and an AISC of US$1,645 per ounce. It guides to 2.40 to 2.60 Moz in 2026.
- Pros: output at the top of its own 2025 guidance range, and a guidance range that holds output flat to higher.
- Cons: the highest AISC guidance in the group at US$1,800 to US$2,000, and a guidance price of US$5,000 per ounce, well above the US$4,500 that four peers used, so its figures are less like-for-like.
6. Kinross: the smallest of the large six
Best for: readers who want a mid-sized producer on a gold-equivalent basis. Kinross reported 2,012,106 gold-equivalent ounces produced in 2025 and an AISC of US$1,571 per gold-equivalent ounce sold.
- Pros: 2025 AISC was the third lowest of the six, behind Agnico Eagle and Newmont, and 2026 guidance is about 2.0 Moz, close to 2025.
- Cons: the lowest output of the six and a guided AISC of US$1,730, up about 10%. Equivalent ounces depend on the by-product prices assumed.
7. Northern Star: the Australian entry
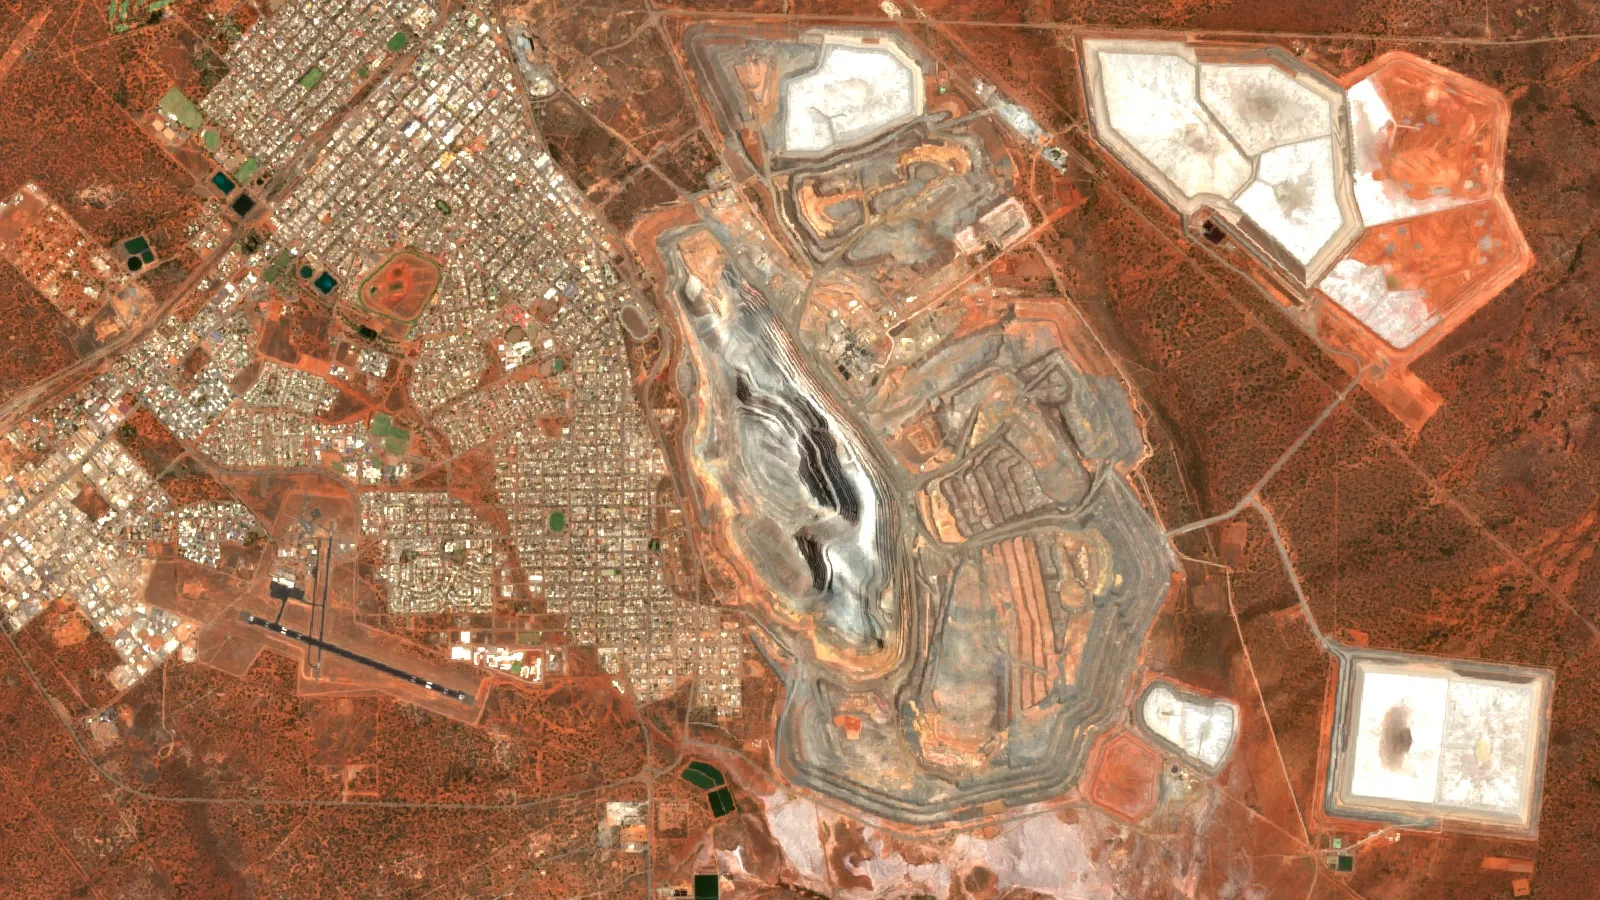
Best for: readers who want an Australia-listed producer reporting in Australian dollars. For the year to 30 June 2026 Northern Star sold 1,543 thousand ounces, in line with its revised guidance of above 1,500 thousand ounces. Output came from the Kalgoorlie centre (844 thousand ounces, including 468 thousand from KCGM, the Super Pit), Yandal (434) and Pogo in Alaska (265).
- Pros: cash and bullion of A$1,235 million at 30 June 2026, and a mill expansion at KCGM from 13 to 27 million tonnes a year whose Stage 1 commissioning was underway and on schedule, per its June 2026 quarterly report (29 July 2026).
- Cons: it reports in Australian dollars to a June year, so it does not line up with the US-dollar, calendar-year table. The report gives FY26 AISC of A$2,698 per ounce (June quarter A$2,651), within its original guidance range; Australian-dollar costs are not directly comparable with the US-dollar table. For other Australia-listed names, see our page on Australian mining stocks across metals.
Gold miners compared output
The bar chart below ranks the seven by the ounces they reported. Newmont produced about 2.4 Moz more than Agnico Eagle, the second largest. Agnico Eagle, Barrick and AngloGold Ashanti sit within about 0.4 Moz of each other.
Chart
Gold output of seven producers
Million ounces; 2025 filings, except Northern Star (year to June 2026); bases differ (attributable, payable, gold-equivalent)
AISC compared: results against guidance
Every producer with a full-year 2025 AISC guides higher for 2026. Using the midpoint of each range, Newmont rises about 24%, Gold Fields 15%, Barrick 13%, Agnico Eagle 12%, AngloGold Ashanti 10% and Kinross 10%. The WGC reports that the global average AISC reached US$1,785 per ounce in the first quarter of 2026, the 28th year-on-year rise in a row, with royalties the biggest driver.
Chart
Global average gold AISC, four quarters
US$ per troy ounce, quarterly
Chart
AISC: 2025 result against 2026 guidance midpoint
US$ per ounce; each company’s own definition and gold price assumption
Royalties rise with the gold price. A company that guides to a higher price therefore tends to guide to a higher cost, which is why the 2026 figures are not a sign that mines have suddenly become less efficient. Other drivers named in the filings include a strong Canadian dollar (Agnico Eagle), lower grades at some open pits and higher consumables prices.
How much margin per ounce do the guidance numbers imply
A simple check is the gap between the gold price a company assumed and its own AISC midpoint. For the four companies that used US$4,500 per ounce, the gap is about US$3,025 for Agnico Eagle, US$2,820 for Newmont, US$2,770 for Kinross and US$2,645 for Barrick. The chart shows this gap.
Chart
Assumed gap between gold price and AISC
US$ per ounce; US$4,500 assumed price minus 2026 AISC guidance midpoint; before tax, depreciation and growth capital
This is not profit. Tax, depreciation, interest, growth capital, dividends and hedging all come after AISC. It does show how much room a producer has before a price fall pushes it to break-even. Use the calculator below with your own numbers.
Calculator: what an AISC means at your gold price
Enter an annual ounces figure, a company’s AISC and a gold price. The result is the margin per ounce and the effect of a price fall. The price is an input, so use today’s price from a live source.
Calculator
What is the margin per ounce at your gold price?
Enter ounces, an AISC and a gold price. Results update as you type.
- Margin as a share of price: 57.5%
- Annual margin before tax and growth capital: $2,300,000,000
- Margin per ounce after the price fall: $1,800
- Annual margin after the price fall: $1,800,000,000
Example values only, not forecasts. The gold price and AISC are inputs: use today’s price and a company’s own figure. Margin here is price minus AISC, before tax, depreciation, interest and growth capital. Money is in US$.
What drives gold miner results besides the gold price
Gold producers are exposed to the gold price much more than to ounces. A 10% fall in price removes about the same share of revenue, but costs stay almost fixed, so margins fall faster than revenue. The reverse is true in a rising market. This is why the same company can look strong or weak within a few quarters.
- Royalties and taxes: governments in several countries have added price-linked royalties. See our cost guide for examples.
- Grade and mine life: the grade is the grams of gold in each tonne of rock. Falling grades push cost per ounce up. Reserves tell you how long a mine can keep producing.
- By-products: copper and silver credits cut the by-product AISC of Newmont, but a high copper price is also a risk if it falls.
- Jurisdiction: the same ore costs more or less depending on tax, power and labour rules, and some countries change them often.
- Project delivery: mill expansions, such as at KCGM, and new mines can run late or over budget.
Because exploration feeds future ounces, finding new gold matters. Our guides on the epithermal gold deposit styles and where gold is found in the United States explain where new ounces come from. Producers also depend on funding discipline, see how mining projects are financed.
What gold miners do: from rock to bar
Output and cost figures are easier to read if you know the steps behind them. Ore is drilled and blasted, crushed, dissolved in a cyanide circuit, captured on carbon and poured into bars, then refined. The video below follows one nugget through that chain.

▶ Follows one clay nugget from rock to ring: drilling, crushing, dissolving, carbon capture, melting and refining. · 5:27
Risks and checks before you compare any gold miner
- Compare like with like: by-product and co-product, per ounce sold and per ounce produced, attributable and 100% bases all give different numbers.
- Check the gold price assumption: guidance at US$4,250, US$4,500 and US$5,000 per ounce cannot be put side by side without adjusting.
- Check the currency: Northern Star and other Australian producers report in Australian dollars. A stronger local currency can raise the US-dollar cost; Agnico Eagle names the Canadian dollar as a driver.
- Read the date: all figures here are filed 2025 full-year results or guidance issued in early 2026. They will be out of date after the next quarterly reports.
- Environmental and social record: mines change land and water. The video below explains the seven impacts in plain words.
- Diversification: a single stock holds one company’s risks. Funds that hold many producers spread them, but that is a decision for you and your adviser.

▶ The seven environmental impacts of mining, explained in plain words. · 2:31
Where satellite screening fits for investors and explorers
Investors in producers usually look at filed numbers. Investors in explorers and licence owners look earlier, at whether a licence area has the rock clues that a gold system leaves behind. Satellites cannot see gold itself, but they can map iron-oxide staining, clay minerals and fault lines. Farmonaut screens an area of interest from satellite images before ground crews go in. Read about satellite-based mineral detection, use the mining quote form, or contact the team. A satellite screen produces exploration targets, not a resource estimate.
▶ What a satellite can and cannot tell you about gold. · 2:00
If this topic matters to you, read Gold Mining AISC: World Gold Council Definition & Current Data next.
Frequently asked questions
Which is the largest gold mining company by production?
On the 2025 results compared here, Newmont, with 5.89 million ounces attributable, ahead of Agnico Eagle (3.45 million) and Barrick (3.26 million). Chinese producers such as Zijin are not covered because we did not open comparable filings.
Which gold miner has the lowest all-in sustaining cost?
Of the six large producers with a 2025 AISC in this comparison, Agnico Eagle reported the lowest at US$1,339 per ounce (US$1,313 on its revised definition), and it also has the lowest 2026 guidance range. Definitions differ between companies.
What does AISC mean for a gold miner?
AISC is all-in sustaining cost: mining and processing costs plus royalties, corporate costs, reclamation and the capital needed to sustain current output, divided by ounces sold. It leaves out growth projects.
Is Barrick still called Barrick Gold?
No. It is Barrick Mining Corporation, listed on the NYSE as B and on the TSX as ABX. The old NYSE ticker was GOLD.
Are gold miner stocks the same as gold?
No. A producer earns the gap between the price it sells gold at and its costs, so its results swing more than the gold price. It also carries mine, jurisdiction and management risk that a bar of gold does not.
How is gold-equivalent production different from gold production?
Gold-equivalent output converts by-product metals such as copper or silver into a gold amount at set prices, so it can differ from pure gold ounces. Kinross and Gold Fields report this way.
Why do the cost figures look higher?
Companies expect higher royalties because the gold price is higher, plus, at Agnico Eagle, a strong Canadian dollar, and some lower grades. The World Gold Council reported a 28th straight year-on-year rise in global average AISC in the first quarter of 2026.
Do these companies pay dividends?
Several do, but yields and policies change. Check each company’s latest results release for the current dividend policy rather than relying on a summary.
What is the difference between a producer and an explorer?
A producer sells gold from working mines and reports output and costs. An explorer looks for deposits and has no output, so its value rests on drilling results and the cost of finding them.
Where can I check the numbers myself?
In each company’s annual or fourth-quarter results release, on SEC EDGAR for NYSE-listed companies, SEDAR+ for Canadian filers or the ASX announcements platform for Australian companies. Every source used here is linked at the bottom.
How much of the world’s gold do the biggest miners produce?
The first six producers compared here made about 20.1 million ounces in 2025, around 19% of the 3,300 tonnes of world mine output the USGS estimates for 2025, on a mixed attributable and gold-equivalent basis.
This page is for information only. It is not investment advice, and nothing here is a recommendation to buy or sell any security.
This page is for information only. It is not investment advice. Company figures use each company’s own definitions and are not directly comparable.
Farmonaut mining
Screen a gold licence area from space
Farmonaut screens an area of interest from satellite images before ground crews go in, and takes KML, KMZ or polygon input.

Mining Pro sample view, synthetic data
Keep reading
Sources
- Newmont, Q4 and full-year 2025 results and 2026 outlook (SEC 8-K): sec.gov
- Newmont, Q4 2025 operating statistics: s24.q4cdn.com
- Agnico Eagle, Q4 and full-year 2025 results and guidance: s205.q4cdn.com
- Barrick, full-year 2025 results (SEC 6-K): sec.gov
- AngloGold Ashanti, Q4 2025 earnings release (SEC): sec.gov
- Gold Fields, 2025 results (SEC 6-K): sec.gov
- Kinross, 2025 results (SEC 6-K): sec.gov
- Northern Star, June 2026 quarter production update (ASX): announcements.asx.com.au
- World Gold Council, record gold prices outpace rising mining costs in Q1 2026: gold.org
- World Gold Council, guidance note on all-in sustaining costs: gold.org
- USGS, Mineral Commodity Summaries 2026: Gold: pubs.usgs.gov
- World Gold Council, Gold Demand Trends Q3 2025 supply: gold.org
- World Gold Council, Gold Demand Trends full year 2025 supply: gold.org
- World Gold Council, Gold Demand Trends Q1 2026 supply: gold.org
- Northern Star, June 2026 Quarterly Activities Report (ASX, 29 July 2026): announcements.asx.com.au
Discussion
Questions, corrections or field experience? Share them below. First-time comments are reviewed before they appear, and your email is never published.
No comments yet. Be the first to add a question or your experience.

 Lithspo Minerals Limited
 Tintina Mining Group
 Dalgety Minerals Pty Ltd
 Vortex Minerals Pty Ltd
 Faith At Work (Pty) Ltd
 Geotech Mining Solutions plc
 Vulcan International Limited
 Kidepo Associates
 GKY Mining
 Alkimy SARL
 Double A Trading
 GemSprout Metals Limited
 Qader Group
 Ileys General Trading
 SG Gold Mining LLC
 VRV Global Pte Ltd
 Omsri International FZE
 G.I.T.T.
 Jaunita Erss Ltd
 Almosi SARL
 SRK Consulting
 Berks Gold Limited
 Mwerezi Minerals Company Limited

 Exploration consultancy · South Africa · Gold










