

Mineral investing · Comparison guide
Best Minerals to Invest In: 6 Compared With Data
No single mineral is best. We compare gold, silver, copper, lithium, uranium and rare earths on dated USGS and industry data, then explain four ways to hold them: metal, funds, miners and royalty companies.
Key takeaways
- China mined about 69% of the world’s rare earths in 2025 (270,000 of 390,000 tonnes); the top gold producer, also China, mined about 12% (USGS, 2026).
- Lithium’s average battery-grade carbonate price fell from US$63,700 a tonne in 2022 to an estimated US$9,000 in 2025 (USGS, 2026).
- Central banks bought 289 tonnes of gold in the second quarter of 2026, while gold funds sold a net 45 tonnes (World Gold Council, July 2026).
- Silver demand exceeded supply for a fifth year in 2025; industry use was about 58% of demand (Silver Institute, April 2026).
- ICSG expects a refined copper surplus of about 96,000 tonnes in 2026 and 377,000 tonnes in 2027 (April 2026 forecast).
In this article
- Six minerals side by side
- How we chose these six
- Gold: central banks, funds and rising mine costs
- Silver: part industrial metal, part investment metal
- Copper: a slow supply response to steady demand
- Lithium: the price swing in one chart
- Uranium: few producers and long contracts
- Rare earths: one country mines most of them
- Ways to hold a mineral: metal, funds, miners and royalties
- What to check before you commit money
- Where satellite data fits
- Frequently asked questions
There is no single best mineral to invest in, because each one answers a different question. Gold and silver are held as stores of value. Copper and lithium follow industry and energy demand. Uranium follows nuclear power plans. Rare earths follow one country’s export policy. This guide compares those six on dated supply and demand figures from the US Geological Survey (USGS), the World Gold Council, the Silver Institute, the International Copper Study Group and the World Nuclear Association, then explains the four ways to hold them.
The biggest difference between the six is how concentrated supply is. China mined about 69% of the world’s rare earths in the USGS 2025 estimate, while the largest gold producer, also China, mined about 12% of the world’s gold. The second big difference is price behaviour: lithium’s average battery-grade price fell from US$63,700 a tonne to about US$9,000 a tonne over three years, while copper’s annual average moved far less. This page gives facts and examples. It does not tell you what to buy.
Six minerals side by side
The table shows the scale of each market, who mines the most, and whether the mineral is on the US list of critical minerals. Mine output is the amount dug out of the ground in a year. Figures are for 2025 (USGS estimates) except uranium, which is the latest full year, 2024.
Chart
Share of world mine output held by the top producing country
Percent of world mine output; 2025 estimate, uranium 2024
| Mineral | World mine output | Largest producer and share | On the US critical list | Main demand driver |
|---|---|---|---|---|
| Gold | 3,300 tonnes | China, about 12% | No | Jewellery, investment, central banks |
| Silver | 26,000 tonnes | Mexico, about 24% | Yes | Industry (about 58% of 2025 demand), coins and bars |
| Copper | 23 million tonnes | Chile, about 23% | Yes | Building, electrical, transport |
| Lithium | 290,000 tonnes of lithium content | Australia, about 32% | Yes | Batteries (88% of use) |
| Uranium | 60,213 tonnes of uranium (2024) | Kazakhstan, about 39% | Yes | Nuclear reactor fuel |
| Rare earths | 390,000 tonnes of oxide | China, about 69% | Yes (neodymium, dysprosium and others are named) | Magnets |
Sources: USGS gold, silver, copper, lithium and rare earths (Mineral Commodity Summaries 2026); uranium from the World Nuclear Association; the critical list from the Federal Register notice of 7 November 2025, which names 60 minerals. Gold is not on that list. Shares are our arithmetic from the USGS tables.
How we chose these six
We kept a mineral only if it met all four tests below. This is a screen for what has good public data. It is not a ranking of expected returns, and nobody can rank those in advance.
- Traded in size: a public benchmark price exists, so a holding can be valued and sold.
- Dated data: the USGS or an industry body publishes recent production figures, so every number here has a source and a year.
- More than one route to hold it: metal, funds, miners or royalty companies are available for most of the six.
- Different drivers: the six respond to different forces, so the page is not six versions of one story.
We left out single company stocks, which are covered on our pages about gold producers, rare-earth equities and Australian-listed miners. We also left out diamonds and gemstones, fertilizer minerals and thinly traded minor metals, where public price data is poor.
Gold: central banks, funds and rising mine costs
Why people look at it: gold has a deep market and buyers who are not industrial. The World Gold Council (WGC) reported total demand of 1,269 tonnes in the second quarter of 2026, unchanged on a year earlier, and 2,522 tonnes for the first half, worth a record US$380 billion. The LBMA PM gold price averaged US$4,506.29 an ounce in that quarter, 8% below the record first quarter and 37% above the second quarter of 2025.
Chart
Central bank gold buying by quarter
Tonnes, central banks and other institutions
The buyers differ from quarter to quarter. Central banks bought 289 tonnes in the second quarter of 2026. Gold funds, called exchange-traded funds or ETFs, sold a net 45 tonnes after adding 62 tonnes in the first quarter. Jewellery demand fell to 278 tonnes, the lowest quarterly volume since the pandemic. Mine output in the quarter was 966 tonnes, and the USGS puts world mine production at 3,300 tonnes for 2025, led by China (380), Russia (310), Australia (280), Canada (200) and the United States (160).
What can go wrong: gold pays no income, and its price can fall as well as rise. The same WGC report links the Q2 fund selling to higher interest rate expectations and a stronger US dollar. For miners, cost is the other risk. The WGC measures cost as all-in sustaining cost (AISC), which adds sustaining capital, royalties and overheads to the cost of running the mine. The global average reached US$1,785 an ounce in the first quarter of 2026, up 16% on a year earlier and the 28th year-on-year rise in a row. Spot gold touched US$5,595 an ounce in January 2026, so margins were wide, but both price and cost keep changing. For where gold is found, see our guide to gold deposits in the United States.
Silver: part industrial metal, part investment metal
Why people look at it: silver is used in electronics, solar panels, cars and power grids, and it is also bought as coins, bars and fund shares. The Silver Institute’s World Silver Survey 2026 says total demand fell 2% in 2025 to 1.13 billion ounces. Industrial demand was 657.4 million ounces, about 58% of the total. Mine production rose 3% to 846.6 million ounces and recycling reached 197.6 million ounces. Demand exceeded supply for the fifth straight year, and the survey expects the deficit to widen to 46.3 million ounces in 2026.
The USGS counts 26,000 tonnes of mine output in 2025 (about 836 million ounces), about 1% below the survey’s figure. Mexico (6,300 tonnes), Peru (3,600) and China (3,400) lead. Silver is mostly a by-product: the USGS says it comes mainly from lead-zinc, copper and gold mines, in that order. That means silver supply depends on those mines as well as on the silver price.
What can go wrong: the price can move sharply. The survey reports that the annual average price rose 42% in 2025, then reached an all-time high above US$121 an ounce on 29 January 2026 and traded in the mid-US$70s in early April. It also notes that solar manufacturers cut silver use per panel when the metal became dearer, which shows how industrial buyers can respond to price.
Copper: a slow supply response to steady demand
Why people look at it: copper is used in buildings, wiring, motors, vehicles and data centres. The USGS estimates 23 million tonnes of world mine output in 2025, led by Chile (5.3 million tonnes), then the Democratic Republic of the Congo (3.2 million), Peru (2.7 million) and China (1.8 million). USGS reserves are 980 million tonnes. In the United States, the Copper Development Association splits use into building construction (42%), electrical and electronic products (23%) and transport (18%). The LME average price in 2025 was about 440 US cents a pound, or roughly US$9,700 a tonne, against 414.7 cents in 2024 (USGS estimates).
Chart
Copper mine output, top producers
Thousand tonnes of copper; selected countries
The International Copper Study Group (ICSG) forecast in April 2026 that world mine production grows 1.6% in 2026 and 2.3% in 2027. It said output at the Grasberg and Kamoa mines stayed constrained after major incidents in 2025. It now expects a refined copper surplus of about 96,000 tonnes in 2026 and 377,000 tonnes in 2027, where in October 2025 it had forecast a 2026 deficit of 150,000 tonnes.
What can go wrong: the ICSG warns that actual balances have differed from its forecasts, and that the conflict in the Middle East could change its production and demand projections. New copper mines also take years to build. Our guide to copper deposit types and top countries explains where the metal comes from.
▶ Explains what mining does for an economy, from exports and jobs to the minerals the energy transition needs. · 5:03
Lithium: the price swing in one chart
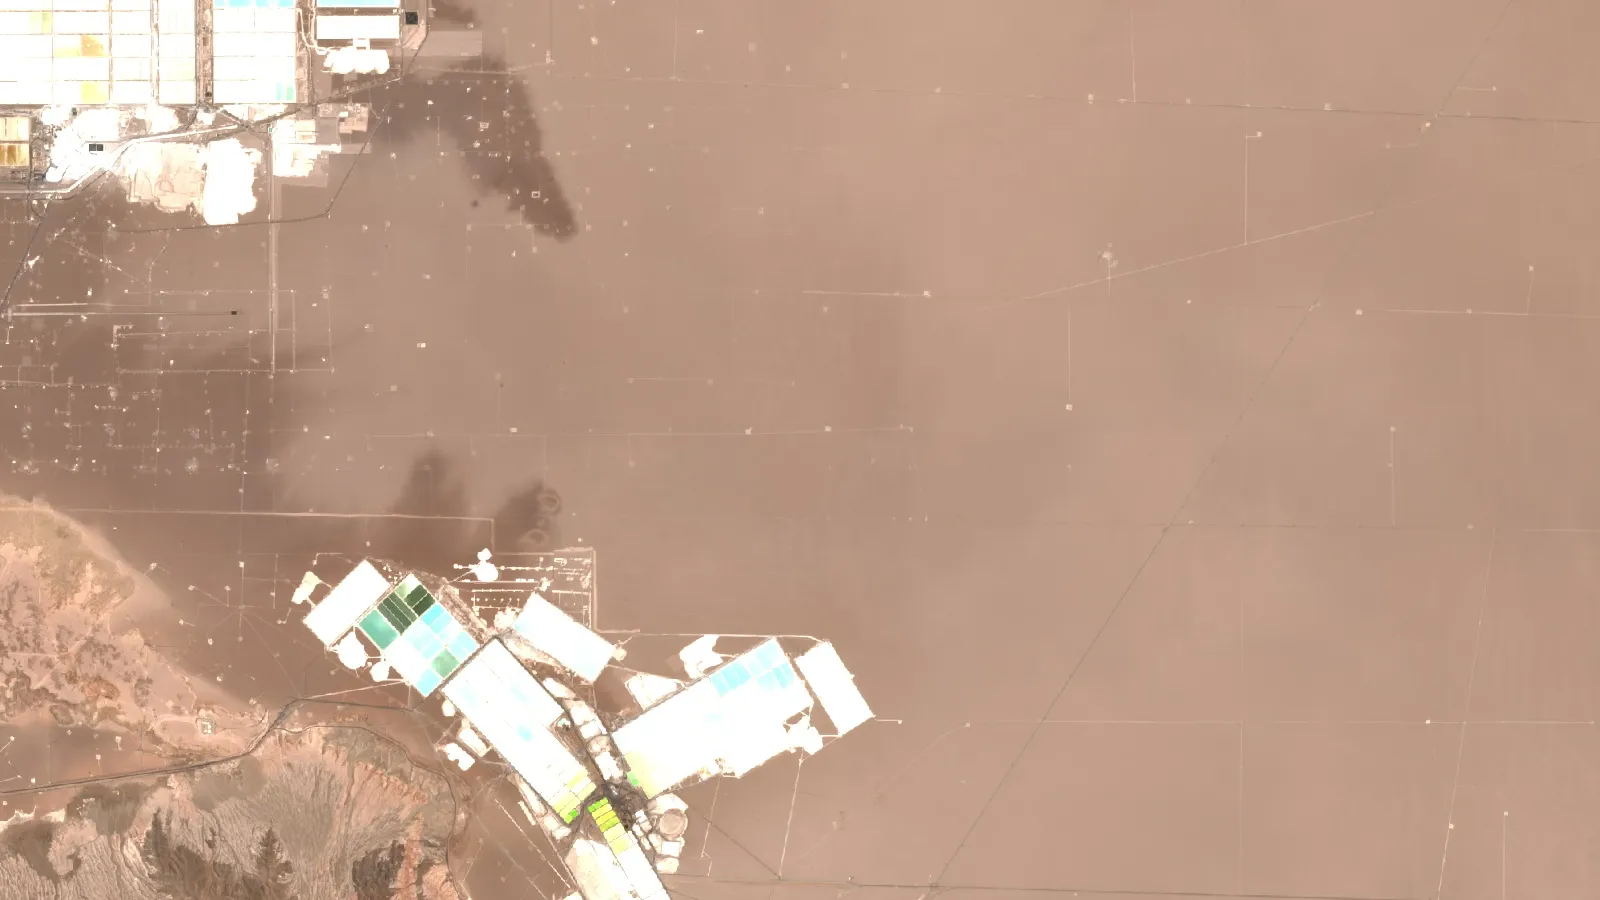
Why people look at it: 88% of lithium goes into batteries for electric vehicles, grid storage, phones and tools (USGS). World mine output rose from 222,000 tonnes of lithium content in 2024 to 290,000 tonnes in 2025, a rise of about 31%. Australia mined 92,000 tonnes, China 62,000, Chile 56,000, Zimbabwe 28,000 and Argentina 23,000. Reserves are 37 million tonnes. Lithium comes from hard rock and from brines. The main hard-rock mineral is spodumene, which is mined, crushed and sold as a concentrate. We explain the deposit types in lithium deposits: pegmatite, brine and clay and the Australian case in lithium in Australia.
Chart
Battery-grade lithium carbonate, annual average price
US dollars per tonne, real dollars
What can go wrong: price. The USGS average battery-grade lithium carbonate price (real dollars) was US$11,700 a tonne in 2021, US$63,700 in 2022, and an estimated US$9,000 in 2025. In 2026 it swung again: S&P Global data reported by Investing News Network show a two-year high of 201,000 yuan (US$30,032) a tonne on 12 May 2026, a 71.8% rise since the start of the year, followed by a fall of nearly 21% in the third quarter in China. The article notes analysts still see strong energy storage demand.
Miners show the same swing. PLS Limited, an Australian spodumene producer, reported financial year 2026 (to 30 June) production of 879.5 thousand tonnes, up 17%, and an average realised price of US$1,488 a tonne against US$672 the year before (the company’s own spodumene concentrate figure). Both volume and price moved, and either can move the other way.

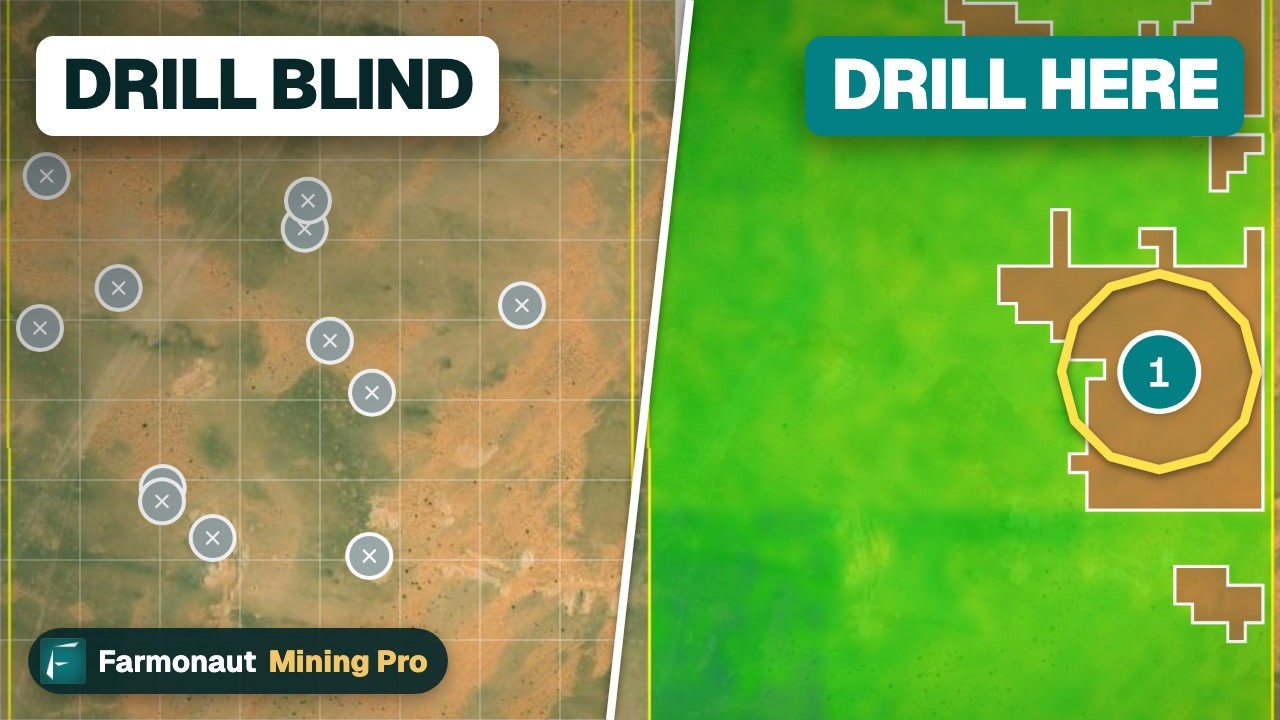
▶ Shows how satellite imagery was used to look for lithium in a Nigerian exploration case study. · 10:49
Uranium: few producers and long contracts
Why people look at it: uranium is the fuel for nuclear reactors. The World Nuclear Association (WNA) reports 2024 mine production of 60,213 tonnes of uranium. Three countries supplied about three-quarters: Kazakhstan 39%, Canada 24% and Namibia 12%. Kazatomprom produced 12,463 tonnes (21% of the world) and Cameco 10,193 tonnes (17%). In situ leaching, where a solution is pumped through the ore underground, supplied over 55% of output. The WNA table shows mines covering about 90% of world demand in 2024.
The WNA’s World Nuclear Fuel Report 2025 estimates reactor needs at about 68,920 tonnes of uranium in 2025, and in its reference scenario just over 150,000 tonnes in 2040. The range runs from about 107,000 tonnes (lower scenario) to over 204,000 tonnes (upper scenario), which shows how much depends on reactor policy.
What can go wrong: uranium is not traded like gold. The WNA says most trade is through three-to-fifteen-year contracts between producers and utilities, with spot sales only about a quarter of the market. In its first-half 2026 results, Kazatomprom’s chief executive described long-term price indicators in the mid-to-high US$90s a pound, their highest in 18 years. That is a company statement, and prices are quoted per pound of U3O8, not per tonne of uranium. Policy matters too: reactor builds, fuel import rules and state-owned producers can change supply quickly.
Rare earths: one country mines most of them
Why people look at it: the USGS says the leading global use of rare earths is magnets, with batteries, ceramics, glass, alloys and polishing as other uses. The USGS puts world output at 390,000 tonnes of rare earth oxide in 2025 (380,000 in 2024). China produced 270,000 tonnes, the United States 51,000, Australia 29,000 and Burma 22,000. China also holds 44 million of the world’s 75 million-plus tonnes of reserves. Rare earths are fairly common in the Earth’s crust, but the USGS notes that minable concentrations are less common than for most other commodities.
What can go wrong: policy. The USGS records that China tightened export controls in April 2025 on samarium, gadolinium, terbium, dysprosium, lutetium, scandium and yttrium, widened them in October to five more elements, then suspended the October step for one year in November. US imports of rare-earth compounds and metals rose 169% in 2025 while their estimated value fell, which shows that prices and volumes do not always move together. Price data for the minor elements is thin, and processing capacity matters as much as mining. Companies in this chain are compared on our rare-earth stocks page.
Ways to hold a mineral: metal, funds, miners and royalties
The same mineral can be held in four different ways, and each has its own risks. A price rise helps all four, but a miner can lose money in a rising market, and a fund can lag the metal.
| Route | What you own | Main risks | Check first |
|---|---|---|---|
| Physical metal | Bars or coins (mainly gold and silver) | Storage, insurance, dealer margin, resale spread | Where it is kept and what it costs to sell |
| Metal-backed funds | Fund shares backed by metal or by futures | Market price differing from asset value, fees, fund structure | The prospectus and what the fund actually holds |
| Mining companies | Shares in a producer or explorer | Costs, grade, accidents, permits, politics, debt | Cost per unit, mine life, where the mines are |
| Royalty and streaming companies | A share of revenue or output from other firms’ mines | Operator problems, price falls, concentration in a few mines | Which mines pay the royalty and for how long |
Physical metal
Gold and silver bars and coins are the forms private buyers most often hold directly. The WGC counted bar and coin investment of 307 tonnes in the second quarter of 2026. The costs are those of any stored asset: a premium over the quoted metal price when you buy, a discount when you sell, plus safe storage and insurance. Copper, uranium and lithium are industrial materials, and individual buyers usually reach them through the routes below.
Funds and exchange-traded products
ETF shares trade on an exchange all day, so their market price can sit above or below the value of the assets behind them. The US Securities and Exchange Commission explains this premium or discount in its ETF investor bulletin. The same bulletin says it covers only funds registered under the Investment Company Act of 1940 and does not cover exchange-traded commodity funds. Many metal funds are in that second group, so read each fund’s own prospectus. Fund flows move with sentiment: the WGC counted gold ETF inflows of 62 tonnes in the first quarter of 2026 and outflows of 45 tonnes in the second.
Mining companies
A miner’s profit is the gap between the metal price and its cost per unit, so a price move is magnified in the company’s margin. The calculator below shows the effect. Miners also carry risks that metal does not: ore grades fall, mines stop after accidents, and governments change royalties or permits. Per-company comparisons are on the pages linked above.
Royalty and streaming companies
A private mining royalty is a contractual right to payment from a mine owner when minerals are extracted or sold, as the law firm Clayton Utz explains in its note on how mining royalties work. A stream is similar, but the holder buys a share of the metal produced at a set price. Royalty holders do not run the mines they hold rights in. Franco-Nevada, a royalty and streaming company, reported 2025 total revenue of US$1,822.8 million on 519,106 gold equivalent ounces sold, against US$1,113.6 million on 463,334 ounces in 2024. The company attributed the record year to higher precious metal prices and growing production. The WGC also names royalties as the biggest single driver of rising mining cost, which is the other side of the same payments.
Calculator
How much does a metal price move change a miner’s margin?
Enter a price, a cost per ounce and a price move. Results update as you type.
- Margin before the move: $2,215
- Change in margin: 18.1%
- Change in price: 10.0%
- Annual margin after the move: $523,000,000
Example values only, not a forecast or a benchmark. The metal price is an input: use today’s price. The cost default of US$1,785 per ounce is the World Gold Council global average all-in sustaining cost for the first quarter of 2026. Cost is held flat for the price move, which is a simplification. Margin here is before tax, interest and growth capital. Money is in US$.
What to check before you commit money
- Your time frame. Lithium’s price fell about 86% from 2022 to 2025 (USGS), and the copper market is forecast to move between deficit and surplus. A holding that suits ten years may not suit two.
- What you actually own. Metal, a fund, a share and a royalty react differently to the same price.
- Concentration. If one country supplies most of a mineral, one policy change can move the price.
- Cost, not only price. For a miner, compare the all-in sustaining cost with the price and see how it has changed.
- Fees and taxes. Fund fees, dealer margins, storage and your local tax rules reduce what you keep.
- Dated data. Every figure on this page has a year. Prices move daily, so check today’s quote from Kitco, the LBMA, the LME or your broker before you rely on any number.
- Professional advice. A licensed adviser can look at your whole situation. This page cannot.
Where satellite data fits
Every mineral above started as a target on a map. Farmonaut screens an area of interest from satellite images before field crews go in, and accepts KML, KMZ or polygon files. If you hold a licence or advise investors on a project, you can read about satellite mineral detection or request a quote through the mining query form. Satellite results are exploration targets that sit ahead of a resource estimate, not investment ratings.
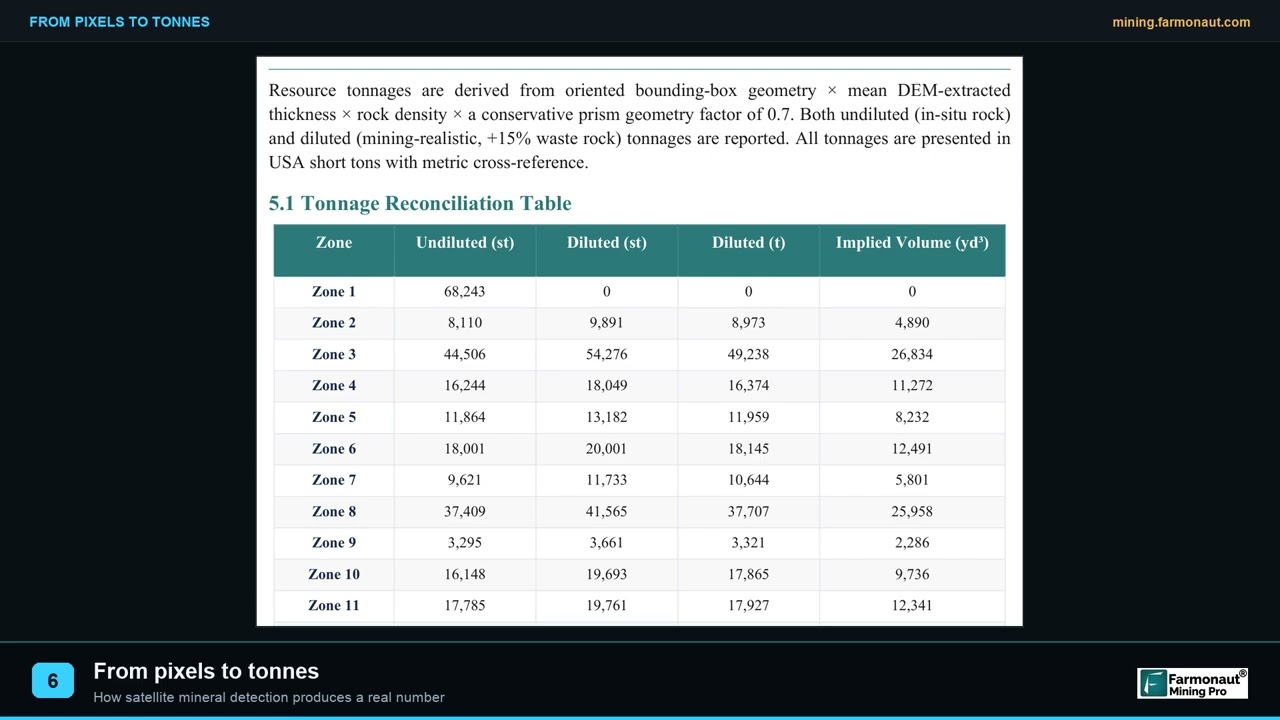
▶ Explains how a satellite image becomes a tonnage and grade estimate, and which inputs are measured and which are assumed. · 2:54
We cover a connected topic in Best Silver Mines to Invest In: 10 Big Mines Compared.
Frequently asked questions
What is the best mineral to invest in?
No source can name one. Gold, silver, copper, lithium, uranium and rare earths respond to different forces: central bank buying, industrial demand, battery demand, nuclear policy and export controls. The better question is which risk you are comfortable with, which the table and sections above lay out.
How do I invest in minerals?
There are four routes: physical metal (mainly gold and silver), metal-backed funds, shares in mining companies, and royalty or streaming companies. Each has different costs and risks, described in the exposure section. Use a regulated broker or dealer and read the fund prospectus or company filings first.
Which minerals are on the US critical minerals list?
The final 2025 list, published in the Federal Register on 7 November 2025, names 60 minerals. It includes copper, lithium, silver, uranium, cobalt, graphite, nickel, tungsten and rare earth elements such as neodymium and dysprosium. Gold is not on it.
Is silver more of an industrial metal than gold?
Yes, by demand. The Silver Institute counts industrial demand at 657.4 million ounces of 1.13 billion ounces in 2025, about 58%. Gold demand is led by jewellery, investment and central banks (World Gold Council).
Why did lithium prices fall so much?
The USGS shows the average battery-grade carbonate price falling from US$63,700 a tonne in 2022 to an estimated US$9,000 in 2025, while world mine output rose about 31% in 2025. The USGS table does not give a single cause. Prices then rose sharply in early 2026 and fell again in the third quarter.
Is uranium priced like gold or oil?
Not quite. The World Nuclear Association says most uranium is sold through multi-year contracts, with the spot market about a quarter of trade. That makes the spot price a partial signal.
Are rare earths actually rare?
The elements are fairly common in the Earth’s crust. What is scarce are deposits that are rich enough to mine and plants that can separate the elements, according to the USGS. China mined about 69% of the 2025 total.
Is it safer to buy the metal or the miners?
The risks differ, so neither is safe by default. Metal has no operating risk but pays no income. A miner’s margin is the price minus its cost per unit, so it can change faster than the metal price in either direction. The calculator on this page shows the effect with your own numbers.
What is a royalty company?
A firm that holds contractual rights to a share of revenue from mines it does not run. Clayton Utz describes private mining royalties as contractual rights to payment from the mine owner. Holders depend on the operators, so a stoppage at the mine affects the payment.
What does all-in sustaining cost tell an investor?
It is the World Gold Council’s standard measure of what it costs a gold mine to produce an ounce, including sustaining capital and royalties. The global average was US$1,785 an ounce in the first quarter of 2026. Comparing it with the price shows the margin before tax, interest and growth capital.
Can I invest in minerals without buying shares?
Yes. Physical gold and silver bars and coins are held directly. Other routes use funds or contracts, which are shares or units in a product. Check the fund type and the rules in your own country, because some products are not regulated like ordinary funds.
This page is for information only. It is not investment advice. Prices change daily and past figures do not predict future results. Speak to a licensed adviser before you buy any mineral, fund or share.
Farmonaut mining
See how satellites screen a licence area before drilling
Farmonaut screens an area of interest from satellite images before field crews go in, and takes KML, KMZ or polygon input.
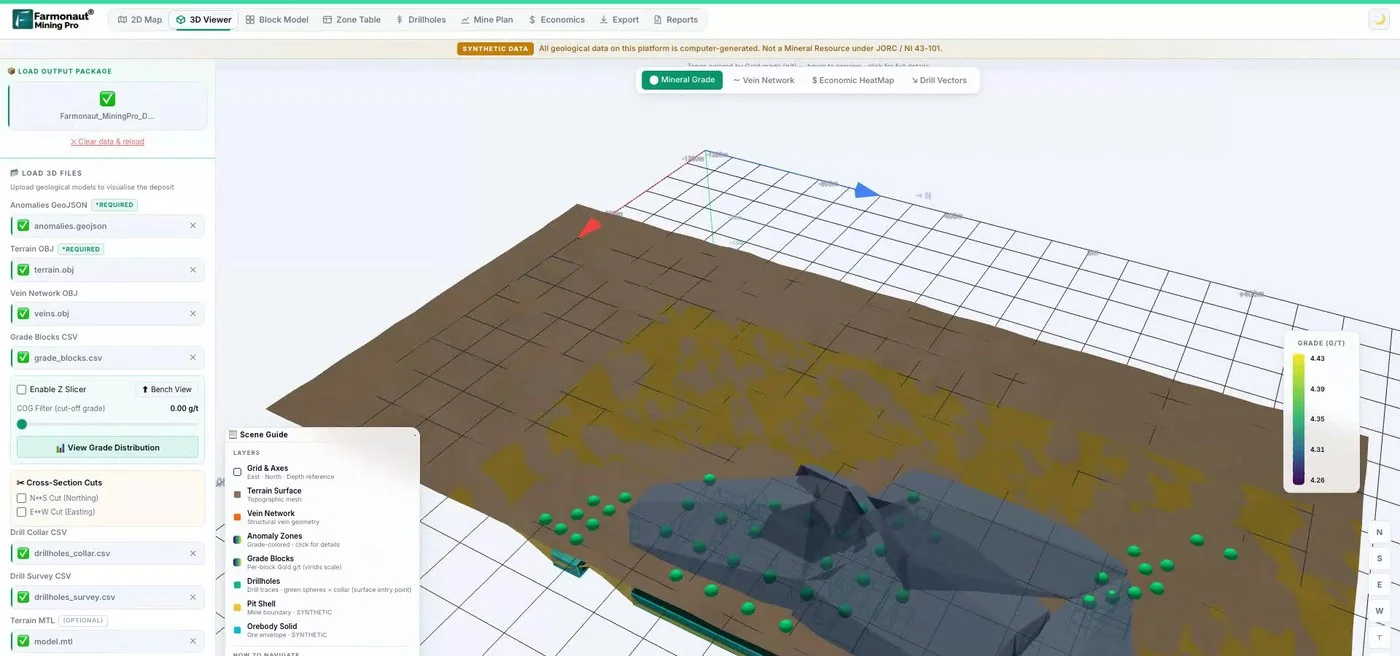
Mining Pro sample view, synthetic data
Keep reading
Sources
- USGS, Mineral Commodity Summaries 2026: Gold: pubs.usgs.gov
- USGS, Mineral Commodity Summaries 2026: Silver: pubs.usgs.gov
- USGS, Mineral Commodity Summaries 2026: Copper: pubs.usgs.gov
- USGS, Mineral Commodity Summaries 2026: Lithium: pubs.usgs.gov
- USGS, Mineral Commodity Summaries 2026: Rare earths: pubs.usgs.gov
- Federal Register, Final 2025 List of Critical Minerals (7 November 2025): federalregister.gov
- World Gold Council, Gold Demand Trends Q2 2026: gold.org
- World Gold Council, Record gold prices outpace rising mining costs in Q1’26 (August 2026): gold.org
- Silver Institute, World Silver Survey 2026 press release (15 April 2026): silverinstitute.org
- International Copper Study Group, Copper Market Forecast 2026/2027 (23 April 2026): icsg.org
- Investing News Network, Lithium market trends: Q3 2026 review and forecast (14 October 2026): investingnews.com
- PLS Limited, June 2026 quarterly activities report (ASX, 30 July 2026): announcements.asx.com.au
- World Nuclear Association, World uranium mining production (updated 9 October 2026): world-nuclear.org
- World Nuclear Association, World Nuclear Fuel Report 2025: world-nuclear.org
- World Nuclear Association, Uranium markets: world-nuclear.org
- Kazatomprom, 1H2026 financial results: kazatomprom.kz
- SEC Investor.gov, Investor Bulletin: Exchange-Traded Funds: investor.gov
- Clayton Utz, Digging into mining royalties (22 August 2024): claytonutz.com
- Franco-Nevada, Reports record 2025 results (10 March 2026): newswire.ca
Discussion
Questions, corrections or field experience? Share them below. First-time comments are reviewed before they appear, and your email is never published.
No comments yet. Be the first to add a question or your experience.

 Comfix & Engineering Limited
 Congo Mining Solutions
 Mining SARL
 SenGold Invest SAS
 Sania Corporation
 Sean Mining Limited
 NTS Group (Pty) Ltd
 Mine4Africa
 Lithspo Minerals Limited
 Tintina Mining Group
 Dalgety Minerals Pty Ltd
 Vortex Minerals Pty Ltd
 Faith At Work (Pty) Ltd
 Geotech Mining Solutions plc
 Vulcan International Limited
 Kidepo Associates
 GKY Mining
 Alkimy SARL
 Double A Trading
 GemSprout Metals Limited
 Qader Group











