

Mining financial model · Excel build guide
Mining Financial Model XLS: Sheet-by-Sheet Build Guide
A mining financial model in Excel turns tonnes, grade, price, cost, tax and capital into yearly cash flow, NPV, IRR and payback. This guide builds it in eight sheets and checks each one against the Black Pine feasibility study.
Key takeaways
- Eight linked sheets cover a mining model: inputs, production, capital, operating cost, revenue and tax, cash flow, sensitivity and checks.
- Black Pine’s study (Liberty Gold, Sept 2026): after-tax NPV (5%) of US$2,397 million on US$411.4 million initial capital at US$3,250 per ounce, 60.5% IRR.
- A model can be proved right: 433.3 Mt at 0.29 g/t and 70.2% recovery gives about 2.84 million ounces, and revenue less costs and capital gives about US$4,459 million against the reported US$4,460 million pre-tax cash flow.
- Black Pine’s NPV rises from US$1,215 million at US$2,500 per ounce to US$4,336 million at US$4,500, about US$775-790 million per US$500 step.
- SEC rules set cost accuracy of about plus or minus 50% for an initial assessment, 25% for a pre-feasibility and 15% for a feasibility study (17 CFR 229.1302).
In this article
- What a mining financial model in Excel contains
- Can you get a mining financial model XLS at no cost
- Sheet 1: Inputs and assumptions
- Sheet 2: Production schedule
- Sheet 3: Capital cost
- Sheet 4: Operating cost
- Sheet 5: Revenue, royalties and tax
- Sheet 6: Cash flow, NPV and IRR
- Sheet 7: Sensitivity tables
- Sheet 8: Checks and summary
- How accurate is the model at each study stage
- Two real projects side by side
- Mistakes that break mining models
- Where satellite data fits in the model
A mining financial model in Excel is a workbook that turns a project’s tonnes, grade, recovery, price, costs, tax and capital into a year-by-year cash flow, then reads off the net present value (NPV), the internal rate of return (IRR) and the payback time. There is no single XLS template that fits every mine, but the layout is the same everywhere: eight linked sheets, each with its own checks. This guide builds that layout sheet by sheet and tests every step against the published numbers of a real feasibility study, the Black Pine gold project in Idaho (Liberty Gold, 8 September 2026). It is written for licence owners, consultants and investors who need to build, or at least audit, financial modelling for mining projects in Excel.
Terms are explained where they first appear. NPV is the sum of future yearly cash flows, each divided by (1 + discount rate) raised to the year number. IRR is the discount rate at which NPV is zero. Payback is the time until cumulative cash flow turns positive. Modern Excel saves workbooks as .xlsx; the older .xls format holds the same grid of cells and formulas, so everything below works in either.
What a mining financial model in Excel contains
A model has inputs, calculations and outputs, and the three should sit on separate sheets so that a reviewer can see at a glance what was typed in and what was calculated. The eight-sheet layout below is the one used in the rest of this guide. Each row names what the sheet holds and the check that proves it is right.
Infographic
A mining model in 5 moves
- 1InputsType tonnes, grade, recovery, price and rates once, with sources.
- 2PhysicalTurn tonnes and grade into ounces sold per year.
- 3MoneyAdd capital, operating cost, royalties and tax.
- 4DiscountBuild yearly cash flow, then NPV, IRR and payback.
- 5StressRun sensitivity tables and check against the study.
| Sheet | What it holds | Check that it works |
|---|---|---|
| 1. Inputs | Tonnes, grade, recovery, price, discount rate, tax rate, royalties | Every typed number has a unit and a source |
| 2. Production | Ore mined, metal contained and metal sold per year | Total ounces match the study’s reserve and recovery |
| 3. Capital | Initial, sustaining and closure spending by year | Items add to the study’s total |
| 4. Operating cost | Cost per tonne by activity and per ounce sold | Per-tonne costs multiplied by tonnes equal the total |
| 5. Revenue and tax | Revenue, royalties, taxable income and tax | Pre-tax cash flow equals revenue minus costs and capital |
| 6. Cash flow | Yearly cash flow, NPV, IRR, payback | NPV recomputed by two methods agrees |
| 7. Sensitivity | NPV and IRR at several prices, costs and capital | The base case appears in the table and matches Sheet 6 |
| 8. Summary and checks | One page of results and all checks | Every check shows zero or TRUE |
Keep one rule for the whole workbook: one fact, one cell. The gold price is typed once on Sheet 1 and every other sheet points to it. A common failure in mining spreadsheets is the same number typed in three places and updated in two.
Can you get a mining financial model XLS at no cost
Ready-made workbooks exist, but the most useful material at no cost is not a spreadsheet at all. It is the technical report behind a published study. Companies listed in Canada file NI 43-101 technical reports, and companies that report to the US Securities and Exchange Commission (SEC) file a technical report summary for each material property. Under SEC rule 17 CFR 229.1302, a pre-feasibility or feasibility study must include a discounted cash flow analysis with taxes described in detail (17 CFR 229.1302). Those reports give you real tonnes, grades, costs and capital to type into your own workbook, and a published NPV to test it against.
For the funding side of a project, see our guide to mining project finance modelling. The calculator on this page is a working example of the cash-flow sheet and you can copy its formulas into Excel.
Whatever file you start from, check three things before trusting it: that the discount rate and price are inputs and not buried in formulas, that tax is calculated and not assumed as a flat percentage of revenue, and that the file lists its units. A workbook that fails any of these will give a confident wrong answer.
Sheet 1: Inputs and assumptions
Start with the physical facts of the project. For Black Pine, the feasibility study reports a probable mineral reserve of 433.3 million tonnes at 0.29 grams per tonne (g/t) gold, which contains 4.04 million ounces, mined over 16 years with an average gold recovery of 70.2% (Liberty Gold, 2026). Grade is the metal content of the rock; recovery is the share of that metal the plant actually captures. A mineral reserve is the part of a resource shown by a study to be economic to mine; it is a stricter label than a mineral resource.
Chart
Average annual gold price
US$ per troy ounce; 2025 is a USGS estimate
The study then needs a price. Black Pine uses a base-case gold price of US$3,250 per troy ounce, and tests prices from US$2,500 to US$4,500. A base case should not be set at the day’s spot price by default. The USGS reports that the average annual gold price moved from US$1,801 per ounce in 2021 to an estimated US$3,300 in 2025 (USGS, Mineral Commodity Summaries 2026), so a base case written two years ago can be far from one written today. Make the price an input, label it, and date it.
The rest of the input sheet holds the discount rate, the tax rate, royalties and the currency. Black Pine discounts at 5%. Other studies use different rates: the Warintza copper study in Ecuador reports its NPV at 8% (Solaris Resources, November 2025), and Hudbay’s Copper World study reports NPV at 8% and 10% (Hudbay Minerals, September 2023). Never compare two NPVs without checking that both use the same rate.
Sheet 2: Production schedule
The production sheet converts tonnes and grade into ounces sold. Contained metal in ounces equals tonnes multiplied by grade in g/t, divided by 31.1035, because one troy ounce is 31.1035 grams. Metal sold equals contained metal multiplied by recovery. In Excel this is one line per year: =tonnes*grade/31.1035*recovery.
Test it on Black Pine. 433.3 million tonnes at 0.29 g/t contains 433.3 x 0.29 / 31.1035 = 4.04 million ounces, which matches the stated reserve. Multiply by the 70.2% recovery and you get about 2.84 million ounces, in line with the 2,841 thousand ounces of gold the study says will be produced. When your own sheet reproduces the study’s ounces within rounding, the production logic is right. If it does not, stop; nothing built on it will be right either.
A production schedule also needs a ramp-up. Real mines rarely reach full rate in year one. Black Pine’s average output is 202,000 ounces a year in years 1-5 and 176,700 over the life of the mine, with a peak of 294,600 ounces in year 13. A flat-output model is fine for a first screen, but the yearly shape changes the NPV because early cash is worth more than late cash.
The inputs to this sheet come from the resource model. If you want to see what that block model looks like before you type numbers from it, the short video below shows one.
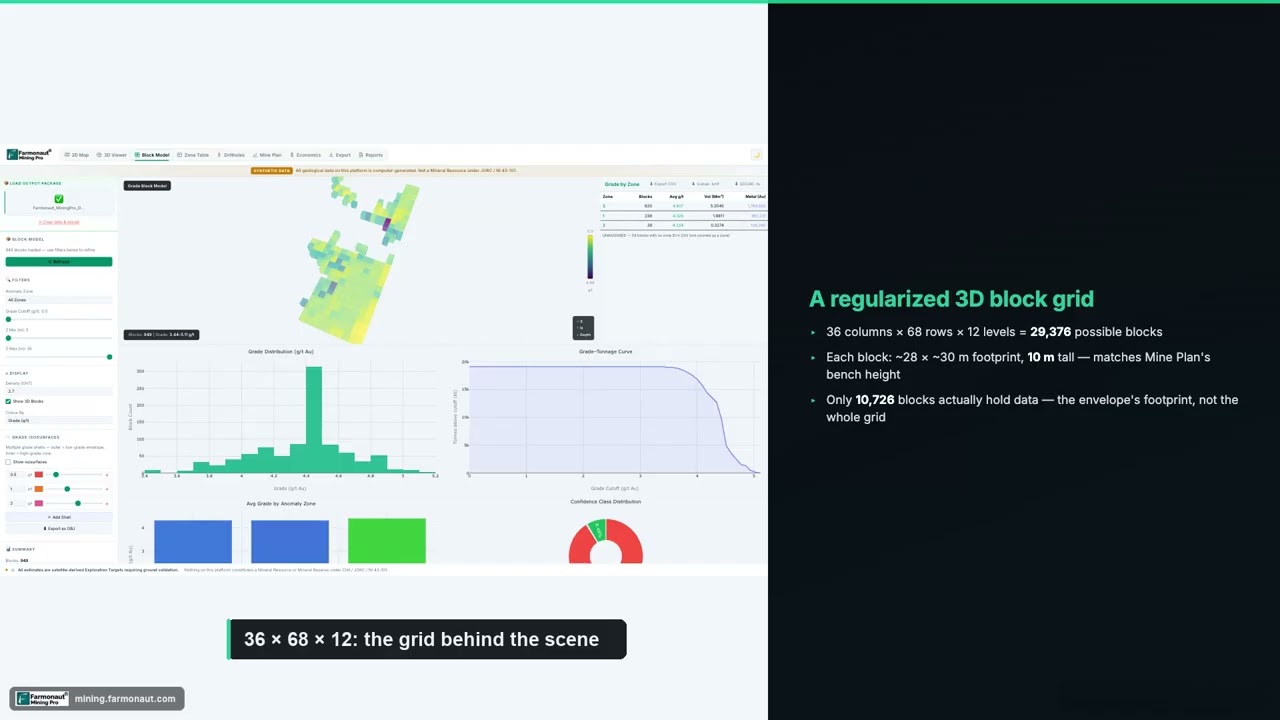
▶ What a block model is: the 3D grid under a mine plan, shown in Farmonaut Mining Pro with demo data. · 5:23
Sheet 3: Capital cost
Capital cost is split into three kinds, and a model that merges them will mis-state both payback and NPV. Initial capital is spent before production. Sustaining capital keeps the mine running after it starts: replacement equipment, new heap leach pads, more development. Closure cost is the bill for reclaiming the site at the end.
Chart
Black Pine initial capital by item
US$ million, total US$411.4 million
Black Pine’s study gives all three. Initial capital is US$411.4 million: US$221.4 million for the process plant and support, US$87.0 million for the heap leach facility and US$103.0 million for mine capital. Sustaining capital is US$254.0 million over 16 years and closure is US$160.1 million, so total life-of-mine capital is US$825.5 million (Liberty Gold, 2026). Closure spending falls at the end of the life, so in the model it is discounted heavily, but it is still a real cost and it belongs in the cash flow.
A contingency line is normal. The Copperstone gold study in Arizona shows initial capital of US$58.3 million as US$52.4 million of pre-production capital plus US$5.9 million of contingency (Minera Alamos, 27 May 2026). Keep contingency on its own row so a reviewer can change it.
Sheet 4: Operating cost
Operating cost is best built per tonne of ore, by activity, then converted to cost per ounce. The per-tonne build is what lets you scale a model when the mine rate changes. Black Pine’s life-of-mine operating cost is US$8.98 per tonne of ore processed: mining US$6.08, process plant US$2.07, general and administration US$0.80 and refining US$0.02. Over 433.3 million tonnes that is about US$3,892 million, which is what the study states.
The same study quotes a cash cost of US$1,388 per ounce and an all-in sustaining cost (AISC) of US$1,566 per ounce. The cash cost includes mining, processing, site administration, refining and royalties. AISC adds sustaining capital, closure costs and, in this study, Idaho mine licence tax and property tax. These measures are not the same as the plain operating cost, so never put them in the same row. A model should carry operating cost per tonne as its input and calculate cash cost and AISC as outputs that can be compared with the study.
Mining method moves the numbers strongly. Black Pine is an open-pit run-of-mine heap leach, where ore is stacked and irrigated with leach solution without crushing, and costs US$8.98 per tonne. Copperstone is an underground mine and reports total site operating cost of US$132.24 per tonne, about 15 times higher. A cost per tonne copied from a different mining method is a damaging input error in a desk model.
Sheet 5: Revenue, royalties and tax
Revenue is ounces sold multiplied by price. Black Pine sells 2,838 thousand payable ounces, so at US$3,250 per ounce revenue is about US$9,224 million over the life of the mine. Royalties come off the top. A net smelter return (NSR) royalty is a percentage of revenue after smelting and refining charges; the study notes a 0.5% NSR held by Wheaton Precious Metals, which Liberty Gold can partly buy back.
Chart
Black Pine NPV before and after tax
US$ million, NPV at 5% discount rate
Now run the pre-tax check. Revenue of US$9,224 million, less cash costs of about US$3,939 million (US$1,388 per ounce on 2.838 million ounces), less sustaining capital of US$254.0 million, closure of US$160.1 million and initial capital of US$411.4 million, leaves about US$4,459 million. The study reports a pre-tax cash flow of US$4,460 million. A model that rebuilds the published figure from the published inputs to within a rounding error has its arithmetic right.
Tax comes next. The study’s after-tax cash flow is US$3,579 million, so taxes are about US$881 million, roughly 20% of pre-tax cash flow. After-tax NPV at 5% is US$2,397 million against US$2,929 million before tax, about 18% lower. At US$4,500 per ounce the pre-tax and after-tax NPVs are US$5,371 million and US$4,336 million. Tax rules differ by jurisdiction, and often include depreciation, depletion, state taxes and loss carry-forwards, so a flat percentage is only a screening shortcut.
Sheet 6: Cash flow, NPV and IRR
Put one column per year. Each column holds revenue, costs, capital and tax, and ends with net cash flow after tax. Excel’s NPV function discounts a series of cash flows at a given rate, but with a catch: it assumes the first cash flow falls one full period after the start, and its documentation says that if your first cash flow is at the beginning of the first period you must add it to the result instead of including it in the range (Microsoft Support, NPV function). In a mine, the initial capital is spent on day zero, so the usual formula is =-initial_capital+NPV(rate, year1_to_lastyear).
When cash flows do not fall at regular yearly intervals, use XNPV, which takes a date for each cash flow and treats the first date as the start of the schedule (Microsoft Support, XNPV function). Compute IRR with the IRR function on the same row of cash flows. If NPV and XNPV for a yearly model differ a little, the cause is that XNPV discounts by actual days; that is expected and should be explained in a note. If they differ a lot, a cash flow is in the wrong column.
Payback is the first year in which the running total of cash flow becomes positive. The study reports payback of 2.0 years at the base case and 1.2 years at US$4,500 per ounce. The NPV-to-initial-capital ratio is a quick ranking figure: for Black Pine it is 2,397 / 411.4, or 5.8, and for Copperstone it is 374 / 58.3, or 6.4, using each study’s own base price.
The calculator below is a simplified, flat-year version of this sheet. Enter your own annual production, price, cost, capital, life, discount rate and tax rate. It is a screening tool, not a bank model: it has no ramp-up, working capital or detailed depreciation schedule.
Calculator
What is a gold project worth on your inputs?
Enter your own output, price, cost and capital to see a flat-year after-tax NPV.
- Annual margin before tax: 225 US$M
- Annual after-tax cash flow: 187 US$M
- Simple payback: 2.1 years
Example values only, not a forecast or any company’s figures. Prices are inputs: example, use today’s price. Simplified: constant output and cost, capital spent at the start, straight-line depreciation for tax, no ramp-up, royalties or working capital. Enter cost as all-in cost per ounce.
Sheet 7: Sensitivity tables
A single NPV is only one point. A sensitivity table shows how the answer moves when one input changes and the rest stay fixed. In Excel use a data table, part of the What-If Analysis tools, which recalculates a result for a list of input values (Microsoft Support, data tables). Put the gold price down the left column, point the top cell at the NPV on Sheet 6, and Excel fills in the rest.
Chart
Black Pine after-tax NPV by gold price
US$ million at 5% discount rate, all other assumptions unchanged
Black Pine’s study does this for gold price. After-tax NPV at 5% is US$1,215 million at US$2,500 per ounce, US$2,006 million at US$3,000, US$2,397 million at US$3,250, US$2,786 million at US$3,500, US$3,562 million at US$4,000 and US$4,336 million at US$4,500. IRR rises from 33.4% to 104.3% over the same range and payback falls from 3.4 to 1.2 years. Each US$500 step adds about US$775 to US$790 million of NPV, which is close to a straight line because price flows through to revenue one for one.
Run the same table for operating cost, initial capital and recovery. Price, cost and capital are not independent in the real world, since a price boom tends to lift costs, so treat each table as a one-at-a-time test and not a forecast. The Monte Carlo method, which draws many random combinations, is the next step; the video below explains what its P10, P50 and P90 outputs mean.
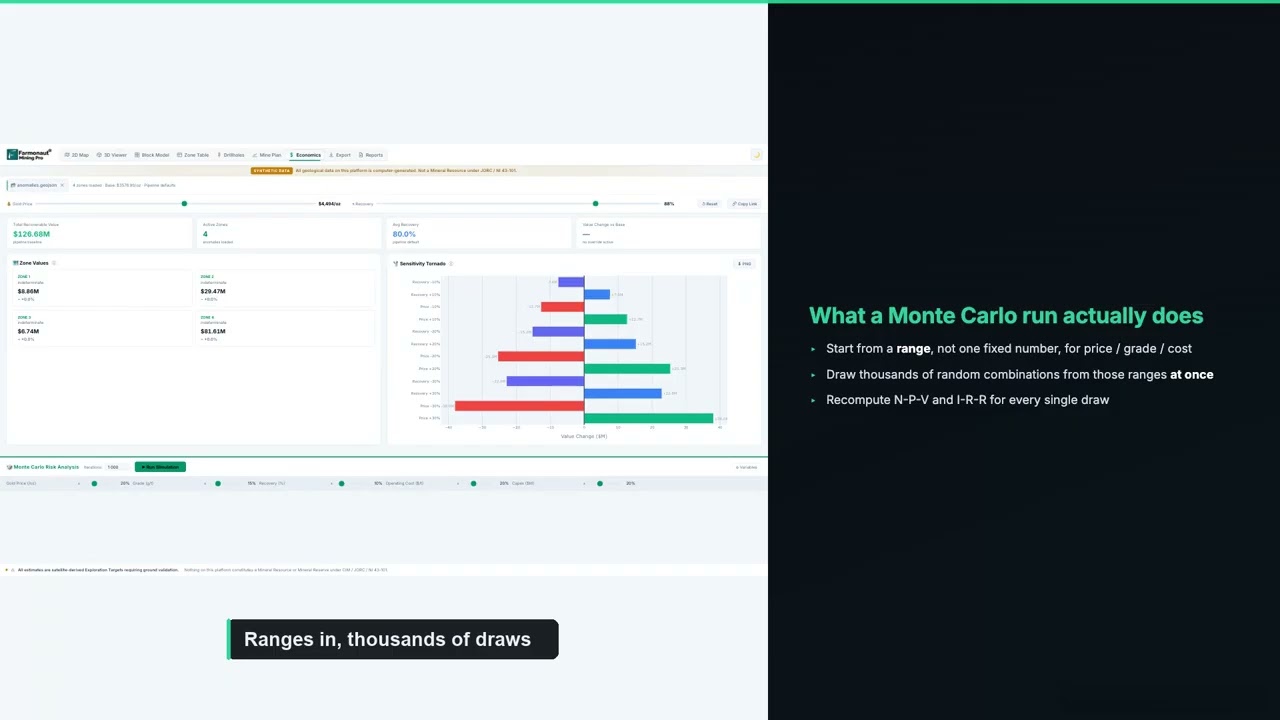
▶ What Monte Carlo P10/P50/P90 means for price, grade and cost uncertainty in mine economics. · 14:59
Sheet 8: Checks and summary
The last sheet is the one a lender, partner or buyer reads first. It should hold the headline results (NPV, IRR, payback, initial capital, AISC), the key inputs beside them, and a block of checks that each return zero or TRUE. A short checklist covers most of what goes wrong.
- Units: tonnes against ounces, grams per tonne against ounces per ton, US$ against C$ or A$. Put the currency in every header.
- Totals: capital by item adds to the study total; operating cost per tonne times tonnes equals the total.
- Signs: costs are negative, revenue positive, in every sheet.
- Timing: initial capital sits in year zero and is not discounted.
- Tax: no negative tax in loss years unless the tax law allows a refund.
- Reconciliation: base-case NPV matches the published or internal figure within rounding.
- Circularity: none. If interest during construction creates one, break it with a named switch.
Lock formula cells, colour inputs one way and calculations another, and keep a version log. A model that cannot be audited cannot be sold.
How accurate is the model at each study stage
A model is only as good as the study stage behind its inputs. Under SEC rules, an initial assessment may include a cash flow analysis, in which case costs must be accurate to about plus or minus 50%, with contingency of no more than 25%. A pre-feasibility study must show a discounted cash flow, with costs accurate to about plus or minus 25% and contingency of up to 15%. A feasibility study is accurate to about plus or minus 15% with contingency of up to 10% (17 CFR 229.1302). The Canadian CIM definitions describe a pre-feasibility study as a comprehensive study of a range of options and a feasibility study as a comprehensive technical and economic study of the selected option (CIM Definition Standards).
In practice, an NPV from a desk model built on a scoping-level resource carries the wide error band of an early study, however neat the spreadsheet looks. Our guide to the pre-feasibility study in mining covers what each stage costs and what it delivers. For a wider look at what makes a mine earn its keep, see mining profitability.
Two real projects side by side
The table shows how different the same sheets look for two projects, both in the United States, both gold, from two different study stages. Each column uses its own base price and the study’s own definitions.
Chart
Copperstone after-tax NPV by gold price
US$ million at 5% discount rate, pre-feasibility study
| Item | Black Pine, Idaho (feasibility study) | Copperstone, Arizona (pre-feasibility study) |
|---|---|---|
| Mining method | Open pit, run-of-mine heap leach | Underground |
| Mine life | 16 years | 6.3 years |
| Initial capital | US$411.4 million | US$58.3 million |
| AISC | US$1,566 per ounce | US$1,314 per ounce |
| Base gold price | US$3,250 per ounce | US$3,500 per ounce |
| After-tax NPV at 5% | US$2,397 million | US$374 million |
| After-tax IRR | 60.5% | 108% |
| NPV to initial capital | 5.8 | 6.4 |
Sources: Liberty Gold, 8 September 2026; Minera Alamos, 27 May 2026. These are company study results, not Farmonaut figures, and are shown as examples of model structure only.
Copperstone also publishes a price sensitivity: after-tax NPV at 5% of US$214 million at US$2,500 per ounce, rising about US$40 million for each US$250 step to US$374 million at US$3,500. Black Pine gains roughly US$390 million for the same step. The slope differs because the production size differs, which is why a sensitivity must be built on your own project and not copied from another.
Mistakes that break mining models
- Mixing a pre-tax number with an after-tax one when comparing projects.
- Comparing NPVs at different discount rates or in different currencies.
- Using spot price in some years and a long-term price in others without saying so.
- Leaving out sustaining capital and closure, which makes payback look better than it is.
- Applying a cost per tonne from a different mining method or throughput.
- Using resource tonnes that include inferred material as if they were reserves; inferred resources are too uncertain to carry economic weight in a study.
- Treating AISC as the only cost that matters; a mine must also repay its initial capital.
- Typing the same price or rate into several cells.
Where satellite data fits in the model
Satellite imagery does not replace drilling, and it gives no tonnes or grade for Sheet 1. Where it helps is before the model exists: screening ground for alteration and structure, mapping access and terrain, and ranking targets so that the first drilling budget goes to the better ground. Farmonaut’s satellite mineral detection reports give exploration targets, not resources. A sound path is imagery first, then drilling, then a resource estimate, then this workbook.
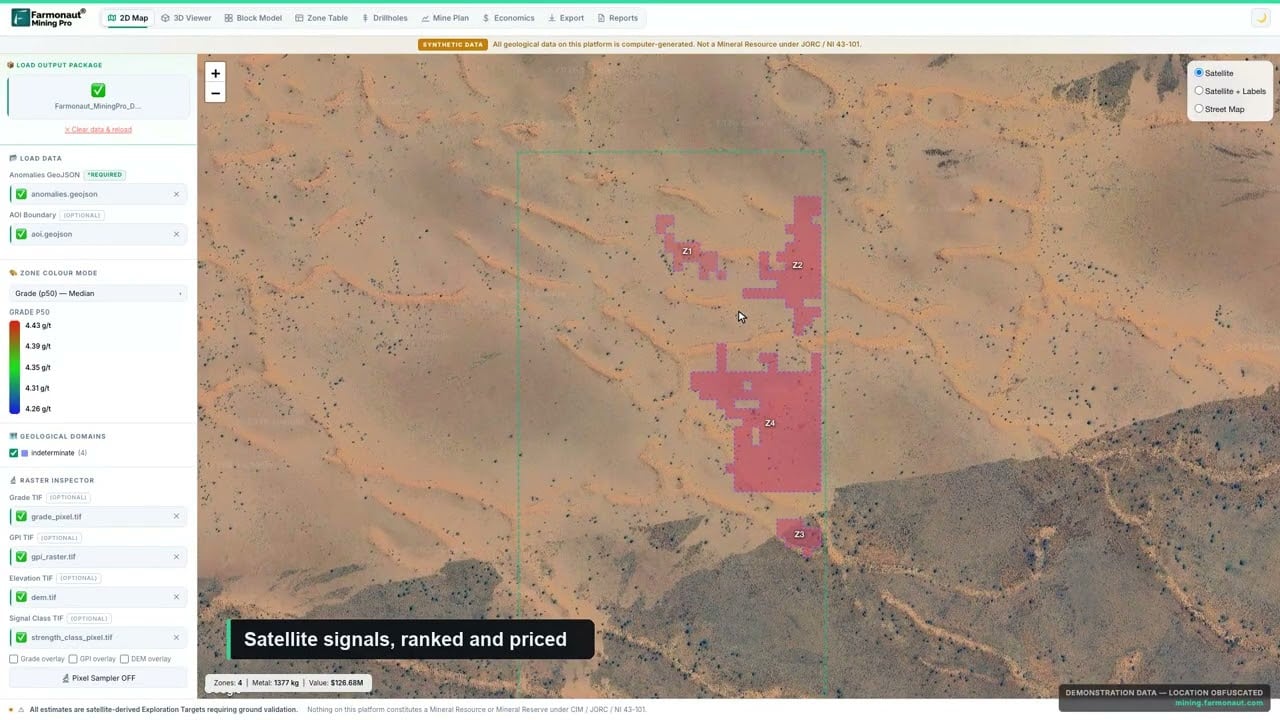
▶ A quick look at Farmonaut Mining Pro, which turns a licence boundary into exploration targets. · 4:56
Frequently asked questions
Is there a mining financial model XLS I can download at no cost?
Some consultants and universities publish sample workbooks, but quality varies and none fits every project. The reliable route is to build your own using the eight-sheet layout above and test it against the numbers in a published technical report, such as the Black Pine feasibility study.
What sheets should a mining financial model have?
At minimum: inputs, production, capital cost, operating cost, revenue and tax, cash flow with NPV and IRR, sensitivity, and a summary with checks. Larger models add financing, working capital, depreciation and royalty schedules.
What is the difference between mining project finance modelling and a valuation model?
A valuation model asks what the project is worth on an after-tax cash flow basis. A project finance model adds debt, interest, repayment and cover ratios to ask whether lenders will fund it. Our guide to mining project finance modelling covers the second.
Should I use NPV or XNPV in Excel?
Use NPV for yearly cash flows and remember it expects the first cash flow one period out, so add day-zero capital separately. Use XNPV when you have actual dates for each cash flow.
What discount rate should a mining model use?
There is no single correct rate. The studies cited here use 5% (Black Pine and Copperstone) and 8% (Warintza), and Copper World shows 8% and 10%. Rates reflect metal, country and project stage. Show NPV at more than one rate.
How accurate is a mining financial model?
It is as accurate as its inputs. SEC rules set cost accuracy of about plus or minus 50% for an initial assessment, 25% for a pre-feasibility study and 15% for a feasibility study.
Is Excel good enough for a mining financial model?
For valuation and sensitivity, often yes: the Black Pine check above shows a study’s headline cash flow can be rebuilt on a spreadsheet from its published inputs. Detailed mine scheduling and pit design are normally done in specialised mine-planning software, whose output feeds the Excel model.
How do I calculate gold contained in ore in Excel?
Multiply tonnes by grade in grams per tonne and divide by 31.1035 to get troy ounces. Then multiply by recovery for ounces sold.
Does the model need to be JORC or NI 43-101 compliant?
The workbook itself is not compliant or non-compliant. The resource and reserve inputs are what carry the code. A desk model built on unclassified or satellite-derived targets should say clearly that it is an exploration target and not a mineral resource.
Where can I see a copper version of this model?
This page covers the workbook layout for any commodity. Our copper mine valuation guide walks through a copper NPV with copper study numbers.
This page is for information only. It is not investment advice. Study figures are the companies’ own results at the dates and prices shown.
Farmonaut mining
Screen your licence area before you build the model
Farmonaut's satellite exploration reports show alteration and structure targets on a licence; results are exploration targets, not resources. Request a quote for your area.

Mining Pro sample view, synthetic data
Keep reading


Sources
- Liberty Gold, Black Pine Feasibility Study results (8 Sep 2026): bnnbloomberg.ca
- Minera Alamos, Copperstone pre-feasibility study (27 May 2026): theglobeandmail.com
- USGS, Mineral Commodity Summaries 2026: Gold (Feb 2026): pubs.usgs.gov
- 17 CFR 229.1302, Individual property disclosure (Cornell Law School): law.cornell.edu
- CIM Definition Standards for Mineral Resources and Mineral Reserves (2014): mrmr.cim.org
- Microsoft Support, NPV function: support.microsoft.com
- Microsoft Support, XNPV function: support.microsoft.com
- Microsoft Support, Calculate multiple results by using a data table: support.microsoft.com
- Solaris Resources, Warintza pre-feasibility study results (6 Nov 2025): solarisresources.com
- Hudbay Minerals, Copper World Phase I pre-feasibility study news release (Sept 2023): s23.q4cdn.com
Discussion
Questions, corrections or field experience? Share them below. First-time comments are reviewed before they appear, and your email is never published.
No comments yet. Be the first to add a question or your experience.

 Double A Trading
 GemSprout Metals Limited
 Qader Group
 Ileys General Trading
 SG Gold Mining LLC
 VRV Global Pte Ltd
 Omsri International FZE
 G.I.T.T.
 Jaunita Erss Ltd
 Almosi SARL
 SRK Consulting
 Berks Gold Limited
 Mwerezi Minerals Company Limited
 Mining SARL
 SenGold Invest SAS
 Sean Mining Limited
 NTS Group (Pty) Ltd
 Mine4Africa











