

Exploration geochemistry · Survey design guide
Geochemical Survey Design: Soil, Stream and Plant Samples
A geochemical survey samples soil, stream sediment, rock or plants, then looks for metal levels clearly above background. This guide shows spacing from published programs, public datasets to check first, QA/QC rules and a sample-count budget tool.
Key takeaways
- The CIM best practice guidelines (2018) say a geochemical survey looks for concentrations clearly above regional or local background, and recommend an orientation survey over known mineralisation first.
- Published densities range widely: Geoscience Australia’s national survey is about one site per 5,500 km², Ireland’s Tellus stream sediments at least one per 4 km², and a Yilgarn gold soil program stepped from 400 m by 100 m to 40 m by 40 m.
- Public data can answer the first questions: the USGS National Geochemical Survey aims for one sample per 289 km², and British Columbia has digitised surface sediment results from nearly 800 assessment reports.
- Newfoundland and Labrador caps rebates at C$70 per analysis, so sample count drives the analytical budget; the planner on this page sizes it for your own grid.
- Satellite alteration maps can help place the first grid; sampling and drilling still test it.
In this article
- Regional versus property-scale geochemical survey work
- Designing a soil geochemical survey
- Soil sampling for gold exploration
- Stream sediment sampling for gold exploration
- Biogeochemistry in mineral exploration
- From samples to targets: analysis, QA/QC and interpretation
- Where satellite data fits alongside a geochemical survey
- Frequently asked questions
Before most deposits were drilled, someone found a patch of soil, a stream or a tree carrying more metal than its surroundings. We explain how a geochemical survey works at regional and property scale, how soil sampling for gold and other minerals is designed, what stream sediment sampling can and cannot tell you, where biogeochemistry fits, and how to size the sample count and budget.
Media Soil · stream sediment · vegetation
Markets USA · Australia · West Africa
Standard CIM best practice
A geochemical survey collects samples of a natural material (soil, stream sediment, rock, water or vegetation) across an area, analyses them for a set of elements and looks for places where the concentrations rise clearly above background. Those anomalies point to where metals have moved out of a hidden source, and they are one of the oldest and most reliable ways to decide where to drill. Our guide to exploration drilling methods and hole planning picks up from there.
The CIM Mineral Exploration Best Practice Guidelines describe geochemical surveys as having aided the search for deposits for many decades, across glaciated, permafrost, tropical, arid and other terrains. They list the media that can be sampled: lake and stream sediments, soils, parent overburden, vegetation, groundwater, surface water, individual minerals and bedrock. The aim is always the same: find concentrations sufficiently above regional or local background to be called anomalous.
“CSIRO researchers found gold in eucalyptus leaves above a deposit buried about 30 metres below the surface.”
Metals move. They weather out of rock, wash down streams and get carried up by roots. A good geochemical anomaly tells you roughly where the source is and what it contains; drilling tells you whether it is worth anything.
Regional versus property-scale geochemical survey work
The CIM guidelines separate two scales. A regional geochemical survey evaluates large areas for their potential to host a target deposit. A property-scale survey is carried out to find potentially economic mineralisation within a licence. The media, spacing and budget differ by orders of magnitude.
Regional surveys by government geological surveys
Many regional surveys are run by national geological surveys, and the CIM guidelines note that their results are publicly available with detailed descriptions of methods and quality control. That makes them the first dataset to check before spending anything. Three examples show the range of scales:
- Australia: the National Geochemical Survey of Australia sampled catchment outlet sediments at 1,315 sites, at two depths (0–10 cm and roughly 60–80 cm), sieved to under 2 mm and under 75 µm, at an average density of about one site per 5,500 km², and analysed more than 60 elements.
- United Kingdom: the British Geological Survey’s stream sediment geochemical atlas draws on about 111,000 rural stream-sediment samples at roughly one per 2.5 km², covering 18 elements and 45 years of work.
- Western Australia: the state geological survey has run helicopter-supported regional regolith sampling on a 4 km by 4 km grid, adding gravity readings from 1998.
Property-scale soil grids
Once a licence is held, the geochemical survey tightens to grids. A published gold program in the Black Flag area of Western Australia’s Yilgarn used soil grids from 400 m by 100 m for reconnaissance down to 40 m by 40 m to delineate anomalies before drilling. That is a twenty-five-fold jump in samples per square kilometre between the two stages, and it is typical of how programs step in.
Public geochemical data to check before you sample
Government surveys have already sampled much of the ground, so a desk review of their data is the cheapest first step in any geochemical survey. Ireland’s Tellus programme (Geological Survey Ireland) reports 8,861 stream sediment sites in its northern and south-east regions, at a typical density of at least one site per 4 km², with 56 analytes measured in the fine fraction under 150 µm. Its topsoil data come from almost 10,000 sites at about one per 4 km², sampled at two depths (roughly 5 to 20 cm and 35 to 50 cm) and analysed by both total XRF and aqua regia partial extraction (Tellus Data Guidance Note, 2022).
In the United States, the USGS National Geochemical Survey database compiles stream sediment and soil data with a target density of one sample per 289 km², and lists 77,212 records. In British Columbia, the Geological Survey’s GeoFile 2026-02 digitises surface sediment geochemistry from nearly 800 assessment reports, drawn from an archive of more than 40,000 reports that become public after a one-year confidentiality period (BCGS, updated July 2026).
| Survey | Medium | Density (one site per) |
|---|---|---|
| USGS National Geochemical Survey (target) | Stream sediment and soil | 289 km² |
| National Geochemical Survey of Australia | Catchment outlet sediment | about 5,500 km² |
| Tellus, Ireland | Stream sediment, topsoil | at least 4 km² |
| British Geological Survey atlas | Stream sediment | about 2.5 km² |
Check what already exists over your licence: an old regional anomaly that sits inside your boundary can justify a first property grid, and a clean regional result tells you the medium and fraction that were used so your new samples stay comparable.
Designing a soil geochemical survey
A soil geochemical survey is the standard property-scale tool wherever soils formed in place over the rocks being explored. The CIM guidelines stress that whoever designs it needs a clear understanding of the target deposit model and its expected size, and a good, current topographic base map with all available geological and geophysical results.
Start with an orientation survey
The single most useful step, and the one most often skipped, is an orientation survey. The CIM guidelines recommend testing different sample media and methods over known mineralisation in a similar setting, to find which combination of medium, depth, size fraction and analysis gives the clearest signal under local conditions. A few hundred samples over a known deposit can save thousands of wasted samples over a new one.
Line and sample spacing
Spacing depends on target size. Lines should be close enough that the expected anomaly is crossed by at least two lines, and samples along each line close enough to catch it on each crossing. Most programs orient lines across the expected strike of the target, with wider line spacing and tighter sample spacing, the same logic as the 400 m by 100 m reconnaissance grid in the Black Flag program.
Laying out the grid
Grids used to be cut by hand and picketed; many are now laid out by GPS alone. Ontario’s early exploration permit guide describes cut grids as providing known coordinates for surveys such as soil sampling programs, and requires a permit for line cutting wider than 1.5 m. If you can sample from GPS points without clearing, you avoid both the permit and the disturbance.
Which horizon, which fraction
Soils are layered, and metals are not spread evenly between the layers. Many programs sample a consistent horizon at a consistent depth, and the orientation survey should decide which. Size fraction matters as much: the national Australian survey analysed both a coarse (under 2 mm) and a fine (under 75 µm) fraction, and many USGS stream-sediment programs have used the minus-80-mesh fraction, under 0.180 mm. Consistency matters more than the choice itself, because a change of horizon or fraction midway through a grid can create false anomalies.
Collecting soil samples in the field
The CIM guidelines put the field basics plainly: collect a consistent medium, determine sample depths and locations accurately, keep good field notes and apply the same preparation protocol every time. In practice that means each sampler digs to the agreed horizon, records the actual depth, notes the soil colour, texture and any rock fragments, and logs the landform and any disturbance such as tracks, old workings or burnt ground. Tools and bags should be clean, and samples should not be taken beside roads, fences or dumps that may carry contamination.
Record every site with GPS, including the ones where no sample could be taken, and say why. A gap on a grid map is much easier to interpret when you know whether it was a rock outcrop, a swamp or a missed site. Photographs of a few typical pits per day make later disputes about horizon quick to settle.
Soil sampling for mineral exploration beyond gold
The same design logic carries across commodities, but the element suite changes with the deposit model. The CIM guidelines expect the designer to understand that model before choosing the medium, spacing and analysis. Base-metal targets usually call for multi-element packages with copper, lead, zinc and their pathfinders; other targets need their own suites and sometimes different digestions. Our comparison of XRF, fusion and assay methods explains those choices. Soil sampling mineral exploration programs for different commodities on the same licence can often share one set of samples if the analytical package is chosen with both in mind.
What a soil program costs
Newfoundland and Labrador’s maximum allowable cost schedule gives rare public reference points for its incentive rebates: C$70 per geochemical analysis, C$800 per kilometre of linecutting, C$900 per day for a professional geologist and C$450 per day for an assistant. They are caps for rebates, not market prices, and the schedule is undated, but they show where the money goes: analysis scales with sample count, while labour scales with the days it takes to walk the grid. The planner above sizes the analytical part; add field days, travel, freight and preparation for the whole budget.
Soil that was carried in by wind, water or ice has no chemical link to the rock beneath it. Sampling it on a tight grid produces clean maps of nothing. Map the regolith first, and drill through transported cover where needed.
Worked example: how spacing changes the sample count
Take a grid 2,000 m long and 1,000 m wide, with lines every 400 m and a sample every 100 m along each line. That is 6 lines with 11 samples each, or 66 samples. Tighten the same grid to the 40 m by 40 m a typical infill spacing for defining anomalies and it needs 51 lines with 26 samples each, or 1,326 samples. At the C$70 Newfoundland and Labrador rebate cap per analysis, that is about C$4,620 against C$92,820 for analysis alone, before field days, freight, preparation and quality-control samples. Those figures are caps, not quotes, but they show why programs step from wide reconnaissance spacing to tight infill only over the anomalies that justify it.
Geochemical sampling: choosing the medium first
Geochemical sampling starts with the medium, not the spacing. The CIM guidelines list lake and stream sediments, soils, overburden, vegetation, groundwater, surface water, individual minerals and bedrock as options, and the orientation survey is how you decide between them. Tellus shows why the analytical method matters too: the same topsoil samples were measured by total XRF and by aqua regia partial extraction, two digestions that can give different answers for the same element.
Calculator
How many soil samples will my grid need?
Enter your own grid size, spacing and cost per analysis.
- Samples including QC: 73
- Samples per km²: 33
- Analytical budget: $5,082
Example values only, not a benchmark. Lines run across strike at the line spacing along the grid length, with samples at the sample spacing along each line, counting both ends. The default 400 m by 100 m spacing follows the typical reconnaissance spacing; the C$70 default is the per-analysis cap in Newfoundland and Labrador’s rebate schedule, not a laboratory quote (use your own price). Field labour, freight and preparation are excluded.
Soil sampling for gold exploration
Soil sampling for gold exploration has particular difficulties. Gold is present at very low concentrations, often measured in parts per billion in soil, and it can occur as scattered particles that make repeat samples disagree. Many programs therefore analyse pathfinder elements alongside gold (arsenic, antimony, bismuth, tellurium or copper, depending on the deposit type) to build a broader, more stable anomaly.
Weathered terrain and laterite
In deeply weathered terrains such as West Africa and parts of Australia, the soil profile can be tens of metres deep and partly transported. Gold may be depleted in some layers and enriched in others. Here the geochemical survey often switches from surface soils to lateritic material, termite mounds or drill samples of the regolith, guided by regolith mapping. Our guide to geological mapping methods and scales covers mapping that underpins this choice.
Drilling for soil samples beneath cover
Where cover is too thick or transported, geologists drill for soil samples from the buried interface. Auger rigs handle shallow soil; Ontario’s guide lists auger drilling for soil sampling and overburden drilling for glacial deposits. For deeper weathered profiles, Novo Resources’ drilling glossary describes RAB and aircore as early-stage tools that sample weathered material, quoted at $12–20 and $18–30 per metre respectively. Each hole becomes a geochemical sample of the buried surface, and the resulting grid is interpreted just like a soil survey. If you need a rig for this, our guide to picking an exploration drilling contractor covers what to ask.
| Sample medium | Scale | What it tells you | Watch out for |
|---|---|---|---|
| Stream sediment | Regional to district | Which catchments drain mineralised rock | Dilution downstream, heavy-mineral traps |
| Soil (residual) | Property grid | Where the source sits within a catchment | Wrong horizon, transported cover |
| Lag, laterite, termite mounds | Property, weathered terrain | Signal through deep weathering | Complex regolith history |
| Auger / aircore bottom-of-hole | Under cover | Buried bedrock geochemistry | Drilling cost, contamination |
| Vegetation (biogeochemistry) | Property, deep cover | Metals drawn up by deep roots | Species and season effects |
| Rock chips | Outcrop | Metal content of exposed rock | Selective sampling bias |
Multi-element analysis on the same pulp is usually cheaper than going back later. Arsenic, antimony or copper can outline a gold system more smoothly than gold alone and help separate a real trend from a single lucky particle.
Stream sediment sampling for gold exploration
Stream sediments sample a whole catchment at once, because everything that erodes upstream passes through. That makes stream sediment sampling for gold exploration and other metals the natural first step over unexplored ground: one sample can screen several square kilometres, as the UK survey’s one site per 2.5 km² shows.
Fine fraction, heavy minerals and bulk leach
Fine sediment is the usual medium for most elements. The USGS map of gold in stream sediments of the Richfield quadrangle, Utah, for example, is based on the minus-80-mesh (under 0.180 mm) fraction. For gold, which is heavy and patchy, programs often add panned heavy-mineral concentrates or large bulk samples leached for gold (the “BLEG” approach), because a small fine-fraction sample can easily miss the few particles present. The UK programme collected panned concentrates alongside sediments at each site.
Where to take the sample
Sample active sediment from the stream bed, away from banks that may have slumped in and from obvious contamination such as roads, bridges and old workings. Record the catchment each sample drains; the anomaly belongs to that catchment, not to the sample point. The UK survey concentrated on small, first- and second-order streams, which keeps each catchment small enough to follow up.
Following up a stream anomaly
A stream anomaly tells you which catchment to look in, not where in it. The usual next step is to resample upstream along the anomalous drainage and its tributaries, at closer spacing, until the signal drops away. The point where it disappears brackets the source. From there, a soil grid over the slopes feeding that reach of the stream narrows the target further. Keep the same size fraction and method as the original survey during follow-up, or the new numbers will not be comparable with the old.
Heavy minerals behave differently from fine sediment. Gold particles collect in natural traps (behind boulders, at the inside of bends and in bedrock cracks), so a single panned sample can be high or low by chance. Repeat samples at the same site and a few metres apart help separate a real anomaly from a lucky trap.
Biogeochemistry in mineral exploration
Plants take up metals through their roots, and some roots reach far below the surface. Biogeochemistry in mineral exploration samples leaves, bark or twigs and analyses them as a geochemical medium. Its best-known recent demonstration came from Western Australia: CSIRO researchers reported gold particles in eucalyptus leaves near Kalgoorlie, above a deposit buried about 30 metres below the surface under sediments up to 60 million years old. The particles were about one-fifth the diameter of a human hair. The work was published in Nature Communications.
The CSIRO team described sampling leaves, other vegetation, soil and termite mounds, and presented the approach as a lower-cost, lower-impact complement to drilling in covered terrain. It works best where deep-rooted species are common and consistent across the area. Species, plant part and season all affect metal content, so a biogeochemical geochemical survey needs the same orientation work and consistency as a soil program.
Running a biogeochemical program
Choose one species that grows across the whole area, and sample the same plant part from trees of similar size in the same season, ideally within a few weeks. Record the species, the part sampled, tree height or trunk size and any signs of disease or fire. Wash or do not wash samples consistently, because surface dust can carry its own metal signal; the CSIRO work used synchrotron X-ray imaging to show the gold sat inside the leaf structure rather than as dust on it. As with soils, an orientation line over known mineralisation shows whether the chosen species responds before you commit to a full grid.
Soil, stream and plant sampling leave almost no footprint compared with trenching or drilling. Using them to cut the target list first means fewer pads, tracks and trenches on community land.
From samples to targets: analysis, QA/QC and interpretation
The CIM guidelines set out what makes a property-scale geochemical survey defensible: a consistent sample medium, accurate depths and locations, good field notes, consistent preparation, and a QA/QC program with blanks, certified reference materials and field duplicates. They admit the practical difficulty: sourcing suitable blank and reference material for soils is harder than for rock. They also recommend involving a qualified geochemist in planning, supervising and interpreting the work.
In practice, a soil program might insert a blank, a reference sample or a field duplicate at a fixed rate through each batch, and flag any batch where the reference values drift. Field duplicates taken a metre or two apart show how much natural variation sits within a single site, which is the noise floor every anomaly has to rise above. Keep the analytical certificates and metadata with the data, as the CIM guidelines ask, so a later reviewer can trace every number.
Field analysers
Handheld XRF can measure some elements in soil and rock on site. The CIM guidelines note it can speed up decisions and reveal unexpected mineralisation, but they warn that users must understand its strengths and shortcomings and report them with the results. Use it to guide sampling and to check laboratory results, not to replace them.
Levelling and interpretation
Background varies with rock type, soil type and position on the slope. Before drawing anomaly contours, many geochemists level the data by rock or regolith unit, so a mafic rock is not flagged simply for being mafic. Anomalies that line up with a mapped structure, a geophysical feature or an alteration zone are the ones that earn follow-up. Our geophysics hub and remote sensing guide cover the datasets geochemistry is usually overlaid on.
QA/QC checklist for a property-scale geochemical survey
The CIM guidelines say QA/QC should be planned from the start and should include external blanks, certified reference materials, duplicate samples and regular check sampling by a third-party laboratory, with blanks and reference materials inserted often enough to give statistical confidence. They also recommend publishing full QA/QC results for early-stage programs. A simple working list:
- Insert blanks, reference materials and field duplicates at a fixed rate in every batch, and write the rate in the sampling plan.
- Send a share of pulps to a second laboratory as check samples.
- Record the digestion and detection limit with every result, because partial and total methods are not interchangeable.
- Keep the analytical certificates and sample metadata with the data set.
Reading a geochemical survey result
A single high sample is a lead, not a target. Anomalies that repeat on resampling, cover more than one adjacent site or line, and sit on a mapped structure, alteration zone or geophysical feature are the ones worth a drill test. Check whether the highest values follow a change in soil type or rock unit before drawing contours, since that can produce a false anomaly.

▶ Keeping maps, samples and targets in one place so results stay traceable · 3:21
Where satellite data fits alongside a geochemical survey
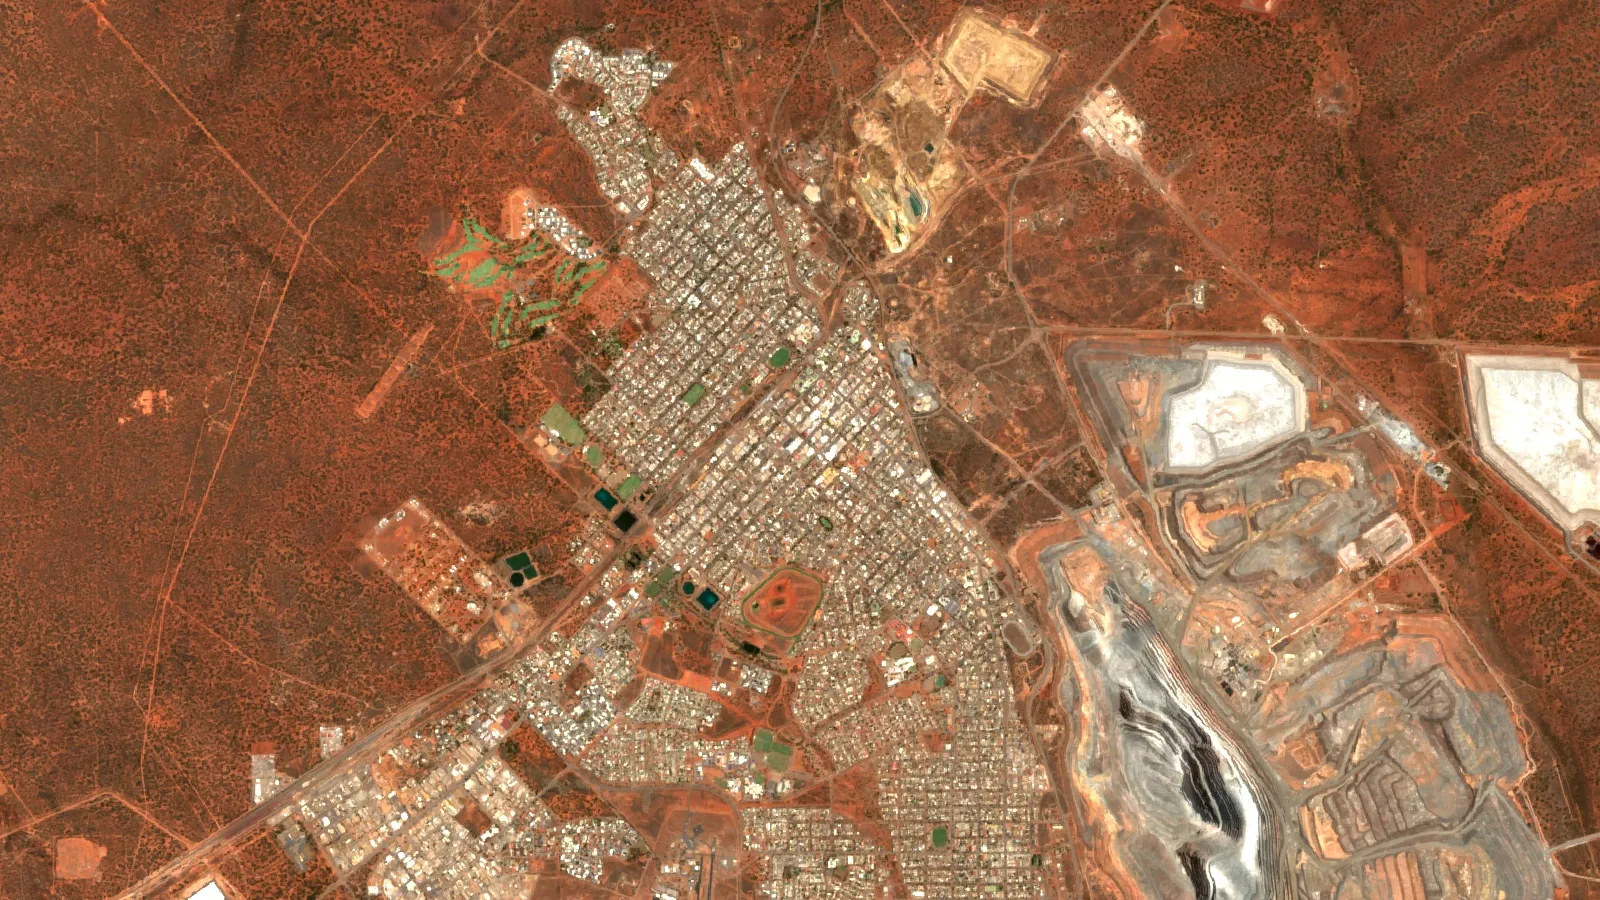
Satellites and geochemistry look at different things. Geochemistry measures metals in samples. Spectral satellite data maps the surface expression of alteration minerals, iron oxides and structures across an entire licence. Put together, they cross-check each other: a soil anomaly sitting on a mapped alteration zone and a fault is a far stronger target than either alone.
Our satellite-based mineral detection analyses multispectral and hyperspectral imagery to flag alteration halos, faults and fractures and deposit-associated patterns, with no ground disturbance. Send coordinates, a KML/KMZ file or a polygon, plus country and target mineral, and we deliver in 5 to 20 business days, early enough to decide where your soil grid goes.
- 📊 Premium mineral-intelligence report: high-potential zones, prospectivity heatmaps, estimated location and depth ranges and geological interpretation, as PDF plus GIS files to overlay on your geochemistry.
- Premium+ with TargetMax™ Drilling Intelligence: drilling-angle recommendations and 3D subsurface models for the drill test that follows.
- Economics: early exploration from months to days, at up to 80–85% lower early-exploration cost.
- Experience: 100,000+ hectares scanned, 20+ mineral types, 25+ countries.
- ⚠ Limits: satellite targets are exploration targets; sampling and drilling confirm them.
See our satellite-driven 3D mineral prospectivity mapping sample, draw your licence on mining.farmonaut.com: Map Your Mining Site, or request pricing via the mining query form.
Decide where the soil grid goes.
Send your licence boundary and target mineral. We return ranked target zones and structural and alteration maps to plan stream, soil and plant sampling around.
A single high soil sample makes a good press release and a weak target. Ask how many samples define the anomaly, on what spacing, whether it has been repeated, and whether it lines up with geology or geophysics.
“Australia’s national survey averaged roughly one sample site for every 5,500 square kilometres.”

▶ How satellites map the rock around a deposit, which a soil grid then tests · 4:25
Frequently asked questions
What is a geochemical survey in mineral exploration?
It is the systematic sampling and analysis of soil, stream sediment, rock, water or vegetation over an area to find element concentrations clearly above background. Those anomalies point toward buried mineralisation and help decide where to drill.
What spacing should a soil geochemical survey use?
It depends on target size. A published Western Australian gold program used 400 m by 100 m grids for reconnaissance and 40 m by 40 m to define anomalies before drilling. An orientation survey over known mineralisation is the best way to choose.
How is soil sampling for gold exploration different?
Gold occurs at very low concentrations and as scattered particles, so results are noisy. Programs often add pathfinder elements, sample a consistent horizon and fraction, and repeat anomalous samples before drilling.
What is stream sediment sampling for gold exploration?
Collecting active sediment from stream beds so each sample represents the catchment upstream. For gold, fine-fraction sediments are often supplemented with panned heavy-mineral concentrates or bulk leach samples.
What is biogeochemistry in mineral exploration?
Sampling plant material such as leaves or bark as a geochemical medium. CSIRO found gold particles in eucalyptus leaves above a deposit about 30 metres deep near Kalgoorlie, showing that plants can carry signals through cover.
When do you drill for soil samples?
When surface soil is transported or the weathered profile is deep. Auger, RAB or aircore holes sample the buried interface, and each hole is treated as a geochemical sample of the hidden surface.
Costs are caps and published rates, not quotes; confirm with your laboratory and contractors. Satellite targets are exploration targets, not mineral resources.
How much does a geochemical survey cost?
Cost depends on sample count, analysis suite, field days and access. Newfoundland and Labrador’s rebate schedule caps analysis at C$70 per sample, linecutting at C$800 per kilometre and a professional geologist at C$900 per day; these are caps, not market prices. Use the planner above for the analytical part and ask your laboratory and field contractor for quotes.
How many samples does a geochemical survey need?
It depends on target size and spacing. A 2 km by 1 km grid needs 66 samples at 400 m by 100 m and 1,326 at 40 m by 40 m. Add blanks, standards and duplicates on top, and let an orientation survey set the spacing.
Where can I find existing geochemical survey data?
Start with the national or state geological survey: Geoscience Australia, the British Geological Survey, Geological Survey Ireland (Tellus), the USGS National Geochemical Survey database and the British Columbia assessment report database all publish sample results. Download the method notes with the data.
What is the difference between geochemical and geophysical surveys?
Geochemical surveys measure element concentrations in samples such as soil, sediment or leaves. Geophysical surveys measure physical properties of the ground, such as magnetism or gravity, from the air or surface. Many programs overlay the two.
Do I need permission to take geochemical samples?
Usually yes. Get the landowner’s consent and check your regulator’s rules first: Ontario, for example, requires an early exploration permit for line cutting wider than 1.5 m, while GPS-located sampling needs no cleared line.
This page is for information only. Costs are caps and published rates, not quotes; confirm with your laboratory and contractors. Get landowner permission and any required permit before sampling. Satellite targets are exploration targets, not mineral resources.
Farmonaut mining
Screen your licence before you lay out the grid
Send your licence boundary and target mineral to get a quote for satellite target screening that helps place the first sampling lines.
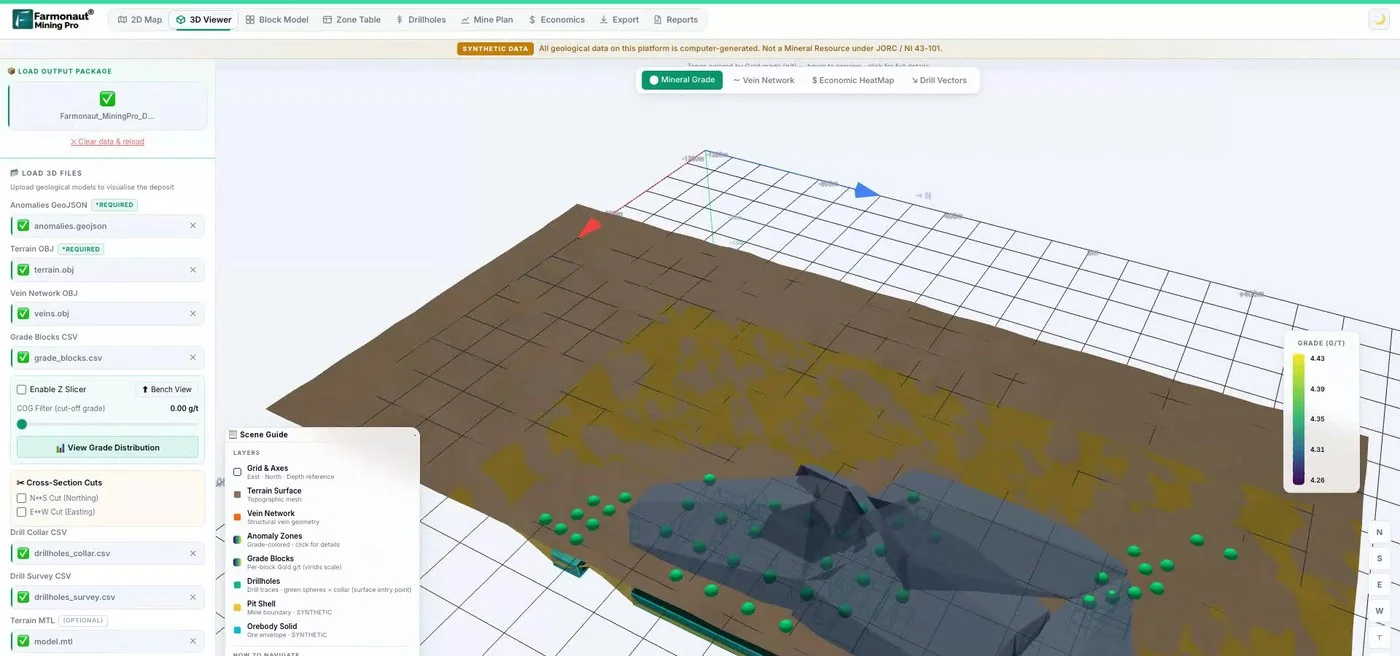
Mining Pro sample view, synthetic data
Keep reading
Sources
- CIM, Mineral Exploration Best Practice Guidelines (2018): mrmr.cim.org
- Geological Survey Ireland, Tellus Data Guidance Note (2022): gsi.geodata.gov.ie
- USGS, National Geochemical Survey database: mrdata.usgs.gov
- British Columbia Geological Survey, GeoFiles (updated July 2026): www2.gov.bc.ca
- Geoscience Australia, National Geochemical Survey of Australia: ga.gov.au
- British Geological Survey, Stream sediment geochemical atlas: bgs.ac.uk
- Newfoundland and Labrador, Maximum allowable costs schedule: gov.nl.ca
- Ontario, Early exploration permit activities: geologyontario.mndm.gov.on.ca
- USGS, Gold in stream sediments, Richfield quadrangle (MF-2138-D): pubs.usgs.gov
- CSIRO, Gilding the gum tree (2013): csiro.au
- Lintern et al., Nature Communications (2013), gold in eucalyptus leaves: nature.com
- Novo Resources, drilling techniques and costs: novoresources.com
Discussion
Questions, corrections or field experience? Share them below. First-time comments are reviewed before they appear, and your email is never published.
No comments yet. Be the first to add a question or your experience.

 Kubota
 Grow Indigo
 FFBS
 Jontra
 Kalustyan
 Tucor
 Geno
 Hayleys Agriculture
 Linx Agritech
 Adinet
 Save Your Soils
 Grandstream Algérie
 XOS Realty
 Geospatial Lab Africa
 Agro La Gándara
 HIPSAC
 ZOL Zimbabwe
 Juligerm

 Licence holder · Niger · Gold










