

Exploration geology · Guide
Surficial Geology Maps: Till, Overburden and Exploration
Surficial geology maps show the loose sediment that hides bedrock: till, sand, clay and regolith. Read them before sampling, because cover decides what a soil or till sample actually measures. Dispersal trains run from about 3 km to 100 km.
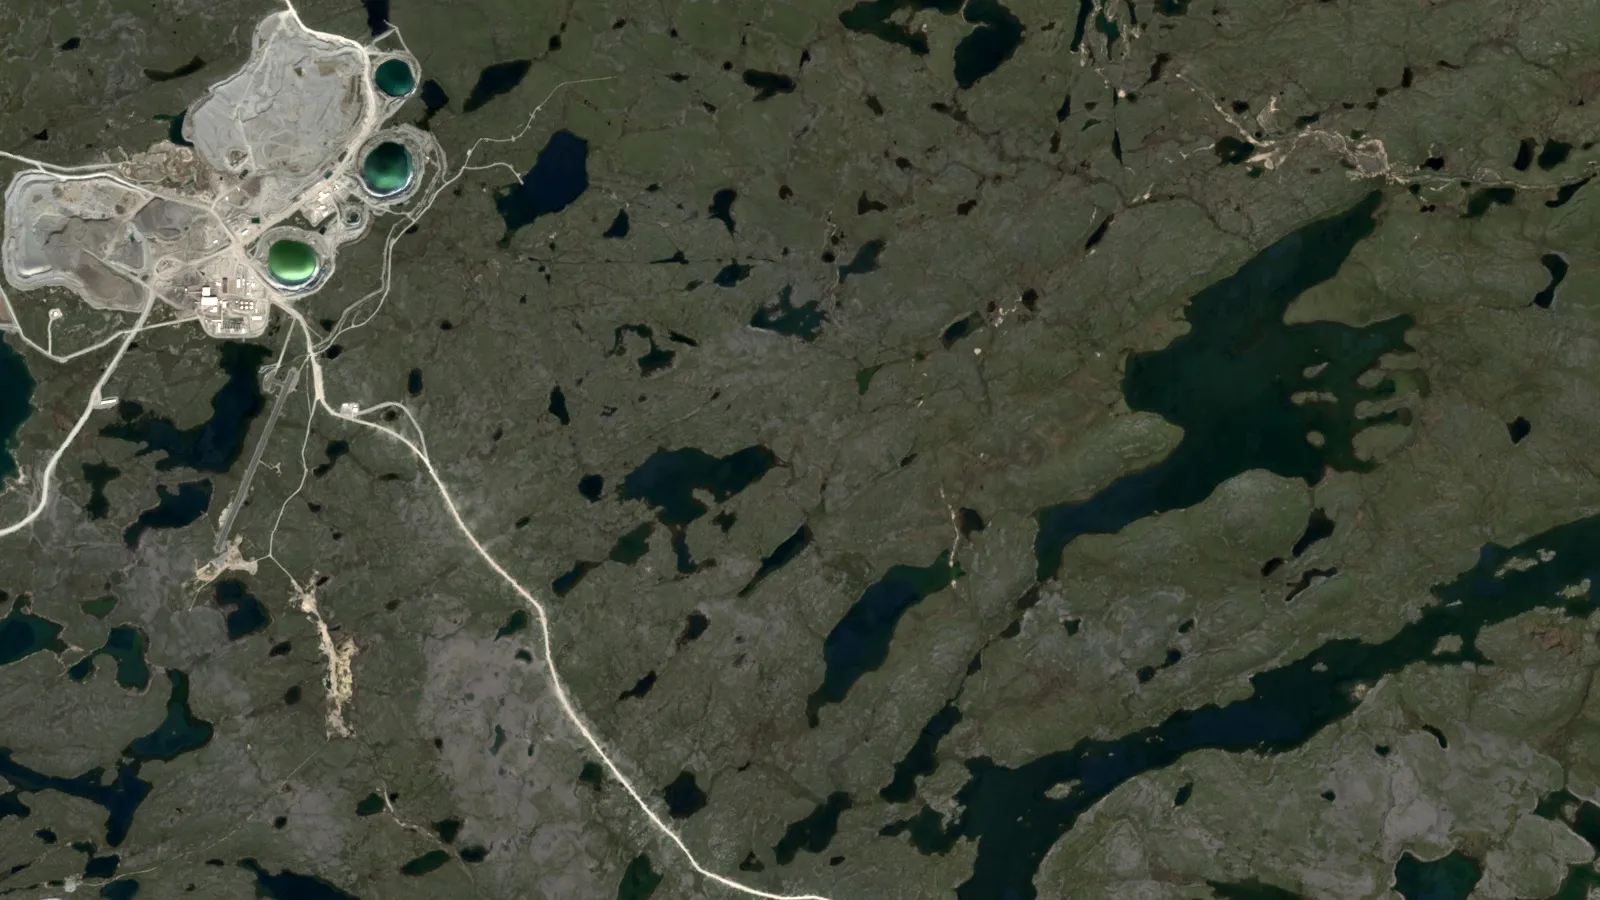
Key takeaways
- Surficial deposits are the youngest sediments on bedrock, mostly Quaternary, from about 2.6 million years ago (BGS).
- Till is the most common surface material in Canada, and Ice Age sediment covers most of the country except northern Yukon and the western Arctic Islands (Natural Resources Canada).
- At Blackwater, BC, gold grains form a train about 3 km long, spessartine garnet could extend it to about 10 km, and fine-fraction geochemistry shows under 1 km (Averill, 2017).
- The regional pyrope and chrome diopside train at Lac de Gras is about 100 km long and 50 km wide (GSC); the Slave Province survey sampled one 10 kg site per 180 square kilometres (Kerr and others, 1997).
- GSC predictive surficial maps use satellite imagery and elevation models, so check whether a map is field-checked, air-photo only or predictive.
In this article
- What is surficial geology, and what does a surficial geology map show?
- Surficial deposits explorers meet, and what each one tells you
- Why overburden matters: cover thickness, transported soil and false anomalies
- Where to get surficial geology maps: official portals by country
- How to read a surficial geology map for exploration
- Till sampling and drift prospecting step by step
- Glacial dispersal trains: how long they are and what they show
- Surficial geology outside glaciated ground: regolith and cover
- Surficial geology and satellite data
- Planning a till sampling survey: sample counts, weight and cost
- Frequently asked questions
What is surficial geology, and what does a surficial geology map show?
Surficial geology is the study of the loose, young sediments that lie on top of solid bedrock, mostly laid down in the last 2.6 million years (the Quaternary). A surficial geology map shows what those sediments are (till, sand and gravel, silt and clay, peat, windblown sand), how they formed, and where bedrock pokes through. For an explorer the map answers one question before any soil or rock sample is taken: what is between my sample and the rock I want to know about? The British Geological Survey (BGS) describes these deposits as the youngest on the map, mostly loose sediments formed by ice, water and wind (BGS Geology datasets).
This page is written for exploration geologists, claim and licence holders, consultants and investors who need to read these maps and use them. It covers the main deposit types, the overburden problem (the cover that hides bedrock), where the official map portals are, and how till sampling and drift prospecting work, with real examples of how far glacial debris travels. A calculator at the end sizes a till sampling programme. Terms are explained the first time they appear.
A word on names. Geologists in different countries use different labels for the same thing. In Canada and the United States the map is called surficial geology. In Britain the layer is called superficial deposits. In Ireland the equivalent product is the subsoils map, and in Australia the regolith map. Quaternary geology map is a common name for the same idea, with the focus on age. The sections below use all of them where the source does.
Surficial deposits explorers meet, and what each one tells you
Each deposit type has a different history and a different effect on sampling. The first thing to read on a map is the legend, because it tells you which of the types in the table covers your ground. In Canada, till is the most common surface material, and the Geological Survey of Canada (GSC) notes that Ice Age sediment forms a widespread but patchy blanket over most of the country, apart from northern Yukon and the western Arctic Islands (Natural Resources Canada, Geoscape Canada).
| Deposit type | How it formed | What it means for exploration |
|---|---|---|
| Till (glacial drift) | Debris dropped by glaciers; a mix of clay, silt, sand, gravel and boulders | The key sampling medium. Its make-up reflects the bedrock it travelled over, so it carries a record of up-ice rock (GSC Geoscape) |
| Glaciofluvial sand and gravel (eskers, outwash) | Sorted by meltwater streams. Eskers are long, winding ridges of sand and gravel; outwash is the gravel spread out in front of the ice | Eskers can carry indicator minerals several kilometres from source; at Kirkland Lake, Ontario, they contain pyrope and kimberlite boulders several kilometres down-ice from kimberlites (GSC) |
| Glaciolacustrine silt and clay | Settled in lakes dammed by melting ice | Can bury till and bedrock under thick, fine cover, which blocks soil geochemistry |
| Alluvium | River deposits | Stream-sediment sampling targets this; it mixes material from the whole catchment |
| Colluvium and mass-movement deposits | Moved downslope by gravity | Soil anomalies are shifted downhill from the source |
| Windblown (eolian) sand and loess | Moved by wind | Dilutes or hides surface signals, common on uplands in the US midwest (USGS) |
| Residual soil and regolith | Weathered in place from bedrock | Sits on its source, so soil geochemistry is directly useful (USGS) |
| Bedrock outcrop | No cover | Map, sample and measure it directly |
The GSC describes glaciofluvial material as the sand and gravel that streams carried away from retreating glaciers, and glaciolacustrine material as the silt and clay settled in glacial lakes and in coastal areas flooded when the land was pressed down under ice (Geoscape Canada, above). The US Geological Survey (USGS) adds that these sediments are in places over 1,000 feet (330 m) thick, and that where the blanket is absent, bedrock is either exposed or weathered to a residual soil (USGS Data Series 425, Soller and others).
Why overburden matters: cover thickness, transported soil and false anomalies
Overburden is the loose material above bedrock that has to be removed or drilled through to reach it. For a mine planner it is a cost. For an explorer it is a filter that decides which methods work. Three problems come up again and again.
Cover can be thin, or it can be 100 metres thick
At the Blackwater gold-silver deposit in south-central British Columbia, drilling showed that till thickens downslope from a few metres to about 100 m, and the till is oxidised only to a depth of 2 to 5 m (Averill, 2017, Geochemistry: Exploration, Environment, Analysis). A soil sample taken at the surface samples the top of that till, not the rock under it. Across the glaciated north-east and north-central United States, glacial ice built till and related lake and stream sediments that in places exceed 1,000 feet in thickness (USGS Data Series 425).
Transported material is not the rock below
Soil geochemistry assumes that the soil came from the rock under it. In glaciated ground that assumption is often wrong. Till is by definition moved material. The Newfoundland and Labrador Geological Survey explains that the ice-flow direction recorded in striations only gives the general direction of movement, while mapped dispersal trains (long lenses of till that carry debris from one bedrock source down-ice) give the specific source location and the distance of transport (Newfoundland and Labrador Geological Survey, Prospecting Under Cover poster). A soil survey over a till plain therefore draws a smeared picture of the rocks up-ice, and the anomaly can sit kilometres from its bedrock source.
The anomaly in the finest fraction is short, and the one in indicator minerals is long
The Blackwater study is a clean example. Gold grains in till form a train about 3 km long going down-ice, spessartine garnet from the deposit alteration could extend the detectable train to about 10 km, but in the finest till fraction the geochemical train is under 1 km, with gold and zinc the best indicators (Averill, 2017). The lesson is practical: if you only run fine-fraction geochemistry, you can miss a source that is 3 or 10 km up-ice. For the soil-sampling side of the story see our guide to geochemical surveys with soil and stream sediment sampling.
Where to get surficial geology maps: official portals by country
The best maps are national or state survey products, and many are open data. Check the licence on each before you reuse or republish. The table gives the portal or dataset, what it contains and the access terms the publisher states.
| Country or region | Product | What it holds | Access stated by publisher |
|---|---|---|---|
| Canada | GSC Surficial geology index map (Open Canada) | Two series: A Series maps (1909 to 2010) and Canadian Geoscience Maps (since 2010); updated twice a year | Geodatabase, ESRI REST and WMS services, MXD; Open Government Licence – Canada |
| Ontario | Surficial geology of southern Ontario (Ontario Data Catalogue) | Surficial units, plus eskers (long ridges of meltwater sand and gravel), bluffs, drumlins (streamlined hills of till shaped under moving ice), striae and gravel pits | KML and ZIP; Ministry Terms of Use |
| Quebec | Carte des dépôts de surface de la province de Québec (Géologie Québec) | Province-wide surficial deposits map with a methods and data report (MB 2020-10) | PDF report on the Géologie Québec site |
| United States | Map database for surficial materials in the conterminous US (USGS Data Series 425) | National overview map at 1:5,000,000, built from the Quaternary Geologic Atlas east of 102 degrees west and state maps to the west | USGS publication (Data Series 425) |
| Alaska | Quaternary geology of Alaska (Pewe, USGS Professional Paper 835, 1975) | 145-page report on Alaska’s glacial, eolian, fluvial, lacustrine, marine and volcanic Quaternary deposits, with one map plate | Archived PDF from Alaska DGGS |
| Great Britain | BGS Geology Viewer and BGS Geology datasets (superficial theme) | Bedrock and superficial deposits at several scales | Viewer; BGS states its data are delivered under the Open Government Licence, with a BGS acknowledgement. Check the licence on each BGS Geology dataset page |
| Ireland | National Subsoils Map (EPA, Teagasc, GSI) | Subsoils in 16 themes based on GSI Quaternary sediment types | WMS and download; Creative Commons Attribution 4.0 |
| Western Australia | Regolith of WA, 800 m grid (Department of Energy, Mines, Industry Regulation and Safety) | Nine classes: outcrop, residual or relict, and seven transported types | Shapefile; Creative Commons Attribution 3.0 Australia |
Canada
The Open Canada record for the GSC surficial index describes three kinds of modern map. Surficial Geology maps rest on full air-photo interpretation and systematic fieldwork. Reconnaissance Surficial Geology maps rest on air-photo interpretation with limited or no fieldwork. Predictive Surficial Geology maps are derived mainly from remote predictive mapping using satellite imagery, digital elevation models and algorithms, with some expert interpretation (Open Canada, Surficial geology index map). That difference matters when you read a legend: a predictive map is a good first screen, not a field-checked map. For provincial data, our guide to Ontario Geological Survey, MINFILE and SIGEOM data before staking shows where the provincial databases sit, and the Canada mineral deposits map puts known deposits on the same ground.
In Ontario the southern surficial dataset is distributed through the Ontario Data Catalogue as KML for Google Earth and as a ZIP. It carries units, eskers, bluffs, drumlins, striae and gravel pits, and the catalogue gives a dataset date of 2012 (Ontario Data Catalogue). Check the date: it tells you the mapping vintage, which can be decades older than the platform it is served on.
United States and Alaska
The USGS national surficial materials map is an overview. Its authors state that it is not meant for site-specific decisions or for display at scales more detailed than 1:5,000,000, and that abrupt changes along many state boundaries are an artefact of compiling state maps (USGS Data Series 425). For ground-level work, look for the state geological survey quadrangle maps. For our companion guide to the national and state bedrock maps, see the geological map of the USA. In Alaska the statewide reference is Pewe’s 1975 report on the state’s Quaternary deposits (USGS Professional Paper 835), available as an archived PDF from the state survey (Alaska DGGS). It is old, so treat it as a starting frame.
Britain and Ireland
The BGS Geology Viewer shows bedrock and superficial geology of Great Britain on any phone or desktop browser, and tapping a point returns the unit and an explanation. BGS states that the viewer keeps the superficial layer at every zoom level, that detail loses sharpness when you zoom in too far, and that 1:50,000 geology is available through its GeoIndex instead (BGS Geology Viewer). The superficial theme holds natural deposits still in place; deposits that have moved downslope go to a mass-movement theme and human-made ground to an artificial ground theme. For the wider set of British maps, see our guide to British Geological Survey maps. In Ireland, the National Subsoils Map sorts the Republic into 16 themes using Geological Survey Ireland Quaternary sediment types. It was released in 2006 and updated in 2023, with field data collected during 1998 to 2005 (data.gov.ie).
How to read a surficial geology map for exploration
A map is a set of decisions made by someone else. Read it in this order and write down your answers for each target area.
Infographic
Drift prospecting in 6 steps
- 1Pick the signalChoose indicator minerals, gold grains or geochemistry for the commodity.
- 2Map ice flowUse striations, landforms and the surficial map to fix direction.
- 3Sample the C horizonTake 2 to 10 kg till samples; log depth, till type and slope.
- 4Process by grain sizeClasts, fine matrix and heavy minerals each answer a different question.
- 5Set local backgroundFix anomaly thresholds from samples up-ice of the target.
- 6Follow the train up-iceInfill sample toward the head, then trench or drill.
- Read the legend and the map vintage first. Which series is it? Is it field-checked, air-photo only or predictive? Is the scale right for a claim block (1:50,000 or better) or only for a regional overview?
- Find the bedrock exposure. Outcrop and thin drift are where bedrock mapping, rock chips and soil sampling work best. They are also where earlier explorers sampled first.
- Mark the thick, fine-grained cover. Glaciolacustrine silt and clay or thick till means surface geochemistry reads the cover, not the rock. Plan indicator-mineral sampling, deeper sampling or geophysics instead.
- Plot landforms that show ice-flow direction. Drumlins, crag-and-tail hills (a rock knob with a tapering tail of till on its down-ice side) and flutings line up with ice flow. Striations on outcrop give the direction at a point. The Newfoundland and Labrador survey notes that at Strange Lake the highest clast concentration is on crag-and-tail hills more than 5 km long on the plateau (NL Geological Survey poster, above).
- Check for more than one ice-flow phase. At Lac de Gras, ice moved first south-westward, then westward, then north-westward (Kerr and others, Exploration 97). An older flow can leave debris in a direction the last flow does not explain.
- Locate eskers and other sorted gravel. They are linear sampling lines. At Kirkland Lake, Ontario, eskers hold pyrope and kimberlite boulders several kilometres down-ice from the kimberlites (GSC).
- Tie it to the known mineral occurrences. Overlay public mineral-occurrence databases on the surficial units to see which known deposits sit under which cover. Our guide to geological mapping methods and scales explains how scale limits what you can conclude.
Till sampling and drift prospecting step by step
Drift prospecting is the search for ore by sampling glacial drift (till and related sediments) and tracing what it contains back up-ice to the source. It works because glaciers pick up pieces of outcropping mineralisation and spread them down-ice. A mineralised dispersal train is typically a long lens of till oriented parallel to ice flow, often hundreds or thousands of times larger in area than the bedrock source it came from, which makes it easier to detect than the source itself (NL Geological Survey poster, above).
Chart
Kimberlite indicator minerals in till, 0.25 to 0.5 mm fraction
Approximate share of indicator grains, Slave Province regional survey
Step 1. Decide the target and the signal
The signal depends on the commodity. For kimberlite (diamond host rock), explorers look for indicator minerals such as chrome-rich pyrope garnet, chrome diopside, magnesium-rich ilmenite and chromite. For gold, they count gold grains and look at heavy-mineral and fine-fraction geochemistry. For rare-metal granite such as Strange Lake in Labrador, the train is read in boulders (clasts) and in many elements at once (beryllium, lead, uranium, thorium, yttrium, zirconium).
Step 2. Map the ice flow first
Without the ice-flow history, a sample result has no direction. Use striations, landforms and the surficial map. At Lac de Gras, the survey sampled a single till sheet and worked out the ice-flow sequence from striations before it interpreted the indicator results (Kerr and others, 1997).
Step 3. Sample the right till, at the right depth
Samples are usually taken from shallow pits dug to the C horizon, the unweathered layer under the soil. In the regional Slave Province programme, 300 bulk till samples of 10 kg each were taken from shallow hand-dug pits at one sample per 180 square kilometres (Kerr and others, 1997). In the GSC Ranch Lake follow-up, 108 till sites were sampled for geochemistry at 2 to 3 kg each, and 45 of them also gave a 10 kg sample for indicator minerals (GSC survey metadata, till sampling at Ranch Lake). Record the sample depth, the till type and the position on the slope for every site.
Step 4. Process and pick the right grain size
The NL survey splits the work into three size classes: pebbles, cobbles and boulders (above 5 mm) for clast counts, the fine matrix (below 0.063 mm) for geochemistry, and heavy minerals (0.25 to 2.0 mm) for indicator work. In the Slave Province programme, the 10 kg samples were disaggregated, sieved, tabled and separated in heavy liquid, then the 0.25 to 0.5 mm fraction was picked for indicators. That fraction held most of them: 91 of the 300 samples had confirmed indicator minerals in the 0.25 to 0.5 mm fraction, while in the 0.5 to 1.0 mm fraction, picked only for samples with five or more suspected pyropes, just 20 samples had them, and the authors conclude that for small samples of about 10 kg the finer grain size must be picked (Kerr and others, 1997).
Step 5. Set the anomaly threshold with local background
The GSC notes that at Lac de Gras, a till sample with more than 5 sand-sized pyrope grains in a 10 kg sample is considered anomalous (GSC, Diamond exploration pages). That number applies to that field. Elsewhere, set the threshold from your own background samples up-ice of the target.
Step 6. Follow the train up-ice and infill
Counts rise toward the source and fall down-ice. Infill sampling narrows the head of the train, and then trenching, overburden drilling or bedrock drilling tests it. Sampling in the third dimension matters: at Blackwater the gold-garnet train thickens to nearly 30 m and climbs upward within the till section (Averill, 2017), so a single surface layer does not show the whole train.
Glacial dispersal trains: how long they are and what they show
A dispersal train has a head, where concentration is highest near the source, and a tail, where values fall gradually to background (NL Geological Survey poster). The length depends on how hard the source rock is to erode, the ice speed and flow history, the terrain, and the grain you measure. The examples in the chart below come from published surveys. They are not comparable on one scale: they measure different things (clasts, indicator minerals or geochemistry) in different settings.
Chart
Indicator grains per 10 kg till sample
Lowest and highest counts reported; different grain types and size fractions
Chart
Reported length of glacial dispersal trains
Kilometres down-ice; different grain types and settings, so read as examples
Examples with numbers
- Lac de Gras, Northwest Territories. A GSC summary describes a north-west trending train of pyrope and chrome diopside about 100 km long and 50 km wide, from a field of roughly 150 kimberlite pipes. Trains from single pipes are narrow, with widths of hundreds of metres, and reach several tens of kilometres down-ice (GSC, Diamond exploration pages). In the regional survey, the highest indicator counts lay in the north half of the Lac de Gras map area, where more than 50 pipes had been reported, and counts ranged from 0 to 676 indicator grains per 10 kg sample (Kerr and others, 1997).
- Strange Lake, Labrador. Peralkaline granite mineralisation was found by boulder tracing during follow-up of lake-sediment anomalies, with ribbon-shaped geochemical and clast trains more than 40 km long (NL Geological Survey poster).
- Blackwater, British Columbia. A gold-grain train about 1.3 km wide, about 3 km long down-ice, and 10 to 641 gold grains per 10 kg of the under-2 mm till matrix (Averill, 2017).
- Grand Falls to Glenwood, central Newfoundland. Three ice-flow phases, with dispersal distances of clasts and till geochemistry under 5 km (NL Geological Survey poster).
The Lac de Gras diamond search is the textbook case for the method. The GSC notes that eskers at Kirkland Lake, Ontario, contain pyrope and kimberlite boulders several kilometres down-ice from the kimberlites, and that kimberlite indicator minerals are recovered from the medium to very coarse sand fraction of till (GSC, Diamond exploration pages). Pebble-size clasts in the Slave Province till were carried up to about 40 km, and sand grains up to 75 to 100 km, from their rock sources (Kerr and others, 1997).
Read the pattern, not just the length
The NL survey shows how pattern varies with ice history. Ice-cap centres on the island of Newfoundland gave short, diffuse dispersal patterns. In Labrador, away from the ice-dispersal centre, trains are commonly longer and ribbon-shaped (Strange Lake) or fan-shaped (Central Mineral Belt). Near the centre of an ice sheet, they can be amoeboid, with several short trains in different directions. A train that does not line up with the last ice-flow direction is a clue to an older flow, and the Lac de Gras survey is a good case where older south-westward and westward flows explain indicator grains in places the final north-westward flow cannot.
What to avoid
Low sample density can miss a train. The Slave Province survey, at one sample per 180 square kilometres, could not resolve trains from individual pipes. It did find the combined regional plume, and the authors note that kimberlites in the south-east of the map area and in the east of the Aylmer Lake area were not detected (Kerr and others, 1997). Do not read an empty result as proof of no source: some kimberlites carry a different indicator suite from the ones the survey was picking for.
Surficial geology outside glaciated ground: regolith and cover
In Australia, Africa and much of the tropics, the cover is not glacial. It is regolith: a deep, weathered blanket of residual soil, transported sediment and hardened layers. Maps classify it by whether it formed in place or moved. The Western Australia regolith map divides rock units into nine groups: outcrop, residual or relict units (in-place regolith or remnants of an earlier landscape), and seven transported types (slope deposits, alluvium, lake deposits, calcrete, sandplain, coastal deposits and tidal deposits), at an 800 m grid compiled from 1:250,000 geological maps (Regolith of WA, 800 metre grid, data.gov.au).
The key difference from the glacial case is the logic of the signal. On a residual landscape, soil and lag (the loose coarse fragments left on the surface) can sit above their source, so surface geochemistry is directly useful. Where a map shows transported units over the target, the same sample reads the cover. Always check the legend for the word residual before trusting a soil anomaly. Two further points hold in any climate: surface-only maps usually say nothing about thickness, so pair them with drill logs, water-bore records or geophysics; and the sediment can be a metre thick or hundreds of metres thick within the same legend colour.

▶ How to read Western Australian geological map portals before prospecting · 4:13
Surficial geology and satellite data
Satellites and digital elevation models are now part of surficial mapping itself. As noted above, the GSC predictive surficial maps are built mainly from satellite imagery, elevation models and algorithms (Open Canada). Landforms such as drumlins, eskers and crag-and-tail hills show up in elevation data, and ice-flow direction can be read from them over large areas before anyone visits the field.
For a licence owner, the practical use is screening. Satellite imagery can show where rock is exposed, where cover is vegetated or wet, and how the ground changes across a block, which helps decide where to put boots on the ground and where indicator sampling will be needed. A Farmonaut satellite mineral report works on this surface and near-surface signal. Satellites map surface and near-surface signatures, and sampling and drilling confirm them, so thick cover is a place where till sampling and geophysics carry the main load.
▶ Remote sensing for mining explained without jargon · 2:01
Planning a till sampling survey: sample counts, weight and cost
Use the calculator below to size a programme. The default density, one sample per 180 square kilometres with 10 kg samples, matches the regional Slave Province survey described above. Detailed follow-up programmes use much closer spacing. The unit cost and daily rate are inputs, not benchmarks, because they depend on region, access and the lab.
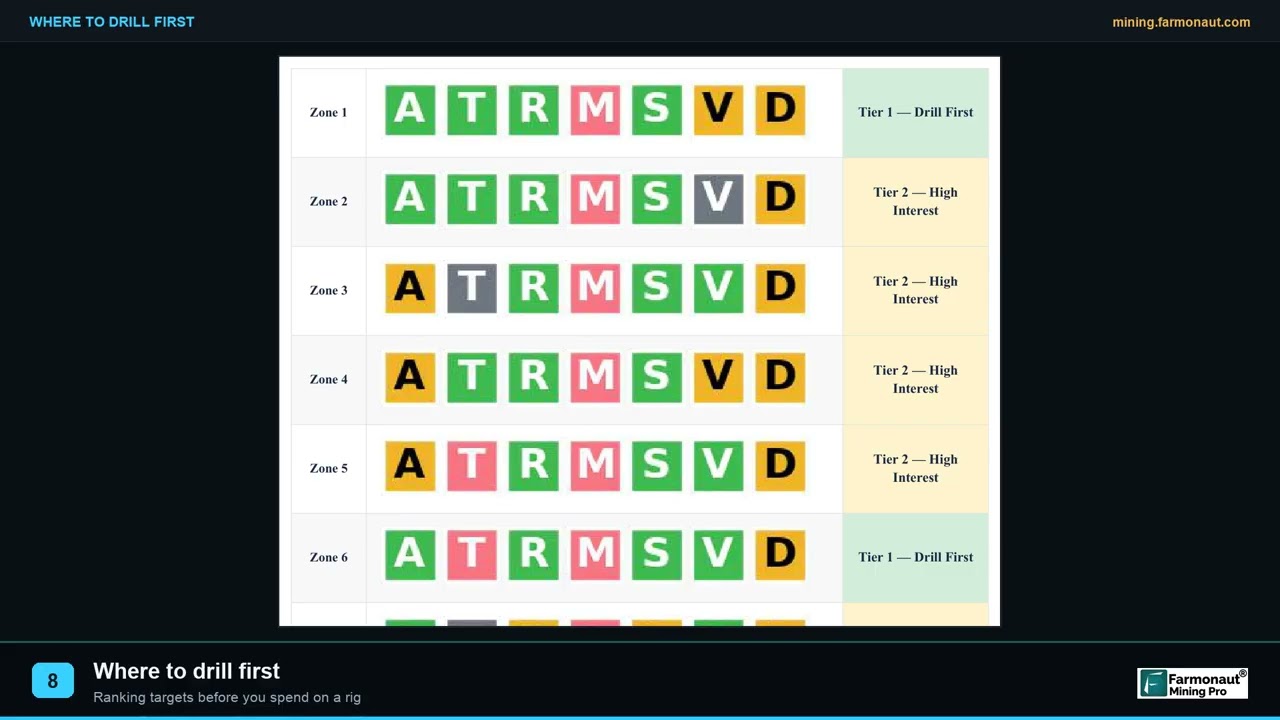
When you move from a regional survey to a target-scale one, the design question changes: not “is there a train?” but “where is its head?” That is the same targeting logic described in our guide to exploration targeting, ranking targets so the first drill hole is the best bet and not just the first one reached.
Calculator
How many till samples, how much weight and what cost?
Enter your own area, sample density, sample weight and unit costs.
- Total sample weight (kg): 100
- Programme cost (US$): $4,000
- Crew days in the field: 1.2
Example values only, not a benchmark. The 180 km2 per sample and 10 kg sample match the regional Slave Province survey (Kerr and others, Exploration 97, GSC). Unit cost and crew rate are example inputs; use quotes from your lab and contractor.
▶ How exploration targets are ranked into a drill order · 2:19
Frequently asked questions
What is the difference between surficial geology and bedrock geology?
Bedrock geology maps the solid rock, wherever it lies. Surficial geology maps the loose sediments on top of it. Many maps show both, as the BGS Geology Viewer does for Great Britain, and a bedrock map often hides the cover that a surficial map reveals.
What does a surficial geology map show?
It shows the type, origin and often the thickness of the loose deposits at the surface (till, sand and gravel, clay, alluvium, peat), landforms such as eskers and drumlins, ice-flow direction symbols, and areas of exposed bedrock. Canadian Geoscience Maps, the GSC series published since 2010, draw on a surficial data model with over 275 geological elements, according to the Open Canada record.
What are surficial deposits?
They are unconsolidated sediments laid down at or near the surface during the Quaternary period, which BGS dates to about 2.6 million years ago. Most were formed by ice, water or wind.
What is glacial till?
Till is debris deposited directly by glaciers. It is typically a mix of clay, silt, sand, gravel and boulders, and its composition reflects the bedrock it came from, for example sandy till over granite (GSC Geoscape).
What is overburden in geology and mining?
Overburden is the loose material that lies above bedrock or an orebody. In exploration it controls which sampling methods work, and in mining it is the material that is stripped or removed to reach the ore.
Where can I find a Quaternary geology map?
Start with the survey for your region: the GSC and provincial surveys in Canada, the USGS and state surveys in the United States, BGS in Great Britain, Geological Survey Ireland and the EPA in Ireland, and the state agency in Western Australia. The table above lists the products with their access terms.
What is till sampling?
It is the collection of glacial sediment, usually 2 to 10 kg per site, to analyse its geochemistry, its clasts or its heavy minerals. Programmes in Canada have used about 10 kg per site for indicator minerals and 2 to 3 kg for geochemistry (GSC survey metadata).
What is drift prospecting?
It is exploration that traces ore-derived material in glacial drift back up-ice to its bedrock source. The trail of such material is a glacial dispersal train.
What is a glacial dispersal train?
It is a lens of glacial sediment, elongated along the ice-flow direction, that contains debris from one bedrock source. It is richest at the head near the source and thins to background down-ice. Reported lengths range from about 3 km for gold grains at Blackwater to about 100 km for the regional kimberlite-indicator train at Lac de Gras.
How far do glacial dispersal trains travel?
It depends on the source, ice history and the grain size measured. The examples above range from under 5 km in central Newfoundland to more than 40 km at Strange Lake and about 100 km at Lac de Gras.
Does surficial mapping work in places that were never glaciated?
Yes, but the central question changes from glacial transport to whether cover is residual or transported. Regolith maps such as the Western Australia grid separate in-place material from seven transported types.
Can satellite imagery map surficial geology?
It can help. The GSC makes predictive surficial maps from satellite imagery and elevation models, and then labels them as predictive, which tells readers they have had less field checking than standard maps.
This page is for information only. It is not investment or legal advice. Check each dataset’s licence, and get landowner and regulator permission before sampling. Satellite results are exploration targets that sit ahead of any resource estimate.
Farmonaut mining
Screen your licence area from space
Send a boundary and the minerals you are targeting, and receive a satellite exploration screening to plan where to sample first.
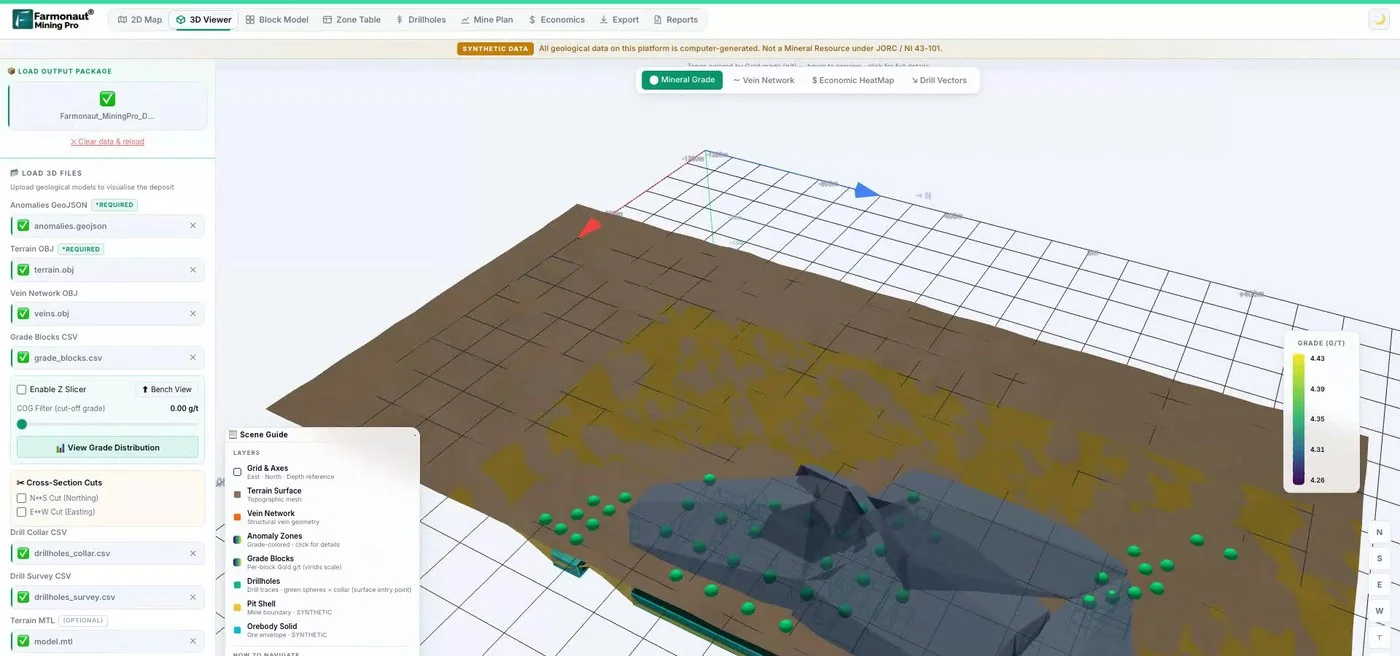
Mining Pro sample view, synthetic data
Sources
- BGS, BGS Geology datasets: bgs.ac.uk
- BGS, Geology Viewer: bgs.ac.uk
- Natural Resources Canada, Geoscape Canada: Ice Age sediments: bac-lac.wayback.archive-it.org
- Open Canada, Surficial geology index map (GSC): open.canada.ca
- Ontario Data Catalogue, Surficial geology of southern Ontario: data.ontario.ca
- Géologie Québec, Carte des dépôts de surface de la province de Québec (MB 2020-10): gq.mines.gouv.qc.ca
- USGS, Data Series 425: Map database for surficial materials in the conterminous US: pubs.usgs.gov
- Alaska DGGS, Quaternary geology of Alaska (Pewe, 1975): dggs.alaska.gov
- data.gov.ie, National Subsoils Map (EPA, Teagasc, GSI): data.gov.ie
- data.gov.au, Regolith of WA, 800 metre grid: data.gov.au
- Averill (2017), Blackwater gold-spessartine-pyrolusite dispersal train, Geochemistry: Exploration, Environment, Analysis: doi.org
- Newfoundland and Labrador Geological Survey, Prospecting Under Cover: Glacial Dispersal (poster): gov.nl.ca
- Kerr and others, Kimberlite Indicator Minerals in Till, Central Slave Province (Exploration 97): 911metallurgist.com
- GSC, Till sampling survey, Ranch Lake kimberlite area (survey metadata): geochem.nrcan.gc.ca
- GSC, Diamond exploration pages (archived): bac-lac.wayback.archive-it.org
Discussion
Questions, corrections or field experience? Share them below. First-time comments are reviewed before they appear, and your email is never published.
No comments yet. Be the first to add a question or your experience.

 Congo Mining Solutions
 Mining SARL
 SenGold Invest SAS
 Sania Corporation
 Sean Mining Limited
 NTS Group (Pty) Ltd
 Mine4Africa
 Lithspo Minerals Limited
 Tintina Mining Group
 Dalgety Minerals Pty Ltd
 Faith At Work (Pty) Ltd
 Geotech Mining Solutions plc
 Vulcan International Limited
 Kidepo Associates
 GKY Mining
 Alkimy SARL
 Double A Trading
 GemSprout Metals Limited
 Qader Group
 Ileys General Trading
 SG Gold Mining LLC
 VRV Global Pte Ltd
 Omsri International FZE

 Client · Tanzania · Gold
 Client & affiliate partner · Ghana · Gold










