

Queensland mines · Full list and operators
List of Mines in Queensland by Commodity and Status
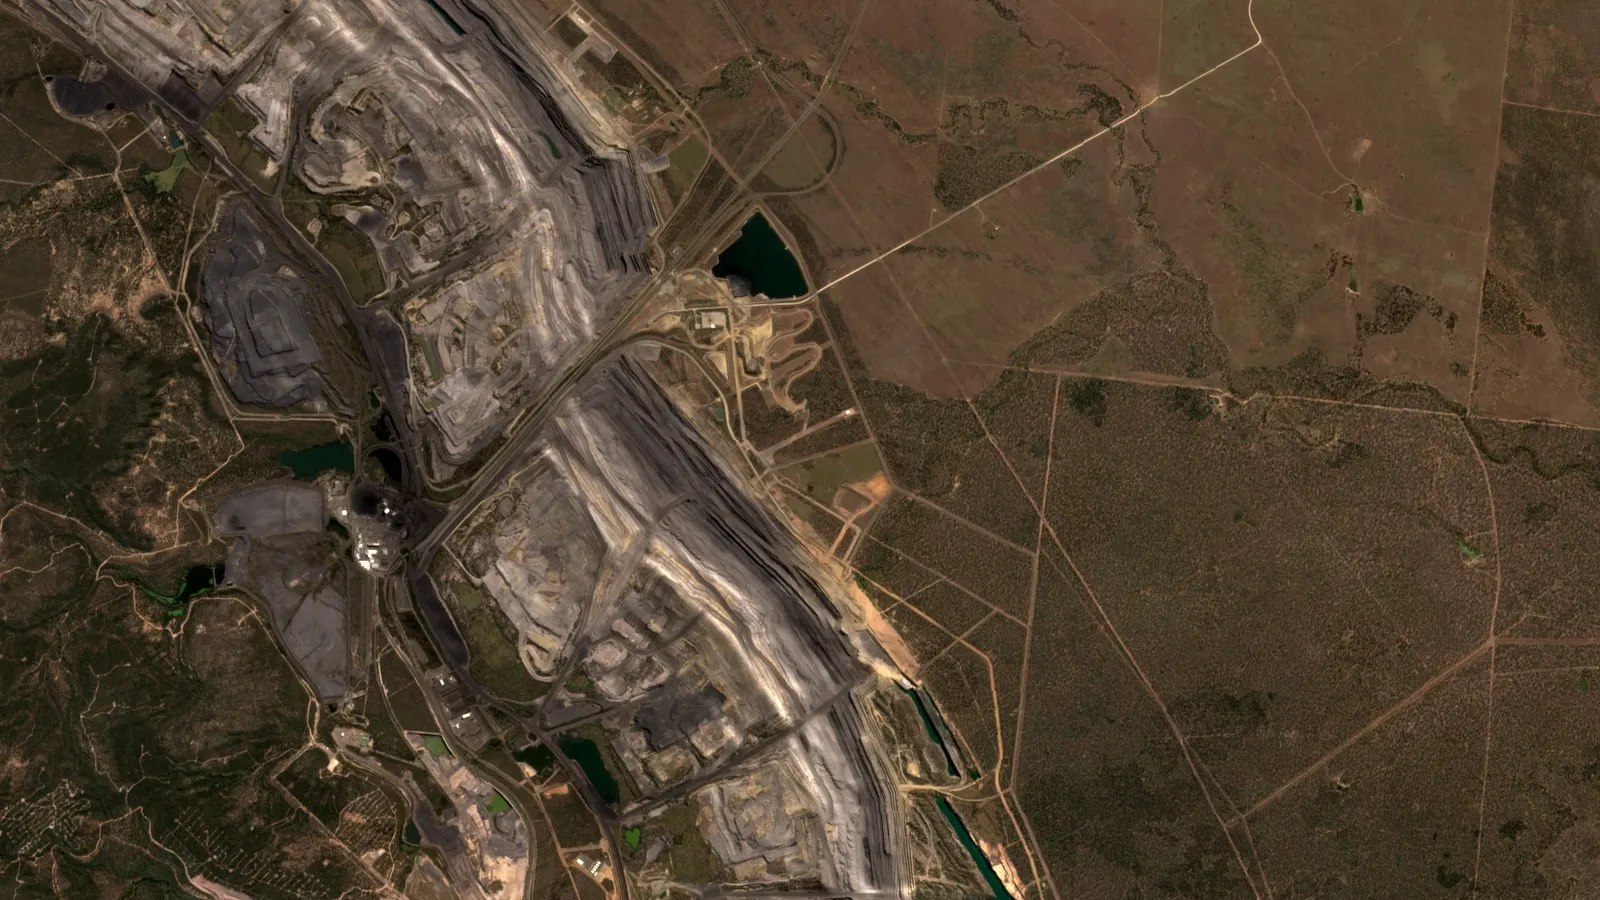
Geoscience Australia lists 108 mines in Queensland as at December 2024: 80 operating, 7 developing and 21 on care and maintenance. Coal is 54 of the 80 operating mines. Below: the full list, coal operators from 2026 filings, royalty bands and a royalty calculator.
Key takeaways
- Geoscience Australia’s Operating Mines Map 2024 lists 108 Queensland mines at December 2024: 80 operating, 7 developing, 21 on care and maintenance.
- Queensland produced 227.8 Mt of saleable coal in calendar 2025, about 60% coking or PCI coal (Queensland Government annual coal statistics).
- BMA produced 37.3 Mt (100% basis) in the year to June 2026 (BHP); Whitehaven’s Queensland mines produced 20.1 Mt run-of-mine in the same year.
- Ownership is shifting: Anglo American agreed in May 2026 to sell its Queensland steelmaking coal mines to Dhilmar, and Yancoal agreed in April 2026 to buy 80% of Kestrel and completed the purchase on 1 October 2026.
- Coal royalty uses price bands, from 7% on the first A$100 a tonne to 40% on any part above A$300 (Queensland Revenue Office); at A$250 a tonne it is A$34.50 a tonne by our calculation.
In this article
- How we built this list
- How many mines are there in Queensland?
- Where Queensland's coal comes from
- List of coal mines in Queensland
- Who runs the larger coal mines
- Gold mines in Queensland
- Copper, zinc, lead and silver mines in north-west Queensland
- Bauxite, magnesite, phosphate and silica mines
- List of non-coal mines in Queensland
- Queensland mining royalties by mineral
- Native title and land agreements for Queensland mines
- Rehabilitation and environmental rules for Queensland mines
- How to check tenure and map a Queensland site
- Frequently asked questions
The Australian Operating Mines Map from Geoscience Australia lists 108 mines in Queensland as at December 2024: 80 operating, 7 under development and 21 on care and maintenance. Coal makes up 54 of the 80 operating mines. This page gives the full list by commodity with the survey’s coordinates, then covers who runs the larger coal mines, the metal and bauxite mines, the royalty rules, and the native title and rehabilitation steps that apply to any new project.
Mine ownership moves quickly, so treat the list as a starting point. Since the map was compiled, Anglo American has agreed to sell its Queensland steelmaking coal mines to Dhilmar, Yancoal completed its purchase of 80% of the Kestrel coal mine on 1 October 2026, and Evolution scheduled the last Mt Rawdon stockpile processing for the September 2026 quarter. Each change is covered below with the filing behind it. For gold in more depth, see our page on gold deposits in Queensland.
How we built this list
The names, commodity groups, status and coordinates come from the dataset behind the Geoscience Australia map (data as at December 2024; map created February 2025). We kept every entry that the dataset assigns to Queensland. Three rules apply to the tables below.
- Status is as at December 2024. The map defines an operating mine as a project in production at that date, a developing mine as one with a positive feasibility study, development under way or all approvals received, and a care-and-maintenance mine as one with known resources where production has stopped but the site is kept safe and could restart.
- One row can cover a complex. The survey lists some sites as single points, so counts differ from lists that split a complex into pits or longwalls (a longwall is an underground method that shears coal along a long face).
- Owners and output come from filings, not from the survey. Where we name an operator or a tonnage, it comes from a 2025 or 2026 company report or regulator page that we opened, and the section says which.
The survey spells one coal mine “Broadmedow East”; we show the usual spelling, Broadmeadow East. Coordinates are decimal degrees to two places, enough to find a mine on a map but not a lease boundary.
How many mines are there in Queensland?
Coal is the largest group by a wide margin. Of the 80 operating mines, 54 produce coal, 7 produce zinc and lead, 5 gold and silver, 4 copper-led base metals and 4 bauxite. The table gives every group and status.
| Commodity group (GA) | Operating | Developing | Idle (care and maintenance) | Total |
|---|---|---|---|---|
| Coal | 54 | 0 | 3 | 57 |
| Gold and silver | 5 | 0 | 2 | 7 |
| Copper-led base metals | 4 | 1 | 9 | 14 |
| Zinc and lead | 7 | 0 | 4 | 11 |
| Bauxite | 4 | 1 | 0 | 5 |
| Phosphate | 2 | 0 | 0 | 2 |
| Magnesite | 2 | 0 | 0 | 2 |
| Silica and aluminium-silicon | 1 | 2 | 1 | 4 |
| Tin and tungsten | 1 | 0 | 1 | 2 |
| Vanadium | 0 | 2 | 0 | 2 |
| Nickel and cobalt | 0 | 1 | 0 | 1 |
| Iron ore | 0 | 0 | 1 | 1 |
| Queensland total | 80 | 7 | 21 | 108 |
Care-and-maintenance mines are concentrated in metals: 9 of the 21 are copper-led base metals and 4 are zinc and lead, while only 3 are coal. Those idle mines matter to anyone watching restarts, because they already have known resources and, in many cases, a lease and infrastructure.
Chart
Operating mines in Queensland by commodity group
Number of mines listed as operating at December 2024
Where Queensland’s coal comes from
Queensland’s coal is black coal, which covers two products. Metallurgical (steelmaking) coal is used in blast furnaces, and pulverised coal injection (PCI) coal is a lower-cost fuel that is injected alongside it. Thermal coal is burned for power. Geoscience Australia’s table of economic demonstrated resources (EDR, the part of a resource that is economic to mine under current conditions), with figures at the end of 2022, puts the Bowen Basin at 27,775 Mt, the Galilee Basin at 11,282 Mt and the Surat Basin at 8,145 Mt. By our count from the survey coordinates, 48 of the 54 operating coal entries lie in central Queensland between about 20.4 and 25 degrees south and east of 146.5 degrees east. That box covers most of the Bowen Basin but also takes in the separate Callide Basin mines (Callide and Boundary Hill); the other six are Carmichael to the west and Cameby Downs, Commodore, Kogan Creek, New Acland and Tarong in the south. See our page on Bowen Basin mining for the district.
Chart
Black coal economic demonstrated resources, Queensland basins
Million tonnes (Mt), end of 2022; Clarence-Moreton also extends into New South Wales
Output has been steady for five years. Queensland Government data show saleable coal (coal after washing, ready to sell) of 227.8 Mt in calendar 2025: 98.7 Mt coking, 37.4 Mt PCI and 91.7 Mt thermal, so about 60% of the total was coking or PCI coal. The series peaked at 249.0 Mt in 2018 and has been between 221 Mt and 228 Mt since 2020. The state dataset is the Annual coal statistics release from the Department of Natural Resources and Mines, Manufacturing and Regional and Rural Development.
Chart
Queensland saleable coal production by calendar year
Million tonnes (Mt); coking includes PCI

▶ Explains strip (open-cut) mining of coal in plain words, with a US coal example; several Queensland mines listed here, such as Moranbah North, Grosvenor and Kestrel, are underground. · 4:37
List of coal mines in Queensland
The table lists every coal entry the survey gives for Queensland: 54 operating and 3 on care and maintenance. Use it as a gazetteer. The next section covers who runs the larger mines, and a few statuses have already moved.
| Coal mine | Status (GA, December 2024; idle means care and maintenance) | Latitude | Longitude |
|---|---|---|---|
| Aquilla-Capcoal | Operating | -22.90 | 148.55 |
| Baralaba North | Operating | -24.16 | 149.80 |
| Blackwater | Operating | -23.69 | 148.81 |
| Blair Athol | Operating | -22.69 | 147.53 |
| Bluff | Idle | -23.52 | 149.06 |
| Boundary Hill | Operating | -24.20 | 150.49 |
| Broadlea | Operating | -21.93 | 148.18 |
| Broadmeadow East | Operating | -21.81 | 148.15 |
| Burton Complex | Operating | -21.59 | 148.17 |
| Byerwen | Operating | -21.35 | 147.81 |
| Callide | Operating | -24.31 | 150.62 |
| Cameby Downs | Operating | -26.58 | 150.29 |
| Carborough Downs | Operating | -21.95 | 148.21 |
| Carmichael | Operating | -22.02 | 146.32 |
| Caval Ridge | Operating | -22.22 | 148.17 |
| Centurion | Operating | -21.65 | 147.98 |
| Clermont | Operating | -22.69 | 147.63 |
| Collinsville | Operating | -20.57 | 147.77 |
| Commodore | Operating | -27.93 | 151.28 |
| Cook | Operating | -23.71 | 148.91 |
| Coppabella | Operating | -21.84 | 148.43 |
| Curragh | Operating | -23.47 | 148.85 |
| Daunia | Operating | -22.04 | 148.29 |
| Dawson | Operating | -24.62 | 150.06 |
| Drake | Operating | -20.71 | 147.82 |
| Ensham | Operating | -23.45 | 148.50 |
| Foxleigh | Operating | -23.00 | 148.80 |
| Goonyella | Operating | -21.79 | 147.96 |
| Gregory Crinum | Operating | -23.17 | 148.36 |
| Grosvenor | Operating | -21.87 | 147.99 |
| Hail Creek | Operating | -21.51 | 148.41 |
| Ironbark No 1 | Operating | -21.74 | 148.17 |
| Isaac Plains Complex | Operating | -21.96 | 148.11 |
| Jax | Operating | -20.72 | 147.87 |
| Jellinbah East | Operating | -23.41 | 148.95 |
| Kestrel | Operating | -23.24 | 148.37 |
| Kogan Creek | Operating | -26.90 | 150.77 |
| Lake Vermont | Operating | -22.40 | 148.44 |
| Middlemount | Operating | -22.85 | 148.63 |
| Millennium | Idle | -22.02 | 148.21 |
| Moorvale | Operating | -22.00 | 148.35 |
| Moranbah North | Operating | -21.87 | 147.96 |
| New Acland | Operating | -27.27 | 151.71 |
| Newlands | Idle | -21.25 | 147.90 |
| Oaky Creek | Operating | -23.04 | 148.49 |
| Olive Downs | Operating | -22.21 | 148.37 |
| Orion Downs | Operating | -24.43 | 148.36 |
| Peak Downs | Operating | -22.22 | 148.17 |
| Poitrel | Operating | -22.04 | 148.23 |
| Rolleston | Operating | -24.44 | 148.41 |
| Saraji | Operating | -22.37 | 148.29 |
| Sonoma | Operating | -20.62 | 147.86 |
| South Walker Creek | Operating | -21.77 | 148.44 |
| Tarong | Operating | -26.81 | 151.91 |
| Vulcan | Operating | -22.29 | 148.19 |
| Wilton-Fairhill | Operating | -23.32 | 148.55 |
| Yarrabee | Operating | -23.32 | 149.03 |
Two statuses need a note. The survey lists Newlands as care and maintenance, but Glencore says the last coal was mined there in February 2023 and the site is now in closure and rehabilitation. Millennium is also on care and maintenance in the survey, and Stanmore’s annual report says the Millennium Mine entered care and maintenance in 2024.
Who runs the larger coal mines
The table below covers the operators that report Queensland coal in their own filings. It does not list every operator, and the figures are on different bases and dates, so do not add them up. The basis is stated in each row.
| Operator | Queensland mines named in the filing | Latest filed figure and what changed |
|---|---|---|
| BMA (BHP holds 50%) | Goonyella, Peak Downs, Saraji, Caval Ridge | 37.3 Mt saleable (100% basis) in the year to 30 June 2026; BHP’s share was 18.6 Mt. Guidance for the next year is 37 to 41 Mt (100% basis). |
| Whitehaven Coal | Blackwater (70%), Daunia (100%) | 20.1 Mt managed run-of-mine (ROM) from Queensland in the year to 30 June 2026: 13.9 Mt at Blackwater and 6.2 Mt at Daunia. Whitehaven completed the 30% sell-down of Blackwater on 31 March 2025. |
| Glencore | Not itemised here | Glencore reports Australian coal by country, not by mine. It reports Australian steelmaking coal, 7.3 Mt in 2025, by country rather than by mine. |
| Anglo American (sale agreed) | Moranbah North, Grosvenor, Capcoal, Dawson and related joint ventures | Agreed on 18 May 2026 to sell its Australian steelmaking coal portfolio to Dhilmar for up to US$3.875 billion (US$2.3 billion upfront plus an earnout, meaning extra payments if coal prices or output pass set levels, of up to US$1.575 billion). Completion is expected by the first quarter of 2027. |
| Peabody | Centurion, Coppabella-Moorvale joint venture | Targeting 1.5 to 2.0 million tons of Centurion sales in the second half of 2026 after longwall commissioning. Peabody reports in US short tons. |
| Stanmore Resources | South Walker Creek, Poitrel, Isaac Plains Complex | 14.0 Mt saleable coal in calendar 2025. Output at Isaac Plains is expected to fall in 2026. |
| New Hope | New Acland | 3.3 Mt saleable coal in the year to 31 July 2026, with 6.9 Mt ROM. The mine is in its Stage 3 ramp-up and is developing access to the Manning Vale West pit. |
| Yancoal | Yarrabee, Middlemount (about 50%), Kestrel (80%, bought 1 October 2026) | 1.1 Mt saleable coal from Yarrabee in the first half of 2026 (100% basis). Yancoal agreed on 14 April 2026 to buy an 80% interest in Kestrel, an underground mine that produced 5.9 Mt in 2025 (100% basis); Yancoal completed the purchase on 1 October 2026 for US$1.85 billion upfront, with up to US$550 million more if coal prices pass set levels. |
Anglo American’s sale covers Moranbah North and its neighbours. Anglo says it is still pursuing arbitration with Peabody over the earlier sale agreement from November 2024, so ownership will not settle until the Dhilmar deal completes. The BMA chart below uses the mine-level table in BHP’s report, which gives BHP’s 50% share of each mine; the four mines add up to BHP’s 18.6 Mt.
Chart
BMA saleable coal by mine, BHP’s 50% share
Million tonnes (Mt), years to 30 June
Gold mines in Queensland
The survey lists 7 gold and silver mines in Queensland: Agate Creek, Cracow, Mount Rawdon, Pajingo and Ravenswood as operating, and Charters Towers and Lorena on care and maintenance. Two facts have moved since the map. Ravenswood is jointly owned by EMR Capital and Golden Energy and Resources, with EMR as operator, and Triple Flag says annual output is expected to pass 200,000 ounces (200 koz) by 2028, after 134 koz in 2025. Triple Flag announced a US$440 million gold stream on the mine on 12 June 2026. A gold stream is a deal in which a buyer pays upfront for a share of future gold output.
At Mt Rawdon, Evolution Mining calls FY26 the final full year of operation, with the last low-grade stockpiles due to be processed in the September 2026 quarter; the Queensland Government has also said the Mt Rawdon pumped hydro project will not be prioritised. Field names, deposit types and companies for the state’s gold districts are on our Queensland gold deposits page. For a comparison with a mine in another state, see our page on St Ives in Western Australia.
Copper, zinc, lead and silver mines in north-west Queensland
The survey lists 7 operating zinc-lead mines (Cannington, Century, Dugald River, Eloise, George Fisher, Lady Loretta and Mount Isa; the survey groups Eloise with zinc and lead, although it is a copper-gold mine near Cloncurry) and 4 operating copper-led mines (Anthill, Ernest Henry, Mount Colin and Rocklands). Most sit around Mount Isa and Cloncurry in the north-west. Three developments from company filings show how fast the picture changes.
- Mount Isa copper. Glencore says copper from the Mount Isa complex fell because of the closure of the MICO mine in mid-2025. On 8 October 2025 it announced a Heads of Agreement with the Australian and Queensland governments on a support package of up to A$600 million to keep the Mount Isa copper smelter and Townsville refinery running for three years. Glencore also lists A$2.5 billion of planned or proposed investment in the region over six years, including George Fisher and the Black Star Open Cut.
- Ernest Henry. Evolution guides Ernest Henry at 40 to 43 kt of copper and 50 to 60 koz of gold for FY27 after heavy rain interrupted underground work in the December 2025 and March 2026 quarters. It has approved the Bert project, with first production planned for FY29, and has announced a plan to buy Carnaby Resources for about A$213 million in shares, subject to a shareholder vote expected from late October 2026.
- Cannington. South32 reports 8,906 koz of payable silver in FY26, against 10,292 koz in FY25 (payable means the metal paid for after smelter deductions). An ore reserve of 11 Mt supports about seven years of life to FY33. Our page on silver mines in Australia puts Cannington in context.
Bauxite, magnesite, phosphate and silica mines
Most of Queensland’s bauxite mining is on Cape York Peninsula (the survey’s Binjour project, near Gayndah, is the exception); Geoscience Australia notes that most of Australia’s bauxite economic resources are in Queensland and Western Australia. The survey lists Amrun, Andoom, Bauxite Hills and East Weipa as operating and Binjour as developing. Rio Tinto reports that its Weipa mine produced 39,464 kt of bauxite in 2025, up from 37,078 kt in 2024. Our page on bauxite production cost per tonne covers what that tonnage costs to produce.
The same survey lists two operating phosphate mines (Ardmore and Duchess), two magnesite mines (Kunwarara and Yaamba), Cape Flattery (in the survey’s silica and aluminium-silicon group), and the Mount Carbine tin and tungsten mine. The full non-coal list follows with coordinates.
List of non-coal mines in Queensland
Fifty-one entries, grouped by commodity. Statuses are those in the survey at December 2024; the sections above note the ones that have moved.
| Mine | Commodity group | Status (GA, December 2024; idle means care and maintenance) | Latitude | Longitude |
|---|---|---|---|---|
| Agate Creek | Gold and silver | Operating | -18.99 | 143.55 |
| Charters Towers | Gold and silver | Idle | -20.08 | 146.27 |
| Cracow | Gold and silver | Operating | -25.29 | 150.27 |
| Lorena | Gold and silver | Idle | -20.72 | 140.65 |
| Mount Rawdon | Gold and silver | Operating | -25.27 | 151.76 |
| Pajingo | Gold and silver | Operating | -20.55 | 146.46 |
| Ravenswood | Gold and silver | Operating | -20.10 | 146.88 |
| Anthill | Copper-led base metals | Operating | -20.25 | 139.12 |
| Balcooma | Copper-led base metals | Idle | -18.77 | 144.71 |
| Barbara | Copper-led base metals | Idle | -20.42 | 139.85 |
| Capricorn Copper | Copper-led base metals | Idle | -19.69 | 139.36 |
| Ernest Henry | Copper-led base metals | Operating | -20.44 | 140.70 |
| Great Australia Complex | Copper-led base metals | Idle | -20.72 | 140.51 |
| Jericho | Copper-led base metals | Developing | -20.98 | 140.99 |
| Lady Annie | Copper-led base metals | Idle | -19.77 | 139.04 |
| Mount Carlton | Copper-led base metals | Idle | -20.27 | 147.56 |
| Mount Colin | Copper-led base metals | Operating | -20.78 | 140.04 |
| Osborne | Copper-led base metals | Idle | -22.09 | 140.57 |
| Rocklands | Copper-led base metals | Operating | -20.68 | 140.36 |
| Texas | Copper-led base metals | Idle | -28.83 | 151.29 |
| Wallace North | Copper-led base metals | Idle | -20.84 | 140.75 |
| Cannington | Zinc and lead | Operating | -21.87 | 140.92 |
| Century | Zinc and lead | Operating | -18.74 | 138.63 |
| Dugald River | Zinc and lead | Operating | -20.25 | 140.16 |
| Eloise | Zinc and lead | Operating | -20.95 | 140.98 |
| George Fisher | Zinc and lead | Operating | -20.57 | 139.47 |
| King Vol | Zinc and lead | Idle | -16.94 | 144.25 |
| Lady Loretta | Zinc and lead | Operating | -19.77 | 139.07 |
| Merlin | Zinc and lead | Idle | -21.65 | 140.49 |
| Mount Garnet | Zinc and lead | Idle | -17.68 | 145.11 |
| Mount Isa | Zinc and lead | Operating | -20.74 | 139.48 |
| Mungana | Zinc and lead | Idle | -17.10 | 144.38 |
| Amrun | Bauxite | Operating | -12.97 | 141.63 |
| Andoom | Bauxite | Operating | -12.54 | 141.83 |
| Bauxite Hills | Bauxite | Operating | -11.83 | 142.04 |
| Binjour | Bauxite | Developing | -25.50 | 151.50 |
| East Weipa | Bauxite | Operating | -12.66 | 141.87 |
| Ardmore | Phosphate | Operating | -21.65 | 139.17 |
| Duchess | Phosphate | Operating | -21.87 | 139.97 |
| Kunwarara | Magnesite | Operating | -22.88 | 150.19 |
| Yaamba | Magnesite | Operating | -23.08 | 150.30 |
| Cape Flattery | Silica and aluminium-silicon | Operating | -14.98 | 145.27 |
| Cape Flattery | Silica and aluminium-silicon | Developing | -14.96 | 145.33 |
| Lighthouse | Silica and aluminium-silicon | Idle | -18.39 | 144.17 |
| Mourilyan | Silica and aluminium-silicon | Developing | -17.73 | 146.08 |
| Mount Carbine | Tin and tungsten | Operating | -16.52 | 145.13 |
| Wolfram Camp | Tin and tungsten | Idle | -17.08 | 144.97 |
| Richmond | Vanadium | Developing | -20.45 | 142.79 |
| Saint Elmo | Vanadium | Developing | -20.55 | 141.88 |
| Sconi | Nickel and cobalt | Developing | -19.03 | 144.95 |
| Mount Moss | Iron ore | Idle | -19.09 | 145.85 |
Queensland mining royalties by mineral
Royalty is set by the Mineral Resources (Royalty) Regulation 2025 and published by the Queensland Revenue Office. Rates are in Australian dollars. For coal, the rate rises in bands with the average price per tonne, and each band applies only to the slice of the price that falls inside it.
Chart
Coal royalty rate by slice of the price per tonne
Per cent; each rate applies only to the slice of the average price inside that band
| Slice of the average coal price per tonne | Royalty rate on that slice |
|---|---|
| Over A$0 to A$100 | 7% |
| Over A$100 to A$150 | 12.5% |
| Over A$150 to A$175 | 15% |
| Over A$175 to A$225 | 20% |
| Over A$225 to A$300 | 30% |
| Over A$300 | 40% |
At an average price of A$150 a tonne the royalty is A$13.25 a tonne, or 8.8% of the price; at A$250 it is A$34.50 a tonne, or 13.8%. Those are our calculations from the published bands. The rate is worked out separately for coal sold or used inside Queensland and coal sold outside it, on the value after permitted deductions.
| Mineral | Rate (Queensland Revenue Office) |
|---|---|
| Copper, gold, silver, lead, zinc, cobalt, nickel | Variable rate of 2.50% to 5.00% of value, set by average metal prices; a threshold below which no royalty is payable applies; a processing discount applies except for gold and silver |
| Bauxite (mined for use outside Queensland) | The higher of 10% of value or A$2.00 a tonne |
| Iron ore | A$1.25 a tonne if the average price is A$100 or less; above that, 1.25% on the first A$100 and 2.5% on the balance |
| Minerals with no listed rate | 2.5% of value; the no-royalty threshold applies |
Royalty is one cost among several, and the rules change, so confirm the current regulation before you model a project.
Calculator
How much coal royalty would a Queensland mine pay?
Enter your own tonnes, average price and cash cost per tonne.
- Total royalty (A$ million): 110.0 A$m
- Effective royalty rate: 11.0 %
- Margin per tonne after cost and royalty: 78.00 A$/t
Example values only, not a forecast or any company’s figures. Price is an input: example, use today’s price in A$ per tonne. The bands are the Queensland Revenue Office coal rates (Mineral Resources (Royalty) Regulation 2025). The calculator treats your price as the value per tonne after permitted deductions and ignores the split between domestic and export coal, tax and other costs.
Native title and land agreements for Queensland mines
Native title, the rights of Aboriginal and Torres Strait Islander people under Australian law, is part of how Queensland grants mining interests. The Queensland Government told the Australian Law Reform Commission that, as at February 2025, there were 198 positive native title determinations in Queensland covering 39.7% of the state, including 4.5% with exclusive native title. A further 7.6% of the state was subject to 44 claims.
The same submission calls the right to negotiate, a statutory process between a proponent and native title parties, a key step in validly granting mining interests in Queensland. It says the state issued 4,497 notices under section 29 of the Native Title Act in the previous ten years, plus 2,642 that included an expedited procedure statement. It also says that negotiating an Indigenous land use agreement (ILUA), a voluntary registered agreement between native title holders and others, can be slow and costly for both native title parties and proponents. A mine’s approvals can therefore depend on agreements as well as on geology.
Seek advice from a native title lawyer early. This page does not give legal advice, and individual mining leases differ.
Rehabilitation and environmental rules for Queensland mines
Requirements for a progressive rehabilitation and closure plan (PRC plan) for resource activities took effect from 1 November 2019, and the holder of a mine’s environmental authority must prepare one. The plan includes a final site design map showing planned post-mining land uses and any areas that will be managed rather than used, and a schedule of milestones. The regulator then checks whether those rehabilitation milestones have been met. Progressive rehabilitation means land is restored while mining continues, not only after closure.
Emissions are regulated separately. Stanmore’s annual report notes that its Isaac Plains Complex, Poitrel and South Walker Creek mines are covered by the national Safeguard Mechanism, which the Clean Energy Regulator administers and which requires a progressive cut in greenhouse gas emissions. We make no claims here about pollution or health effects at particular mines, because we could not verify figures for them; the regulator’s compliance records are the place to look.

▶ Explains seven environmental impacts of mining in clay animation, with satellite maps and sourced facts. · 2:31
How to check tenure and map a Queensland site
Business Queensland lists the public tools for mining and exploration data. GeoResGlobe lets users view, query, download and print mining and resources spatial data, Queensland Globe shows mines information, QSpatial offers downloadable geoscience layers (search under the Geoscientific Information category), and the GSQ Open Data Portal hosts the Queensland Mining and Exploration Map Collection. Our guide to mining cadastre portals by country compares how tenure searches work elsewhere.
Before any fieldwork, confirm who holds the tenure and who owns the land, and get permission from both. Never enter a lease or exploration permit area without it, and never use mercury to recover gold.
Consultants who need a first look at an area before committing to drilling can use satellite imagery. Farmonaut’s satellite-based mineral detection screens a licence area for mineral signatures and returns exploration targets, which sit ahead of a resource estimate and are not one. To scope a site, use the mining query form or contact the team.

▶ Explains how satellites map the rock and alteration around mineral deposits rather than the metal itself. · 4:25
We cover a connected topic in Iron Knob Australia: Mine History and Current Status.
For a closer look at a related question, see our guide: Hunter Valley Coal Mines Map and Mine List.
Frequently asked questions
How many mines are there in Queensland?
Geoscience Australia’s map lists 108 mines in Queensland as at December 2024: 80 operating, 7 under development and 21 on care and maintenance. Counts from other lists differ because a complex may be split into several mines.
How many coal mines are in Queensland?
The same survey lists 57 coal mines: 54 operating and 3 on care and maintenance (Bluff, Millennium and Newlands). Glencore says the last coal was mined at Newlands in February 2023 and the site is now being rehabilitated.
Where are the coal fields in Queensland?
Geoscience Australia’s resource table names the Bowen Basin, Galilee Basin and Surat Basin as the largest, with smaller resources in the Clarence-Moreton, Tarong and Callide basins. By our count, 48 of the 54 operating coal entries in the survey sit in central Queensland, mostly in the Bowen Basin.
How much coal does Queensland produce?
Queensland Government data show 227.8 Mt of saleable coal in calendar 2025: 98.7 Mt coking, 37.4 Mt PCI and 91.7 Mt thermal.
Which mines in Queensland produce gold?
The survey lists Agate Creek, Cracow, Mount Rawdon, Pajingo and Ravenswood as operating gold and silver mines at December 2024. Evolution scheduled the last Mt Rawdon stockpile processing for the September 2026 quarter, so check whether the mine has now stopped. See our page on gold deposits in Queensland for fields and companies.
Where is copper mined in Queensland?
Ernest Henry, Mount Colin, Anthill and Rocklands are the copper-led mines the survey lists as operating, all in the north-west around Cloncurry and Mount Isa. Glencore’s MICO copper mine at Mount Isa closed in mid-2025, and the Mount Isa smelter is covered by a three-year support package agreed in principle with the governments.
Where is bauxite mined in Queensland?
On Cape York Peninsula, around Weipa and further north. The survey lists Amrun, Andoom, Bauxite Hills and East Weipa as operating. Rio Tinto reported 39,464 kt from its Weipa mine in 2025.
What is the coal royalty in Queensland?
It is tiered by average price per tonne, from 7% on the first A$100 up to 40% on any slice above A$300. The calculator above applies the bands to your own price and tonnage.
Who owns Moranbah North and the other Anglo American coal mines?
Anglo American agreed on 18 May 2026 to sell its Australian steelmaking coal portfolio to Dhilmar, with completion expected by the first quarter of 2027. Until then Anglo American remains the owner.
Does a Queensland mining lease need native title agreements?
Native title has to be dealt with before a mining interest is granted. Queensland told the Australian Law Reform Commission that the right to negotiate is a key process for validly granting mining interests; an ILUA is another route. The steps depend on the land and tenure. Get advice from a native title lawyer for your own lease.
How do I find who holds a mining tenure in Queensland?
Use GeoResGlobe, Queensland Globe or QSpatial, which Business Queensland lists for mining and resources data, then confirm details with the Department. This is not legal advice.
This page is for information only. It is not investment advice or legal advice. Confirm tenure, royalty, native title and environmental rules with the regulator and a qualified adviser. Do not enter a mining lease or exploration permit area without permission from the holder and the landholder.
Farmonaut mining
Map your mining site from space
Mining consultants can screen a Queensland licence area from satellite imagery for exploration targets before drilling.

Mining Pro sample view, synthetic data
Keep reading
Sources
- Geoscience Australia, Australian Operating Mines Map 2024 (dataset, February 2025): data.gov.au
- Geoscience Australia, Australia’s Energy Commodity Resources 2024: Coal: ga.gov.au
- Geoscience Australia, Australia’s Identified Mineral Resources 2024: ga.gov.au
- Queensland Government, Annual coal statistics (data.qld.gov.au): data.qld.gov.au
- publicdata.au, Queensland saleable coal production by year (copy of the Queensland Government dataset, CC BY 4.0): publicdata.au
- Queensland Revenue Office, Mineral royalty rates: qro.qld.gov.au
- BHP, Operational review for the year ended 30 June 2026 (ASX, 16 July 2026): announcements.asx.com.au
- Whitehaven Coal, June 2026 quarterly production report (ASX, 28 July 2026): announcements.asx.com.au
- Anglo American, agreement to sell steelmaking coal business (18 May 2026): angloamerican.com
- Yancoal Australia, acquisition of 80% interest in Kestrel Coal Mine (14 April 2026): www1.hkexnews.hk
- Yancoal Australia, Half-Year Financial Report to 30 June 2026 (ASX): announcements.asx.com.au
- New Hope Group, 2026 full year results (ASX, 15 September 2026): announcements.asx.com.au
- Stanmore Resources, 2025 full year results and financial report (ASX, 23 February 2026): announcements.asx.com.au
- Peabody, results for the quarter ended June 30, 2026 (29 July 2026): peabodyenergy.com
- South32, Annual Report 2026 (ASX, 27 August 2026): announcements.asx.com.au
- Evolution Mining, FY26 full year financial results (ASX, 19 August 2026): announcements.asx.com.au
- Glencore, Mount Isa copper smelter and Townsville copper refinery agreement (8 October 2025): glencore.com.au
- Glencore, Full Year 2025 Production Report: glencore.com
- Rio Tinto, fourth quarter 2025 production results (ASX, 21 January 2026): announcements.asx.com.au
- Triple Flag, US$440 million gold stream on the Ravenswood Gold Mine (12 June 2026): bnnbloomberg.ca
- State of Queensland, submission to the Australian Law Reform Commission review of the future acts regime: alrc.gov.au
- Business Queensland, Progressive rehabilitation and closure plan for mined land: business.qld.gov.au
- Business Queensland, Mining and resources maps and spatial data: business.qld.gov.au
- Yancoal Australia, completion of acquisition of 80% interest in Kestrel (ASX, 1 October 2026): announcements.asx.com.au
- Glencore, Back to the bottle tree: Newlands comes full circle (24 September 2026): glencore.com
Discussion
Questions, corrections or field experience? Share them below. First-time comments are reviewed before they appear, and your email is never published.
No comments yet. Be the first to add a question or your experience.

 Timestream Mining
 Lithspo Minerals Limited
 Tintina Mining Group
 Dalgety Minerals Pty Ltd
 Vortex Minerals Pty Ltd
 Faith At Work (Pty) Ltd
 Geotech Mining Solutions plc
 Vulcan International Limited
 Kidepo Associates
 GKY Mining
 Alkimy SARL
 Double A Trading
 GemSprout Metals Limited
 Qader Group
 Ileys General Trading
 SG Gold Mining LLC
 VRV Global Pte Ltd
 Omsri International FZE
 G.I.T.T.
 Jaunita Erss Ltd
 Almosi SARL
 SRK Consulting
 Berks Gold Limited
 Mwerezi Minerals Company Limited

 Exploration consultancy · South Africa · Gold










