

Illegal mining · Satellite monitoring guide
Illegal Mining Monitoring by Satellite: How It Works
Satellites find illegal mining by comparing images over time for new pits, bare ground and silted rivers, then testing each site against licence maps. Amazon Mining Watch reports 99% specificity and 90% sensitivity (Earth Genome, 2026).
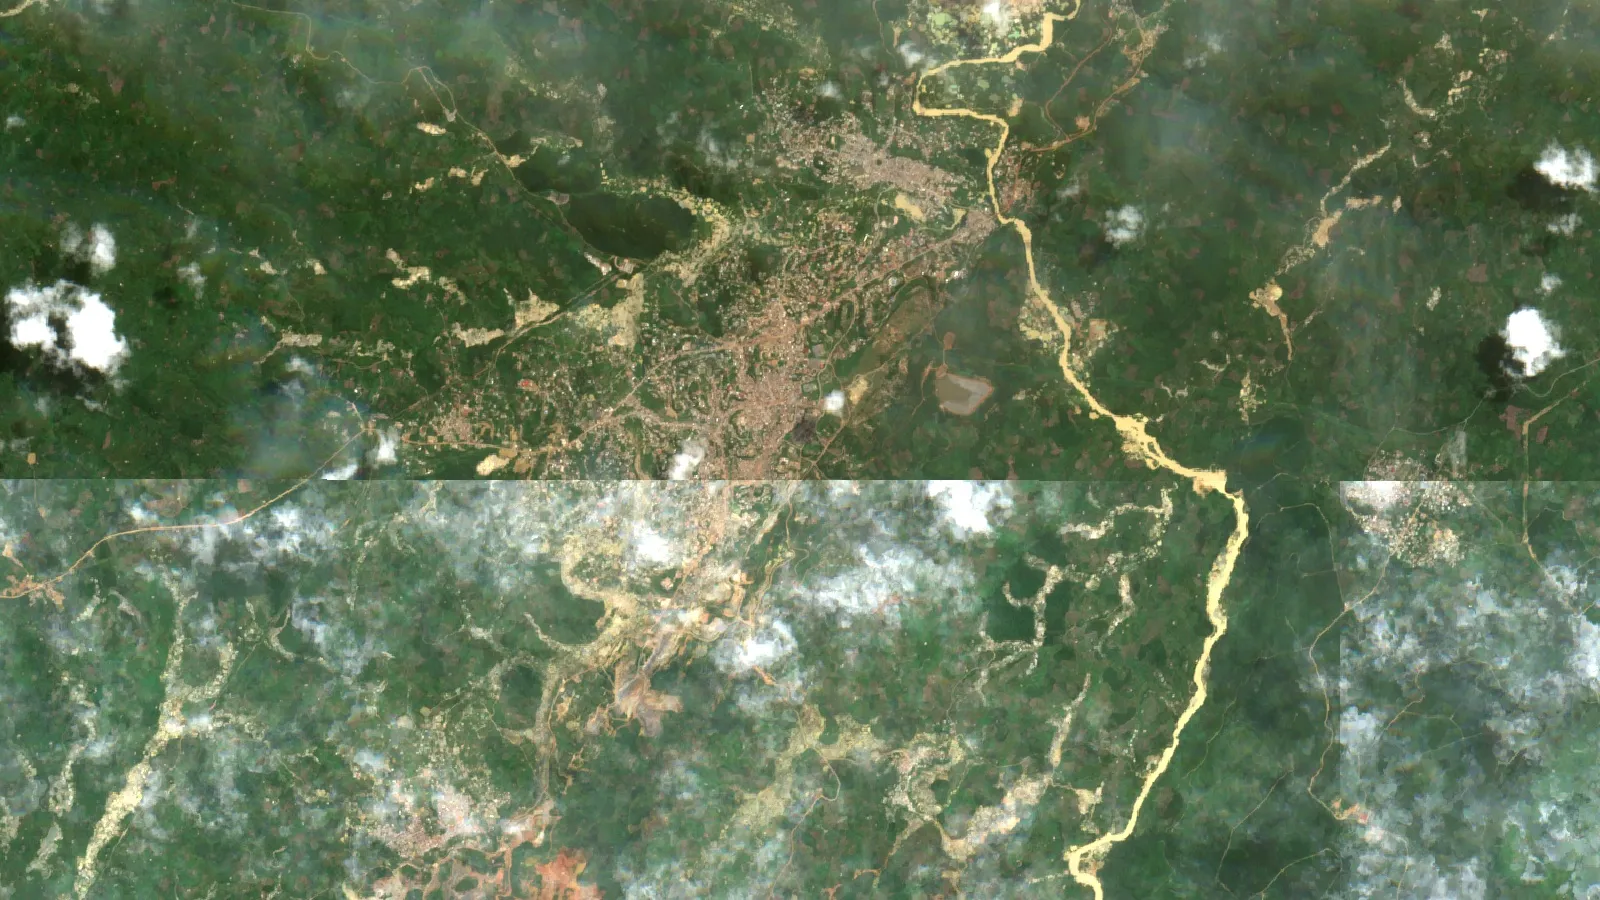
Key takeaways
- A satellite shows digging, not legality: detections are checked against licence, concession and protected-area maps (MAAP, November 2025).
- Amazon Mining Watch confirmed 37,109 ha of new gold-mining area across nine Amazon countries in 2025 up to September (MAAP #235).
- In south-western Ghana, artisanal mines caused 85.7% of mining-related vegetation loss from 2005 to 2019 (NASA Earth Observatory, 2021).
- Sentinel-2 revisits every 5 days at 10 m; radar passes through cloud; Landsat 8 and 9 return every 8 days at 30 m (ESA, NASA).
- Zambia’s Geological Survey Department has relied on desk reviews and satellite imagery for artisanal and small-scale mining (ASM) compliance because field visits were underfunded (Zambia EITI, 2019).
In this article
- What satellites can and cannot show
- What mining scars look like from space
- Optical, radar and alert systems: which satellite does which job
- How change detection finds new mining, step by step
- How to tell whether mining is unlicensed: the cadastre overlay
- Illegal mining monitoring in the Amazon: what satellites found
- Galamsey in Ghana: what satellite studies measured
- Illegal mining in Zambia: what the record and satellite data show
- Nigeria: Mining Marshals and satellite plans
- False alarms and how monitoring teams filter them
- What a licence holder can do about encroachment
- Frequently asked questions
Illegal mining monitoring by satellite works by comparing images of the same ground over time. New bare soil, pits, muddy ponds and silted rivers show where digging began, and a licence map shows whether anyone had the right to dig there. Amazon Mining Watch applies this method across nine countries with Sentinel-2 images and a neural network that reports 99% specificity and 90% sensitivity at its working thresholds (Earth Genome, August 2026). Specificity is how rarely it flags a place that is not a mine; sensitivity is how many real mines it finds.
This guide explains what the imagery shows, which satellites do which job, how change detection and alerts work, and how a licence holder, regulator or investor can tell mining that is outside a licence from mining that is inside one. It draws on published programmes in the Amazon, Ghana, Zambia and Nigeria, and it says where each method fails.
What satellites can and cannot show
A satellite sees ground, not law. It records bare earth, excavation, water colour and tracks. Whether that digging is illegal is a second question, answered by comparing the location with licence boundaries, protected-area maps and permits. Any claim that a satellite “detects illegal mining” really means two steps: detect mining activity, then test it against the legal map.
That distinction matters because artisanal and small-scale mining is not illegal by default. In Zambia, for example, the national overview by the Extractive Industries Transparency Initiative describes licensed artisanal and small-scale rights alongside unlicensed activity, and it reports that most formalised operators were following the law. The same overview shows why monitoring is hard: the survey sample found that 17% of the players did not have mining rights, and the authors say the true share may be higher in a larger sample (Zambia EITI, overview dated 2019).
So the useful output of monitoring is a ranked list of places where new disturbance appears, each tagged with a legal status: inside a licence, outside any licence, or inside a protected area. Teams then check the highest-risk places on the ground or with sharper imagery.
What mining scars look like from space
Mining leaves the same few marks wherever it happens. The table lists the ones that detection software and human analysts look for, and what each looks like in common imagery.
| Signature | What it looks like | Typical use |
|---|---|---|
| Cleared ground | Green vegetation replaced by pale or reddish bare soil | First sign of a new front |
| Pits and pools | Many small excavations, often water-filled, in a rough texture | Separates artisanal digging from large, smooth industrial pits |
| Sludge and tailings ponds | Bright, milky or brown ponds beside streams | Marks gold washing and processing |
| Silted rivers | A river that turns from dark to tan or grey downstream of a site | Shows alluvial and dredge mining |
| Access tracks | New straight lines cut into forest or scrub | Early warning before pits grow |
| Spoil heaps and waste dumps | Piles of bare rock beside pits | Confirms excavation scale |
Researchers have catalogued these features at scale. One global dataset of mine land use contains 74,548 polygons covering about 66,000 km², outlining waste rock dumps, pits, water ponds, tailings dams, heap leach pads and processing areas (Tang and Werner, Communications Earth & Environment, 2023).
Texture separates artisanal from industrial work. NASA’s account of a Ghana study says industrial mines show larger elevation change because they dig deeper, while a highly textured surface of small holes points to artisanal mining (NASA Earth Observatory, 2021).
Spectral signatures can also be automated. A US Geological Survey database of mining in the Copperbelt region of Zambia and the Democratic Republic of the Congo used a Sentinel-2 band ratio built on the finding that mining areas reflect strongly in the red band (band 4) and weakly in the shortwave infrared (band 12). The team ran it on 23 images from 2022 and 2023 at 20 m, then checked every flagged 1 km cell on imagery of about 2 m resolution (USGS, 2024). The ratio is a screen, not a verdict; a person confirmed each cell.
Water is the second signal. A satellite database spanning 37 years found 396 river-mining districts in 49 countries, and of 173 mining-affected rivers, 80% carried suspended sediment at more than double their pre-mining levels (Dethier and colleagues, Nature, 2023). A river that changes colour downstream is often the easiest sign to see from orbit.
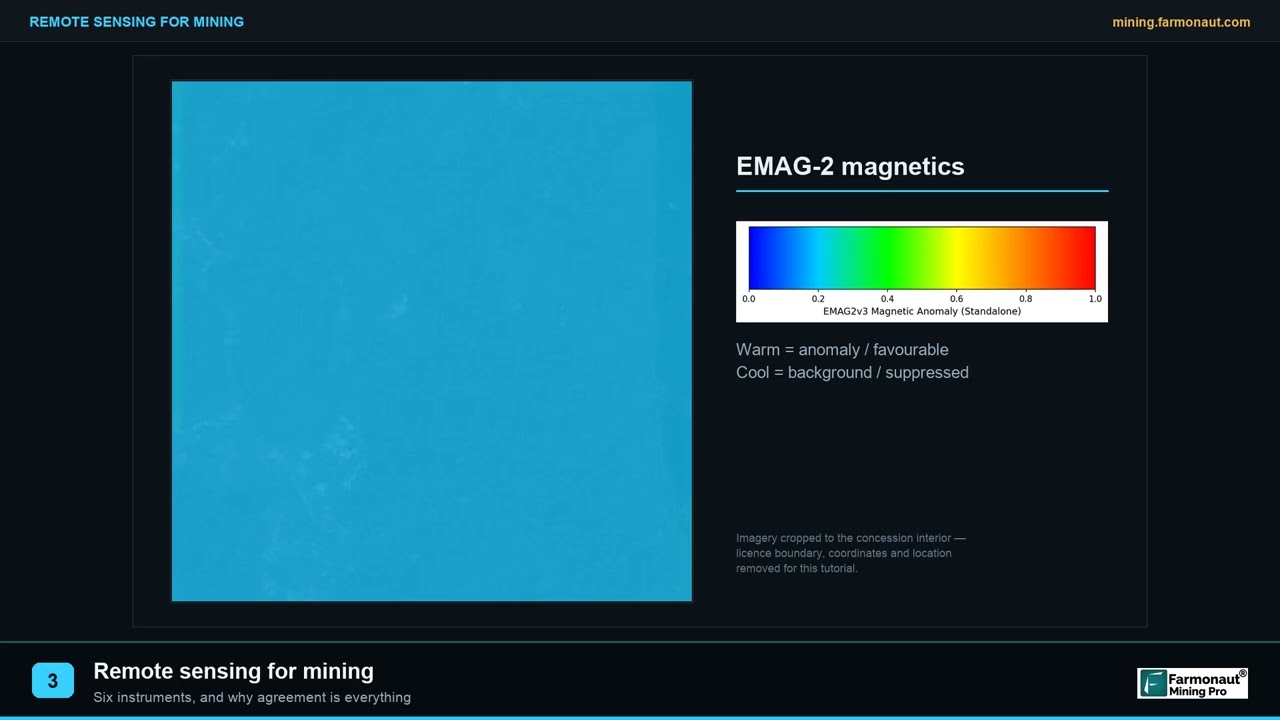
▶ Remote sensing for mining explained in three minutes: the instrument families and why agreement between them matters. · 2:01
Optical, radar and alert systems: which satellite does which job
Three kinds of data do most of the work: optical images from Sentinel-2 and Landsat, radar images from Sentinel-1, and alert layers that combine them. The right choice depends on cloud cover, the size of the thing you want to see and how fast you need to know.
| Data | Detail | Revisit | Best for | Weak point |
|---|---|---|---|---|
| Sentinel-2 (optical) | 13 bands; four at 10 m | 5 days | Bare ground, pits, ponds, river colour | Blocked by cloud |
| Landsat 8 and 9 (optical) | 30 m | 8 days together | Long archive from earlier Landsat satellites | Small pits blur at 30 m |
| Sentinel-1 (C-band radar) | Day and night, all weather | Six-day pattern | Forest clearing under cloud, rough surface change | Harder to read; no colour |
| Very-high-resolution commercial images | About 2 m in the USGS Copperbelt work | Tasked on demand | Verifying a flagged site | Cost and small coverage |
The figures come from the Sentinel-2 mission page (13 bands, four at 10 m, five-day revisit at the Equator), the Sentinel-1 mission page (radar that images in any weather, a six-day pattern in the current constellation) and NASA’s Landsat 9 page (Landsat 8 and 9 together observe the same place every 8 days). ESA says Sentinel-1C and 1D are taking over from Sentinel-1A, whose operations were planned to end in June 2026; check the mission page for the current pair before you plan a radar series.
The chart compares the three systems on the two numbers that matter most for small-scale mining: how sharp the pixel is and how often the satellite returns. Lower on the vertical axis is sharper; further left is faster.
Chart
Sharper or faster: three sensor families compared
Pixel size in metres against revisit time in days (lower left is better)
How change detection finds new mining, step by step
Change detection is the core of illegal mining remote sensing monitoring. It asks one question of each pixel: was this ground disturbed since the last good image? The steps below follow the published Amazon Mining Watch pipeline and the Global Forest Watch alert design, simplified.
Infographic
From image to alert in 5 steps
- 1BaselineBuild a dated, cloud-masked mosaic of the licence and a buffer.
- 2CompareFlag pixels that turned from vegetation or dark water to bare soil or sediment.
- 3ClassifyA model or analyst separates mining from farms, burns and sandbars.
- 4ConfirmRepeat detections and a second sensor cut false alarms.
- 5OverlayTest each site against licence and protected-area maps, then rank it.
- Build a clean baseline. Stack many images and mask clouds and cloud shadow so each period has one clear mosaic. Amazon Mining Watch runs its detector on an image mosaic built for each quarter.
- Compare each new mosaic with the baseline. A pixel that moves from green vegetation to bare soil, or from dark water to bright sediment, is a candidate.
- Classify the candidate. A model decides whether the pattern is mining or something else, such as farming, a burn scar or a river sandbar. Amazon Mining Watch scores 480 m by 480 m patches, about 23 ha each.
- Require repeat evidence. A single bright patch can be a cloud edge. The Amazon system holds recent quarterly detections as provisional and confirms a detection once it appears in two annual periods within a two-year window (Earth Genome, data release of 16 October 2026).
- Draw the footprint. A segmentation model outlines the mine scar at 10 m so area can be measured and tracked.
- Add the legal layer. Overlay licences, concessions and protected areas to rank the alerts.
Alert systems automate the first four steps. Global Forest Watch’s integrated disturbance layer combines GLAD-L (Landsat, 30 m), GLAD-S2 (Sentinel-2, 10 m), RADD (Sentinel-1 radar, 10 m) and DIST-ALERT. When two systems flag the same pixel the layer reports the highest confidence, and alerts from several systems within 180 days count as one event. In the Amazon in 2021, integrated alerts reached users on average nine days earlier than any single system (Global Forest Watch, January 2026). Those alerts track vegetation loss, not mining specifically, so a mining team still needs to classify what caused the loss.
Cloud is the main reason to use more than one sensor. The Amazon Mining Watch team notes that in the first quarter of 2026 some areas had no clear pixels at all, even though a satellite captured an image every five days, and the detector cannot find mines it cannot see. Radar passes through cloud, which is why RADD can flag forest loss when optical systems are blind. Our guide to radar imagery through cloud covers how it works.

▶ Can satellites see through clouds? How radar imagery works when optical pictures are blocked. · 2:37
How to tell whether mining is unlicensed: the cadastre overlay
A mining cadastre is the official register and map of licences. Overlaying it on detected disturbance is what turns “mining” into “mining outside a licence”. The quality of the answer depends on three things: how accurate the boundaries are, how current the register is, and what the licence actually allows.
Amazon Mining Watch publishes a worked example. Its legality layer sorts each detection into four classes of presumed illegality, described in the MAAP report that introduced it:
- Very high: activity without a permit inside a protected area that allows no resource use.
- High: activity outside any explicit mining concession.
- Medium: activity inside a concession whose active status or legal requirements could not be verified.
- Low: activity inside an active concession, with full compliance not verified.
The layer covers Bolivia, Brazil, Colombia, Ecuador and Peru, with the other countries planned, and it is called a presumption on purpose (MAAP #235, November 2025). A licence can be expired, mis-mapped or limited to certain minerals, and a registry may lag behind new grants. Treat every alert as a lead for checking, not a finding of fact.
For a licence holder the same logic runs in reverse. Mining encroachment detection means watching a buffer around your boundary, and the ground inside it, for new disturbance, then checking who holds the neighbouring rights. Digging that crosses a boundary can be a neighbour’s mapping error, an artisanal group entering open ground, or deliberate trespass. Your own licence file, the registered coordinates and the date of the first disturbance decide which. For the register side, see our guide to artisanal mining licence plot sizes and terms and how to check your licence area.
The calculator below turns a detection into practical numbers: how much of your licence is disturbed, how many pixels that is, the smallest patch your imagery can show, and the scale of material moved. Enter your own figures; the defaults are round examples. For scale, Kitco showed spot gold at about US$3,739 per troy ounce on 18 November 2026, roughly US$120 per gram; use today’s price.
Calculator
How big is the disturbed ground on your licence?
Enter your own licence, disturbance and pixel figures.
- Pixels in the disturbed area: 1,200
- Smallest patch you can trust (ha): 0.04
- Material moved (tonnes): 648,000
- Contained gold in that material (oz): 20,834
- Value at your example price (US$): $77,760,000
Example values only, not a benchmark or a forecast. Pixel area = pixel size squared. Material moved = disturbed area x depth x bulk density. Contained gold and value assume the example grade and price you enter; use today’s price and your own assay data. Satellite disturbance is not a resource estimate.
Illegal mining monitoring in the Amazon: what satellites found
Amazon Mining Watch is the most complete public example. Amazon Conservation, Earth Genome and the Pulitzer Center built it, and it moved to quarterly updates in 2025. The first quarterly report confirmed gold-mining expansion in all nine Amazon countries, 37,109 hectares in 2025 up to September, with Brazil at 15,538 ha, Peru at 6,511 ha and Guyana at 4,942 ha (MAAP #235, November 2025). Over 200 protected areas and Indigenous territories saw new mining in 2025, covering an estimated 14,004 ha, of which 56% was in protected areas and 44% in Indigenous territories.
The report also shows how imagery tells a story. Mining along the Rio Puré crossed from Brazil into Colombia’s Rio Puré National Park for the first time, and the change in river colour between two quarters revealed the sediment released. Colombia had until then been mostly spared from alluvial mining on land.
The data are public. The detections sit on Source Cooperative under a Creative Commons 4.0 licence, one entry per location with model confidence and a confirmed or provisional flag. The maintainers also warn that the mine-scar area layer is the least mature part of the pipeline and runs large compared with hand-drawn outlines, so comparisons between periods are more trustworthy than any single total.
Chart
New gold-mining area detected in the Amazon by country
Hectares of recent mining expansion in 2025 up to September, nine Amazon countries (total 37,109 ha)
Galamsey in Ghana: what satellite studies measured
Galamsey is the local name for unregulated small-scale gold mining in Ghana. It has been tracked from space for more than a decade, and the studies show what each sensor adds.
NASA researchers and Ghanaian partners used decades of Landsat data to classify vegetation loss in south-western Ghana. They found more than 160,000 hectares of vegetation lost from 2005 to 2019, of which about 28% went to industrial and artisanal gold mining, 29% to urban growth, 17% to water and 25% to other causes. Of the mining loss, artisanal operations accounted for 85.7% and industrial mines for 14.3% (NASA Earth Observatory, 2021). Artisanal mining supplied roughly a third of national gold output at the time of the study yet caused seven times more deforestation than industrial mining between 2007 and 2017.
A second study used UK-DMC2 satellite images of Ghana’s cocoa-growing area. It found illegal galamsey area more than tripled from 10,907 ha in 2011 to 36,696 ha in 2015, and that by 2015 it had reached at least 603 ha of protected forest reserve, as summarised in a 2022 technical guidance document on remote sensing for artisanal gold mining policy (Giuliani and colleagues, University of Geneva open archive).
Rivers show the downstream effect. A Joy Online water-security analysis recorded turbidity readings of 94,800 NTU on the Ayensu and 64,000 NTU on the Birim, and quoted Ghana Water Limited saying extreme turbidity can make it lose up to 50% of water in treatment against a normal 5%. The turbidity units measure suspended material in water, and a satellite sees the same effect as a colour change. For the deposits and mines behind these belts, see our post on Ghana gold deposits, belts and galamsey.
The wider health cost is chemical. A Nature Communications study in the Peruvian Amazon notes that mercury emissions from artisanal and small-scale gold mining across the Global South now exceed coal combustion as the largest global source of mercury. Satellites cannot see mercury, but they can show where gold washing is happening upstream of communities.
Chart
What took the vegetation in south-western Ghana
Share of more than 160,000 ha of vegetation loss, 2005 to 2019
▶ The seven main environmental impacts of mining, explained in plain words. · 2:31
Illegal mining in Zambia: what the record and satellite data show
People searching for Zambia illegal mining usually want two things: how common unlicensed mining is and whether anyone watches it from space. The published record is thinner than for the Amazon or Ghana.
The 2019 EITI overview of artisanal and small-scale mining says the Ministry of Mines and Minerals Development lacked funds for monitoring visits. The Geological Survey Department relied on desk reviews and satellite imagery to follow environmental compliance remotely, which the report says made enforcement a challenge. It recommended routine inspections and moves to help illegal operators formalise (Zambia EITI, overview dated 2019).
A public map of mining on the Zambian side is the USGS Copperbelt database by Boston and Alessi. It covers the copper-cobalt belt across the DRC and Zambia, drawing on the Zambia Cadastre portal (2023 data), Sentinel-2 imagery (2022 to 2023) and very-high-resolution images (2019 to 2023), and it records whether each mined cell is artisanal or small scale, or medium to large scale. It maps where and at what scale mining occurs. It does not classify legality, and it is not a monitoring service.
A practical Zambian workflow is therefore the one described above: Sentinel-2 and radar for detection, the Mining Cadastre register for licence boundaries, and field or high-resolution checks for anything inside or beside a licence. Licence terms, fees and registration steps must come from the ministry; check with the Ministry of Mines and Minerals Development before you apply or act. Our post on artisanal and small-scale gold mining rules and costs explains how licence tiers differ.
Nigeria: Mining Marshals and satellite plans
Nigeria’s Mining Marshals unit marked its first year in March 2025, and the Federal Ministry of Information reported that 327 suspected illegal miners had been arrested and 98 sites recovered. The minister said the Marshals would integrate satellite technology, drones and miniature robots into their operations to give both air and ground coverage. The statement describes plans, not results from a satellite programme. Our post on illegal mining in Nigeria, laws, scale and tech fixes goes deeper.
False alarms and how monitoring teams filter them
Every detection system produces false alarms, and the published ones say so. Amazon Mining Watch’s team described early quarterly runs in which the western Amazon lit up with false positives. The causes were sandbars in rivers coming off the Andes and small forest clearings with no mining, and thin cloud tails brightened the sandbars until they looked like mines. They fixed it by training on the exact cloudy patches that fooled the model and by removing very small mines and mines on sandy river beds from the training set. Two post-processing steps then cut leftover noise: a higher confidence cutoff for isolated patches, and the repeat-detection rule described above.
They also report a size limit: below a certain size, 10 m Sentinel-2 pixels blur the features that tell a small mine from a plain forest clearing. A single pixel covers 0.01 ha, so a 0.1 ha pit is about ten pixels and the margin is thin.
Teams use the same tools to keep errors down:
- Two sensors agree. An optical alert and a radar alert on the same pixel is stronger evidence than either alone.
- Repeat detection. New digging stays. A cloud or a sandbar often does not.
- Clustering. Mining spreads from existing scars, so an isolated patch needs a higher confidence score than one beside known mines.
- Sharper imagery on demand. A 2 m image settles most doubtful cases, as in the USGS Copperbelt validation.
- Local knowledge. Rangers, community monitors and licence holders know which clearings are farms.
Satellites map the surface; people confirm what is on it and who is responsible.
What a licence holder can do about encroachment
Satellite monitoring helps a licence holder most when it starts before there is a problem. These steps are a sensible order of work for a small or mid-size operator:
- Fix your boundary file. Keep the registered coordinates as a KML, KMZ or shapefile in latitude and longitude. A boundary that is wrong by 100 m produces false encroachment alerts.
- Record a dated baseline. Save a clear Sentinel-2 mosaic of the licence and a ring around it from the last dry season, with its date.
- Choose a check interval. Monthly suits fast-moving alluvial ground; quarterly suits slower areas. Add a radar series if cloud hides the ground for months.
- Set a trigger. For example, any new bare patch of four pixels or more inside the boundary or a defined buffer. The calculator above shows how large that is on the ground.
- Verify before you act. Pull a sharper image or send a geologist you trust. Check the register to see who holds the neighbouring rights.
- Keep a log. Store the images with their acquisition dates, the boundary file and the times you checked.
- Report through the proper channel. Give the regulator or police the evidence. Do not confront diggers yourself; sites with mercury, deep pits and armed groups are dangerous.
Farmonaut works from a KML, KMZ or polygon of an area of interest and screens ground from space for exploration; its mineral reports are exploration screening, not an encroachment alert service, and satellite results are exploration targets, not a resource estimate.
Investors can use the same overlay on a project they are evaluating. Ask whether the licence area shows existing artisanal pits, whether the title is clean on the cadastre, and how large the disturbed share of the ground is. Disturbance can lower the value of ground before any drilling and it brings community and permitting risk. This page is for information, not investment advice.
Frequently asked questions
How do satellites detect illegal mining?
They compare images of the same ground over time and look for new bare soil, pits, ponds, tracks and silted rivers. A classifier separates mining from farming or burns. The location is then checked against licence and protected-area maps to judge whether the mining is permitted.
Can satellites tell whether mining is illegal?
Not by themselves. Imagery shows activity. Legality depends on the licence register, permits and protected-area rules. Amazon Mining Watch uses the word presumption for this reason, and ranks detections from low to very high likelihood of illegality.
Which satellite is best for illegal mining detection?
Sentinel-2 is the usual workhorse: 10 m pixels, a five-day revisit and open data. Radar from Sentinel-1 is the back-up when cloud blocks optical images, and very-high-resolution images (about 2 m) are used to verify flagged sites. Landsat gives the long history.
How often can a licence area be checked from space?
Sentinel-2 passes every five days in principle, and Landsat 8 and 9 together every eight days. Cloud cuts the usable images, so many programmes report monthly or quarterly. Amazon Mining Watch posts new data within about ten days of each quarter’s close.
How small a mine can Sentinel-2 see?
One pixel is 10 m by 10 m, or 0.01 ha. A cluster of a few pixels is about the smallest pit that can be mapped reliably, and the Amazon Mining Watch team found that below a certain size forest clearings and mines look alike at 10 m.
What is galamsey and how is it tracked from space?
Galamsey is unregulated small-scale gold mining in Ghana. NASA-led work used Landsat to measure vegetation loss in the south-west, and other studies mapped its spread with higher-resolution images and river sediment. Pits, ponds, bare soil and brown water are the visible marks.
How is illegal mining monitored in Zambia?
The published record shows the Geological Survey Department using desk reviews and satellite imagery for environmental compliance because field visits were underfunded, and the Mining Cadastre holding licence boundaries. The USGS Copperbelt database maps mining scale, not legality. Check recent ministry announcements for any new programme.
Can satellites see through clouds to find mines?
Radar can. Sentinel-1 images in all weather and at night, and the RADD alert system uses it to flag forest loss through cloud. Radar images are harder to read than optical ones, so teams usually pair the two.
What is mining encroachment and how do I detect it?
Encroachment is mining that crosses a licence boundary. To detect it, watch a buffer around your boundary and the ground inside it for new disturbance, using a dated baseline and regular images, then check the cadastre to see who holds the neighbouring rights.
Is Amazon Mining Watch data open to download?
Yes. Earth Genome publishes the detections on Source Cooperative under a Creative Commons 4.0 licence, with a README that explains confirmed and provisional status and the two-year persistence rule.
What should I do after I see new digging inside my licence?
Confirm it with a sharper image or a trusted site visit, save dated imagery, check the cadastre for the neighbouring licences and report to the regulator or police. Keep your people away from the site, because sites often involve mercury, unstable pits and risk of violence.
This page is for information only. It is not investment advice and not legal advice. Confirm licence boundaries and rules with the regulator. Do not enter or confront active mining sites: they can involve mercury, unstable pits and violence.
Farmonaut mining
Get a quote for your licence area
Licence owners can ask for a satellite mineral report on their ground from a KML, KMZ or polygon.
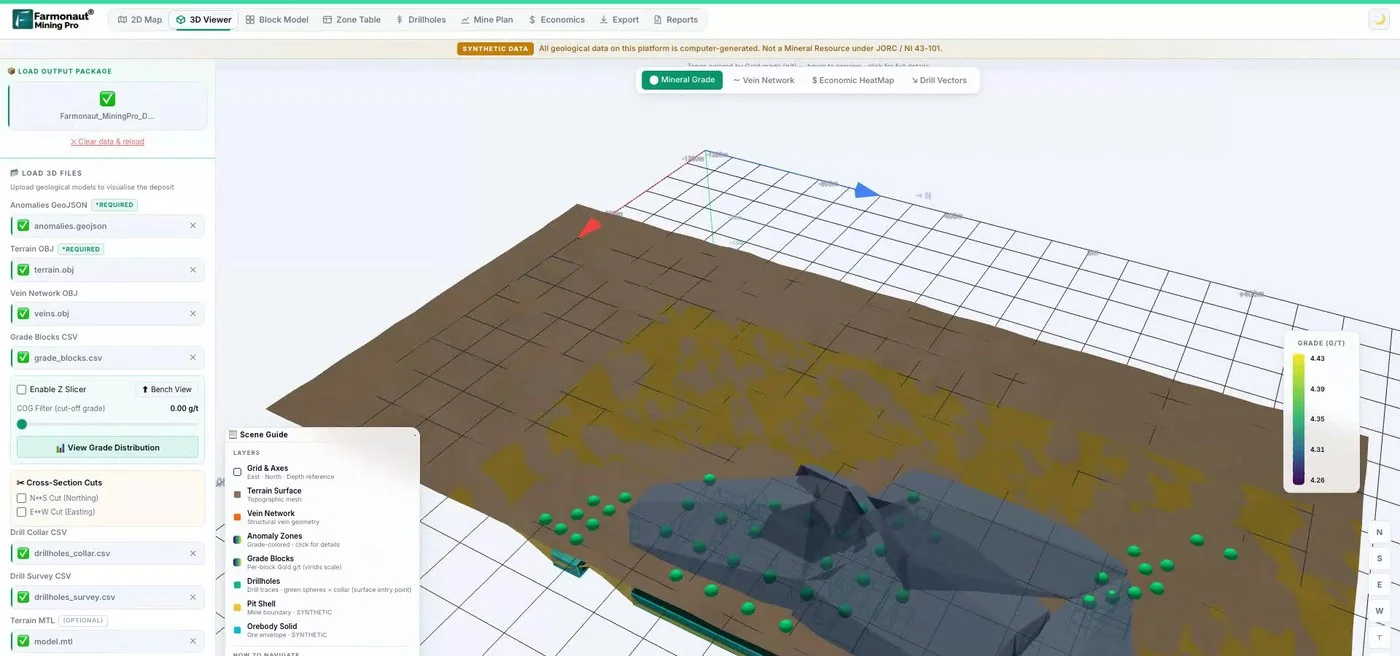
Mining Pro sample view, synthetic data
Sources
- Earth Genome, Amazon Mining Watch: August 2026 update: earthgenome.org
- Amazon Conservation (MAAP), MAAP #235: AI-powered detection of Amazon gold mining deforestation: maapprogram.org
- Earth Genome, Amazon Mining Watch data on Source Cooperative: source.coop
- NASA Earth Observatory, The large footprint of small-scale mining in Ghana (2021): science.nasa.gov
- Dethier and colleagues, A global rise in alluvial mining increases sediment load in tropical rivers, Nature (2023): nature.com
- Tang and Werner, Global mining footprint mapped from high-resolution satellite imagery, Communications Earth & Environment (2023): nature.com
- Giuliani and colleagues, Remote sensing in support of artisanal and small-scale gold mining policy, University of Geneva (2022): access.archive-ouverte.unige.ch
- USGS, Database of artisanal, small-scale and large-scale mining in the Copperbelt region of the DRC and Zambia (2024): data.usgs.gov
- Global Forest Watch, Integrated disturbance alerts (January 2026): globalforestwatch.org
- ESA SentiWiki, Sentinel-2 mission: sentiwiki.copernicus.eu
- ESA SentiWiki, Sentinel-1 mission: sentiwiki.copernicus.eu
- NASA, Landsat 9: landsat.gsfc.nasa.gov
- Zambia EITI, An overview of artisanal and small-scale mining in Zambia (2019): zambiaeiti.org
- Federal Ministry of Information and National Orientation, Nigeria, Mining Marshals one-year report (March 2025): fmino.gov.ng
- Joy Online, Wealth over water: how galamsey is threatening Ghana’s water security: myjoyonline.com
- Nature Communications, Amazon forests capture high levels of atmospheric mercury pollution from artisanal gold mining: nature.com
Discussion
Questions, corrections or field experience? Share them below. First-time comments are reviewed before they appear, and your email is never published.
No comments yet. Be the first to add a question or your experience.

 Dalgety Minerals Pty Ltd
 Faith At Work (Pty) Ltd
 Geotech Mining Solutions plc
 Vulcan International Limited
 Kidepo Associates
 GKY Mining
 Alkimy SARL
 Double A Trading
 GemSprout Metals Limited
 Qader Group
 Ileys General Trading
 SG Gold Mining LLC
 VRV Global Pte Ltd
 Omsri International FZE
 G.I.T.T.
 Jaunita Erss Ltd
 Almosi SARL
 SRK Consulting
 Berks Gold Limited
 Mwerezi Minerals Company Limited
 Mining SARL
 SenGold Invest SAS

 Client · Oregon, USA · Gold
 Exploration consultancy · South Africa · Gold










