

Radar remote sensing · Explainer and workflow
Can SAR See Through Clouds? Radar for Mineral Exploration
Yes: SAR imagery sees through clouds and rain and works at night, because the satellite sends its own microwave pulse. It maps structure, roughness, moisture and ground movement, but it cannot identify minerals, so explorers pair it with optical and shortwave-infrared data.
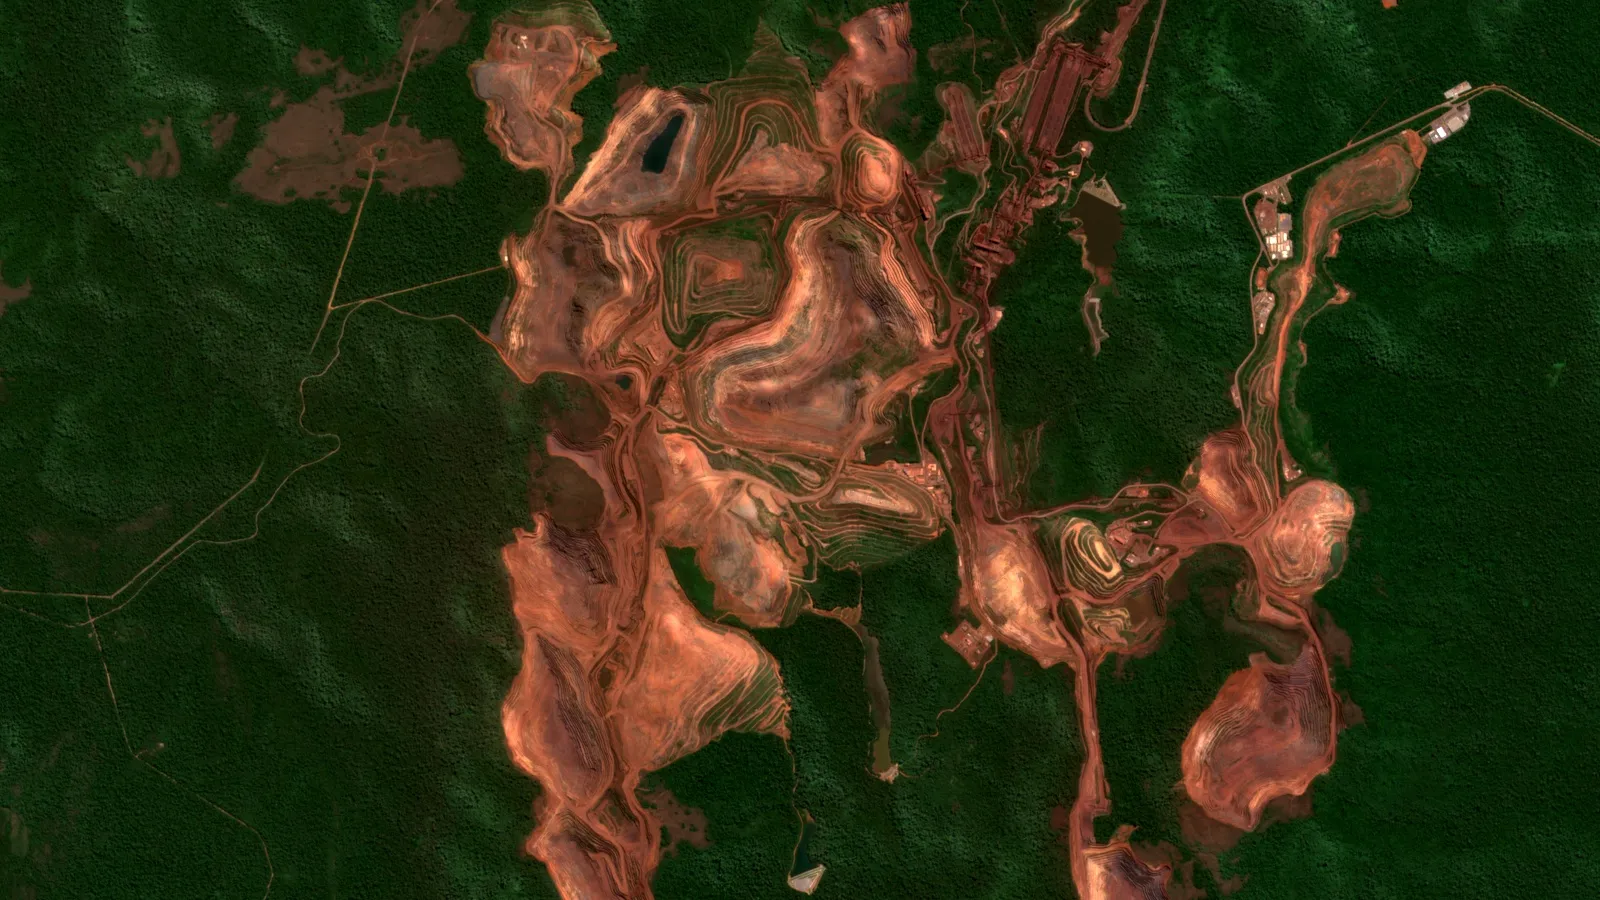
Key takeaways
- Radar with a wavelength above 2 cm passes through cloud and above 4 cm through rain (ESA TM-17, 2005); Sentinel-1 C-band is about 5.55 cm (SentiWiki).
- Tropical and subtropical forests average 80.1% annual cloud frequency against a global median of 51% (MODIS, 2000 to 2014, Wilson and Jetz, PLOS Biology).
- Sentinel-1 gives a 250 km swath at 5 m by 20 m and a six-day exact repeat with two satellites (12 days for one satellite); NISAR L-band data are archived at ASF and openly available (SentiWiki; NASA).
- L-band radar can penetrate metres of very dry sand, but not damp ground or thick dunes (Skonieczny et al., Nature Communications).
- In one Taiwan test, adding Sentinel-1 to Sentinel-2 plus terrain data did not raise lithology accuracy: 82.78% against 84.30% (Chen et al., Sensors, 2025).
In this article
- Why clouds stop optical satellites but not radar
- SAR bands compared: X, C, S and L
- How cloudy is the ground you explore
- What SAR shows geologists
- SAR lineament mapping in six steps
- What SAR cannot do and how it pairs with optical
- SAR vs optical: choosing for your project
- Where to get SAR data
- Tropical cloud belts and other places radar pays off
- Checklist before you commission or buy radar work
- Frequently asked questions
Yes. Synthetic aperture radar (SAR) imagery sees through clouds, rain and darkness, because a SAR satellite sends its own microwave pulse and records the echo instead of waiting for sunlight. NASA describes SAR as an active technique that makes imagery night or day regardless of weather (NASA Earthdata). For a geologist working in a cloud belt, that means a radar scene arrives on schedule while the optical scene of the same ground is a white smear. What radar gives you is structure, surface texture, moisture and ground movement. What it does not give you is the colour and mineral signature that optical and shortwave-infrared sensors read, so the two are partners, not rivals.
This guide is written for exploration geologists, consultants, licence and concession holders and investors who need to know when radar earns its place in a project. It covers how the physics works, the four radar bands and what each can see, what SAR can and cannot map on a prospect, lineament mapping step by step, where the data come from, and a calculator that compares how many radar scenes and clear optical scenes you can expect in your own cloud conditions.
Why clouds stop optical satellites but not radar
Optical sensors such as Landsat and Sentinel-2 measure sunlight reflected from the ground in visible, near-infrared and shortwave-infrared light. Water droplets in a cloud scatter that light, so the sensor records the cloud top and not the rock. Radar uses wavelengths of centimetres to metres, thousands of times longer than light. NASA notes that these longer wavelengths let radar image landforms that are covered by cloud or sit under dense tree canopy (NASA Earthdata). An ESA technical memorandum on radar in geology states the rule of thumb: radar with a wavelength above 2 cm passes through cloud, and above 4 cm it also passes through rain (ESA TM-17, 2005).
Sentinel-1, the workhorse radar satellite for geoscience, makes the same point in its mission documentation: its C-band instrument can observe the surface at any time of day or night, regardless of weather, because its wavelength is not impeded by cloud cover or lack of illumination (SentiWiki, Sentinel-1 mission).
Active and passive: the one idea to hold on to
An optical sensor is passive. It needs the sun and a clear path. A SAR sensor is active. It transmits a pulse, measures how much energy bounces back (the backscatter) and how long the round trip took. The picture is therefore a map of how the ground interacts with microwaves: how rough it is, how steep, how wet, and what it is made of at the scale of the wavelength. It is not a photograph, and it is not a mineral map.
What “synthetic aperture” means
Fine detail from a radar needs a very long antenna. NASA gives the example that a C-band radar in orbit would need an antenna about 4,250 m long to reach 10 m resolution. SAR gets around this by combining many pulses recorded along the satellite’s path, which simulates a much larger antenna (NASA Earthdata). You do not need the mathematics. You only need to know that the pixel size and the look geometry are fixed by the sensor, and they shape what you can interpret.
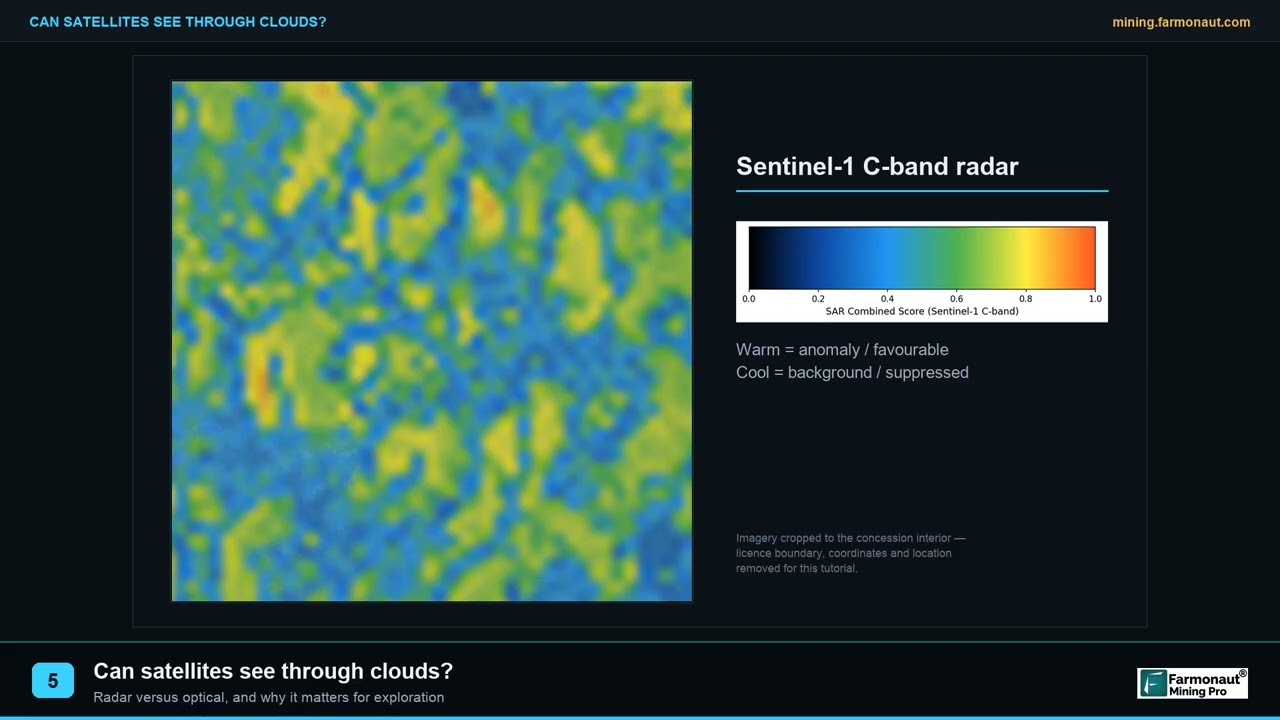
▶ Why optical satellites fail under cloud and how radar fixes it in tropical exploration. · 2:14
SAR bands compared: X, C, S and L
Radar bands are named by letters, and the wavelength decides how the signal behaves. A short wavelength reacts to small surface features and stops at the top of vegetation. A long wavelength reaches deeper into canopy and, under the right conditions, into the ground. NASA’s band table lists X-band (about 2.4 to 3.8 cm) as high-resolution with little penetration into vegetation, C-band (3.8 to 7.5 cm) as the workhorse for global mapping and change detection, S-band (7.5 to 15 cm) as increasingly used, and L-band (15 to 30 cm) as having high penetration and suited to InSAR (NASA Earthdata).
Chart
Radar wavelength by band
Centimetres, satellites named in the text
| Band | Wavelength | Example satellites | What it is best at in geology |
|---|---|---|---|
| X | About 3 cm | ICEYE and other commercial constellations | Fine surface detail, tasked scenes of a single licence or pit, little canopy penetration |
| C | About 5.5 cm | Sentinel-1 | Regional structure and texture, repeat coverage, InSAR on bare or built ground |
| S | About 9.4 cm | NISAR (S-band radar; distributed separately from the L-band archive) | Between C and L: more vegetation penetration than C |
| L | About 23 to 24 cm | ALOS-2 and ALOS-4 PALSAR, NASA NISAR | Structure under vegetation, InSAR over vegetated ground, dry-sand penetration in deserts |
Wavelength figures: Sentinel-1 operates at 5.405 GHz, about 5.55 cm (SentiWiki); NISAR carries an L-band radar at 24 cm and an S-band radar at 9.4 cm (NASA Science); ICEYE satellites transmit at 9.65 GHz in X-band (ESA Earth Online).
Why band choice matters under forest
NASA’s example is useful for tropical projects. An X-band signal of about 3 cm interacts mostly with leaves at the top of the canopy. An L-band signal of about 23 cm reaches larger branches and trunks, so it carries more information from below the crown. A C-band signal mostly senses the top layers of the canopy (NASA Earthdata). Over dense rainforest, every band still mostly shows the canopy surface, but canopy height and density follow the ground shape, so landforms and large structures still show through as texture and tone.
Polarisation in one paragraph
Radar can transmit and receive horizontally or vertically polarised waves, written HH, VV, HV or VH. NASA explains that bare soil and water scatter most strongly in VV, forest canopy volume shows best in cross-polarised VH or HV, and double-bounce from trunks, buildings or flooded vegetation shows best in HH. Sentinel-1’s main land mode records VV plus VH (SentiWiki). For lineament work, both channels are usually worth checking because they respond differently to vegetation.
How cloudy is the ground you explore
Cloud is not an occasional nuisance in many exploration regions. It is the climate. NASA reports that nearly a decade of satellite data suggests clouds typically cover about 67 percent of Earth’s surface, and that over land about 30 percent of skies are completely clear of cloud (NASA, Cloudy Earth). A 1 km cloud climatology built from MODIS data confirms equatorial South America, the Congo River basin and Southeast Asia as the cloudiest regions, with annual cloud frequencies of 80 percent or more, and finds that tropical and subtropical forests average 80.1 percent against a global median of 51 percent (Wilson and Jetz, PLOS Biology). Those figures are the share of midday observations flagged as cloudy over 2000 to 2014, so they describe a typical day, not a particular season.
The practical effect is a data-gap problem. A Sentinel-2 pair of satellites revisits the same ground every five days at the equator (ESA Sentinel-2 facts and figures). If four in five of those passes are clouded out, you get an unobstructed view about once every 25 days on average, and in a wet season far less often. A Sentinel-1 constellation with an exact six-day repeat keeps delivering on schedule. The calculator below turns your own numbers into a comparison.
Calculator
How many radar scenes against clear optical scenes will you get?
Enter your window and your own cloud estimate to compare radar and optical coverage.
- Radar scenes in the same window: 15.0
- Days to collect your clear optical scenes: 75
- Days for the same number of radar scenes: 18
Example values only, not a forecast. Sentinel-1 constellation exact repeat is 6 days (SentiWiki); Sentinel-2 revisit is 5 days at the equator (ESA). The 80% default echoes the average cloud frequency of tropical forest biomes, 80.1% (Wilson and Jetz, MODIS 2000 to 2014); the global median is 51%. The sum treats each optical pass as independently cloudy, while real cloud comes in spells, so true waits are usually longer. A single Sentinel-1 satellite repeats every 12 days, and the six-day figure applies only where both satellites acquire, so set the radar revisit to 12 if your area is covered by one. Radar scenes still need processing and are not always usable on steep slopes.
What SAR shows geologists
Radar answers a different set of questions from optical imagery. These are the five uses that matter on a prospect.
Structure and lineaments
Faults, shear zones, joint sets and contacts often leave straight or gently curved features in drainage, ridges and vegetation. Radar looks across the ground at an angle, so low relief that vanishes in flat-lit optical images casts radar highlights and shadows. ESA’s radar geology memorandum notes that a SAR image formed from at least six acquisitions is practically without speckle and is an excellent basis for mapping fracture zones, regional foliation, structural lines and drainage networks (ESA TM-17). Structure matters because many gold, copper and base-metal systems are controlled by faults and shear zones, as the page on shear zone gold explains.
Surface roughness and rock texture
Backscatter depends on roughness at the scale of the wavelength. ESA’s memorandum gives plain examples: a stony desert is very rough for C-band radar and appears bright, while a sandy beach, short grass or calm water is smooth and appears dark. Different rock types weather into different textures, so lithological contacts can show up as changes in tone and texture even where soil and plants cover the rock (ESA TM-17).
Soil moisture and drainage
Wet ground reflects microwaves strongly, so radar is sensitive to moisture. ESA reports that C-band detection of soil moisture as deep as 5 cm has been described, and that moisture sharply reduces how far the signal can enter the ground (ESA TM-17). For a geologist this means drainage lines, seepage zones and moisture contrasts across faults can show in a time series, with the caution that a wet scene and a dry scene of the same ground can look quite different.
Penetration of dry sand: L-band, desert ground only
In very dry, fine sand, L-band radar can see below the surface. A Nature Communications study of the Mauritanian coast notes that L-band radar can penetrate metres of low-loss material such as windblown sand and so probe the first metres of subsurface geology in arid areas. The authors used PALSAR to map a buried paleoriver bed about 520 km long, and they report that thick dunes stopped them from reconstructing the whole system (Skonieczny et al., Nature Communications). The same paper cites earlier L-band mapping of a 900 km river system in the Libyan desert where the Calanscio Sand Sea again blocked deeper penetration. The rule is simple: it works in hyper-arid sand, in the first few metres, and it fails in damp or thick sand. It is not a way to see ore at depth, and it does not work in vegetated or wet ground.
Ground movement at mines: InSAR
Interferometric SAR (InSAR) compares the phase of radar returns from two or more passes to measure how the ground moved between them, at centimetre to millimetre scale (NASA Earthdata). Two mining examples show what that looks like. A study of an open-pit iron mine in South Africa processed Sentinel-1 scenes taken every 12 days between January 2020 and May 2021 and its preliminary results pointed to movement on the south-east pit wall (Haupt et al., ISPRS Archives). At the Dexing copper mine in China, a Sentinel-1 time series of 118 scenes from 2018 to 2021 showed the upper part of a tailings dam moving away from the satellite at about 40 mm per year and the lower part moving toward it at about 8 mm per year (Xie et al., Sensors). InSAR is a monitoring tool for operating mines and a screening tool for old workings. It is not a prospecting tool for new ground, and results must be checked against surveyed points.
SAR lineament mapping in six steps
Lineament mapping is the most common reason an explorer asks for radar. A lineament is a straight or slightly curved line on the image, usually a fault, joint, dyke or contact. Follow this order to keep the result honest.
Infographic
Lineament mapping in six steps
- 1Choose scenesSeveral dates, same orbit and mode, both look directions.
- 2Correct terrainCalibrate and fix slope distortion.
- 3Cut speckleAverage dates or filter.
- 4EnhanceVV, VH, ratios and directional filters.
- 5Extract linesTrace by hand, by algorithm, or both.
- 6Check on the groundMatch to maps, outcrops and drill data.
- Choose the scenes. Download several acquisitions from the same orbit and mode, in both ascending and descending passes if available. A pass from the east lights slopes that a pass from the west leaves in shadow.
- Calibrate and correct the terrain. Convert raw values to backscatter, then correct for slope. Foreshortening makes slopes facing the sensor short and bright, and back-slopes long and dark (ESA TM-17). Without correction a hill can look like a structure.
- Reduce speckle. Average several dates of the same ground, or filter. The grainy texture of radar images is called speckle and averaging scenes is the cleanest way to reduce it.
- Enhance. Display VV, VH and their ratio, apply directional filters and view the result at several illumination directions.
- Extract the lines. Trace lineaments by hand, by automatic edge detection, or both. A University of Porto master’s dissertation on heavy-mineral placers compared manual and automatic extraction on Sentinel-1 and LiDAR data and concluded that Sentinel-1 suits regional mapping because of its wide coverage and availability, while LiDAR gives more detailed maps at smaller scales (Araújo, University of Porto). For terrain-based structure mapping see the page on LiDAR in geology.
- Check against ground data. Compare your lines with mapped faults, outcrops and drill intersections, and discard lines that follow roads, field boundaries, pipelines or the radar look direction itself. A lineament that always runs along the satellite’s flight direction is probably an artefact.
Treat the output as a list of structures to visit, not as proof of a fault. Mapping tells you where to look. Sampling and drilling confirm.
What SAR cannot do and how it pairs with optical
Radar has no mineral spectrum. Shortwave-infrared (SWIR) light is where hydroxyl-bearing alteration minerals such as clays and micas leave their marks, and ASTER-type SWIR bands are the classic tool for mapping hydrothermal alteration (Beiranvand Pour and Hashim, SpringerPlus). A radar image cannot tell kaolinite from sericite or iron oxide from bare soil. That is the job of optical and SWIR sensors. The full comparison of sensor families is on the page about remote sensing and mineral exploration, and the overall method is described in how satellite exploration works.
Chart
Lithology classification accuracy by data set
Validation overall accuracy, %, random forest, vegetated study area in Taiwan
| Question | SAR (radar) | Optical and SWIR |
|---|---|---|
| Works through cloud and at night | Yes: active sensor, wavelengths above 2 cm pass through cloud | No: needs sunlight and a clear path |
| Identifies alteration minerals | No: no mineral spectrum | Yes: SWIR bands separate clays, micas and iron oxides |
| Maps faults and lineaments | Strong: oblique look enhances low relief | Good in clear scenes, weak under haze or flat light |
| Reads soil moisture and roughness | Yes: its main strength | Indirect only |
| Measures ground movement | Yes: InSAR to centimetre or millimetre level | No |
| Mountain and steep terrain | Distorted by slope stretching (foreshortening), slope overlap (layover) and shadow | Shadow, but no geometric stretching |
| Dense forest | Shows canopy surface; L-band sees further down | Shows leaves only |
Does adding radar improve rock classification
The honest answer is “sometimes, and not by much”. A China Geological Survey study classified lithology in a densely vegetated area of Taiwan with a random forest model on different data sets. On validation data, Sentinel-2 alone scored 81.90 percent overall accuracy, Sentinel-2 with a digital elevation model reached 84.30 percent, and adding Sentinel-1 radar on top gave 82.78 percent, no better. Terrain data alone scored 57.22 percent (Chen et al., Sensors). That is one study in one area, but it fits a practical rule: radar is most useful where cloud removes the optical data, and adds less where you already have good optical coverage and terrain.
▶ How satellites help find gold: they map iron stains, clay minerals and fractures rather than the metal itself. · 4:25
SAR vs optical: choosing for your project
Use the climate and the question to decide.
- Persistently cloudy ground and a structural question. Start with radar. Add optical scenes from the clearest dry-season weeks for alteration.
- Dry, clear ground and an alteration question. Start with optical and SWIR. Radar is optional and adds structure and roughness.
- Operating pit, dump or tailings dam. InSAR time series, checked against survey points.
- Desert with blown sand. L-band radar for buried drainage and structure in the first metres, with the dune caveat above.
- Dense forest. L-band where you can get it, with a lineament list checked on the ground.
Where to get SAR data
You do not need a commercial contract to start. These are the main sources and what they offer.
Chart
Sentinel-1 swath width by imaging mode
Kilometres; wider swath means coarser pixels
Sentinel-1 (C-band, open)
Sentinel-1 is the Copernicus radar mission. After Sentinel-1B ended in 2022, Sentinel-1C was launched on 5 December 2024 and Sentinel-1D on 4 November 2025 (SentiWiki). The main land mode, Interferometric Wide, covers a 250 km swath at 5 m by 20 m resolution, and a two-satellite constellation gives a six-day exact repeat cycle (SentiWiki). Data are available through the Copernicus Data Space Ecosystem, and the Alaska Satellite Facility (ASF) offers HyP3, an on-demand service that turns Sentinel-1 data into analysis-ready products.
ALOS-2 and ALOS-4 PALSAR (L-band)
Japan’s L-band satellites have long been a main source of L-band data for geology. JAXA lists ALOS-4, with its PALSAR-3 instrument, as in operation, with stripmap swaths of 100 to 200 km against 50 to 70 km on ALOS-2, and ScanSAR swaths of up to 700 km against 490 km (JAXA, ALOS-4). Check JAXA’s data policy and licence terms before you plan a time series.
NISAR (L-band and S-band)
NASA’s NISAR was launched on 30 July 2025. NASA states that the data are archived at the Alaska Satellite Facility and are openly available, and that provisional L-band products were released on 20 July 2026, calibrated and validated at a limited number of sites around the world (NASA Science). That makes global L-band coverage with open access a realistic tool for exploration, with the caveat that the products are provisional.
Commercial X-band constellations
Commercial X-band satellites are tasked on request and give fine detail. ESA reports that 82 ICEYE X-band SAR satellites had been launched as of 2026, with modes from wide Scan down to 1 m Spotlight images (ESA Earth Online). X-band is a good fit for a single pit, dump or road, and a poor fit for regional structure under forest.
Chart
L-band coverage per observation, ALOS-2 and ALOS-4
Largest swath or scene side listed for each mode, km
Tropical cloud belts and other places radar pays off
Radar for geology is not new. Airborne radar was already mapping structure in cloudy, forested ground in the 1980s.
- Papua New Guinea. A 1987 AAPG conference abstract on the southern fold and thrust belt reports that the area is seldom clear of cloud and is covered by rainforest, and that airborne radar penetrated the cloud and let geologists recognise rock types by texture and tone despite the canopy (Ellis and Pruett, AAPG).
- Equatorial South America, the Congo basin and Southeast Asia. These are the regions with annual cloud frequencies of 80 percent or more in the MODIS record (Wilson and Jetz). A licence in the Guiana Shield, the Congo basin or Kalimantan is likely to fall in that pattern, so check the cloud record for your own block.
- Hyper-arid deserts. L-band penetration of dry sand has revealed buried river courses in the Sahara (Skonieczny et al.), which matters for placer and paleochannel targets.
- Open pits, dumps and tailings. Anywhere a mine needs repeat ground-movement measurements, InSAR gives wide coverage between surveyed points.
▶ Remote sensing for mining in three minutes: the six instrument families and why agreement between them matters. · 2:01
Checklist before you commission or buy radar work
- State the question. Structure, roughness, moisture or movement. Radar answers these. Mineral identity it does not.
- Ask which band and mode. C-band for regional work, L-band for vegetation and deserts, X-band for a single site.
- Ask how many dates. A single scene is noisy. Several dates of the same orbit are far better.
- Ask for both look directions in rugged ground.
- Ask how terrain distortion was corrected.
- Ask what was checked on the ground. A lineament map with no field check is a hypothesis.
- Pair it with an alteration layer. Radar finds the plumbing. Optical and SWIR find the alteration.
If you want those layers combined for your own licence, a Farmonaut satellite mineral report works from multispectral and hyperspectral data to flag alteration, faults and fracture zones, and you can request a quote through the form on this page. For how satellite data compare with ground methods before you spend on a campaign, see satellite vs geochemistry vs geophysics, and for how layers are combined into targets see mineral prospectivity mapping.
Frequently asked questions
Can SAR imagery work when optical satellites are blocked by clouds?
Yes. SAR is an active sensor whose microwaves pass through cloud and rain, and it works at night. NASA describes SAR imagery as available night or day regardless of weather conditions, and an ESA technical memorandum says radar with a wavelength above 2 cm penetrates cloud (ESA TM-17).
What is SAR imagery used for in mineral exploration?
Mapping faults and lineaments, rock texture, drainage and moisture, buried channels under dry sand, and ground movement at mines. It is not used to identify minerals.
Can synthetic aperture radar find minerals directly?
No. Radar measures roughness, moisture, geometry and ground movement. Mineral and alteration identification uses optical and shortwave-infrared data, with sampling to confirm.
What is the difference between SAR and optical imagery?
Optical sensors are passive and record reflected sunlight, so clouds and darkness block them. SAR is active, records its own echo and works in any weather. Optical shows colour and mineral spectra. SAR shows structure and texture.
Does Sentinel-1 work for geology?
Yes, for regional structure, texture and ground movement. It has C-band, a 250 km swath in its main land mode and a six-day exact repeat with two satellites (SentiWiki). It does not penetrate dense vegetation well and cannot identify minerals.
What does L-band SAR show that C-band does not?
L-band, at about 23 to 24 cm, reaches deeper into vegetation canopy and can penetrate metres of dry sand. C-band is better for open ground and regional coverage.
How is SAR used for lineament mapping?
Several calibrated, terrain-corrected scenes are averaged to reduce speckle, enhanced at different illumination directions, and lines are traced by hand or algorithm, then checked against field data. Sentinel-1 suits regional work while LiDAR gives finer detail (Araújo, University of Porto).
Can radar see through jungle?
Radar passes through cloud, but over dense forest the return comes mostly from the canopy. Longer wavelengths such as L-band penetrate deeper. Landforms and large structures still show as texture and tone, which is why radar has been used for geological mapping in rainforest.
Can SAR see underground?
Only in very dry, fine sand, and only the first few metres with L-band. Moisture sharply reduces penetration (ESA TM-17). Radar cannot see ore at depth.
Is NISAR data available for exploration?
NASA states that NISAR data are archived at the Alaska Satellite Facility and openly available, with provisional L-band products released on 20 July 2026 (NASA Science).
This page is for information only. It is not investment or engineering advice. Satellites map surface and near-surface signatures; sampling and drilling confirm.
Farmonaut mining
Screen your licence area from space
Request a quote to have your ground screened for alteration, faults and fracture zones with satellite data before you plan fieldwork.
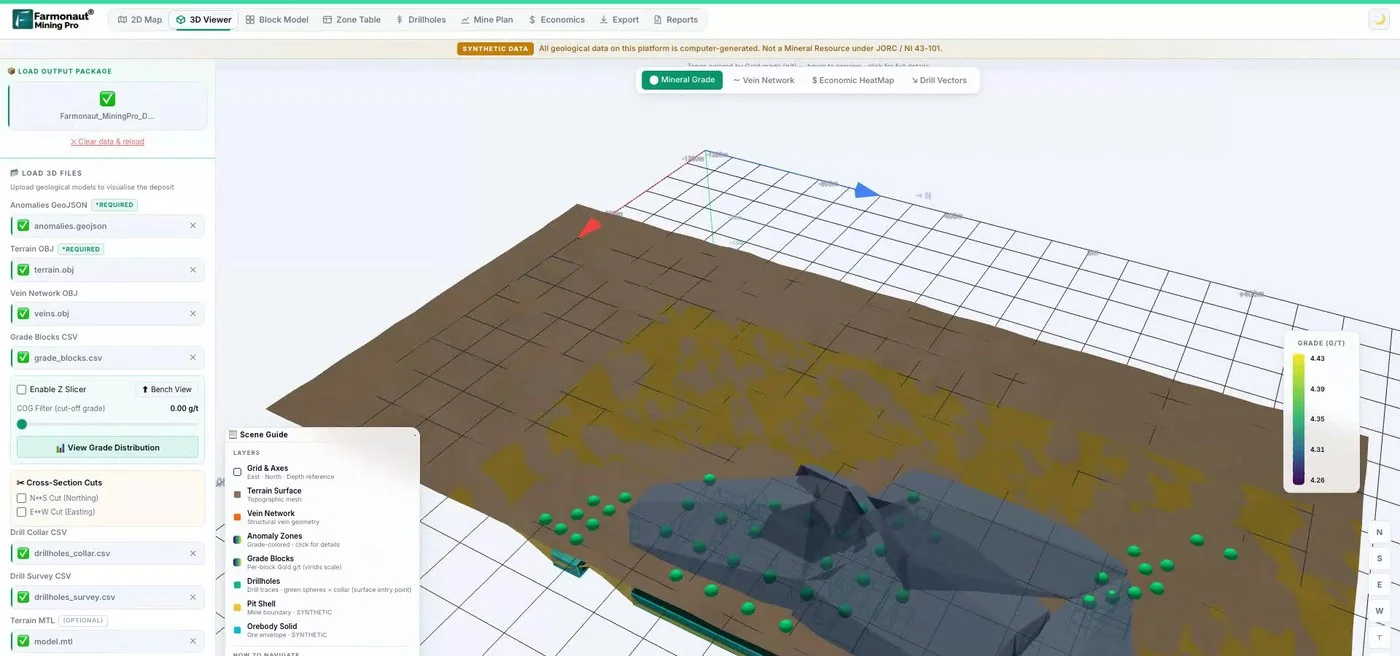
Mining Pro sample view, synthetic data
Sources
- NASA Earthdata, Synthetic Aperture Radar (SAR): earthdata.nasa.gov
- ESA, Spaceborne radar applications in geology, TM-17 (2005): earth.esa.int
- Copernicus SentiWiki, Sentinel-1 mission: sentiwiki.copernicus.eu
- Copernicus Data Space Ecosystem, Sentinel-1: dataspace.copernicus.eu
- Alaska Satellite Facility (ASF): asf.alaska.edu
- NASA Science, NISAR mission: science.nasa.gov
- JAXA, ALOS-4 (DAICHI-4): global.jaxa.jp
- ESA Earth Online, ICEYE mission: earth.esa.int
- ESA, Sentinel-2 facts and figures: esa.int
- NASA, Cloudy Earth: nasa.gov
- Wilson and Jetz, global cloud dynamics, PLOS Biology (2016): pmc.ncbi.nlm.nih.gov
- Skonieczny et al., Western Sahara river system, Nature Communications (2015): pmc.ncbi.nlm.nih.gov
- Haupt et al., time-series InSAR in an open-pit mine, ISPRS Archives (2023): isprs-archives.copernicus.org
- Xie et al., Dexing tailings dam SBAS-InSAR, Sensors (2023): ncbi.nlm.nih.gov
- Araujo, radar and hyperspectral data for placers, University of Porto (2024): repositorio-aberto.up.pt
- Chen et al., lithological mapping in high-vegetation areas, Sensors (2025): mdpi.com
- Beiranvand Pour and Hashim, ASTER, ALI and Hyperion for lithological mapping, SpringerPlus (2014): pmc.ncbi.nlm.nih.gov
- Ellis and Pruett, foldbelt exploration with SAR in Papua New Guinea, AAPG (1987): searchanddiscovery.com
Discussion
Questions, corrections or field experience? Share them below. First-time comments are reviewed before they appear, and your email is never published.
No comments yet. Be the first to add a question or your experience.

 Double A Trading
 GemSprout Metals Limited
 Qader Group
 Ileys General Trading
 SG Gold Mining LLC
 VRV Global Pte Ltd
 Omsri International FZE
 G.I.T.T.
 Jaunita Erss Ltd
 Almosi SARL
 SRK Consulting
 Berks Gold Limited
 Mwerezi Minerals Company Limited
 Mining SARL
 SenGold Invest SAS
 Sean Mining Limited
 NTS Group (Pty) Ltd
 Mine4Africa

 Client · Oregon, USA · Gold










