

Original research · James Bay, Quebec
James Bay Lithium Claims: A Sentinel-2 Outcrop Survey
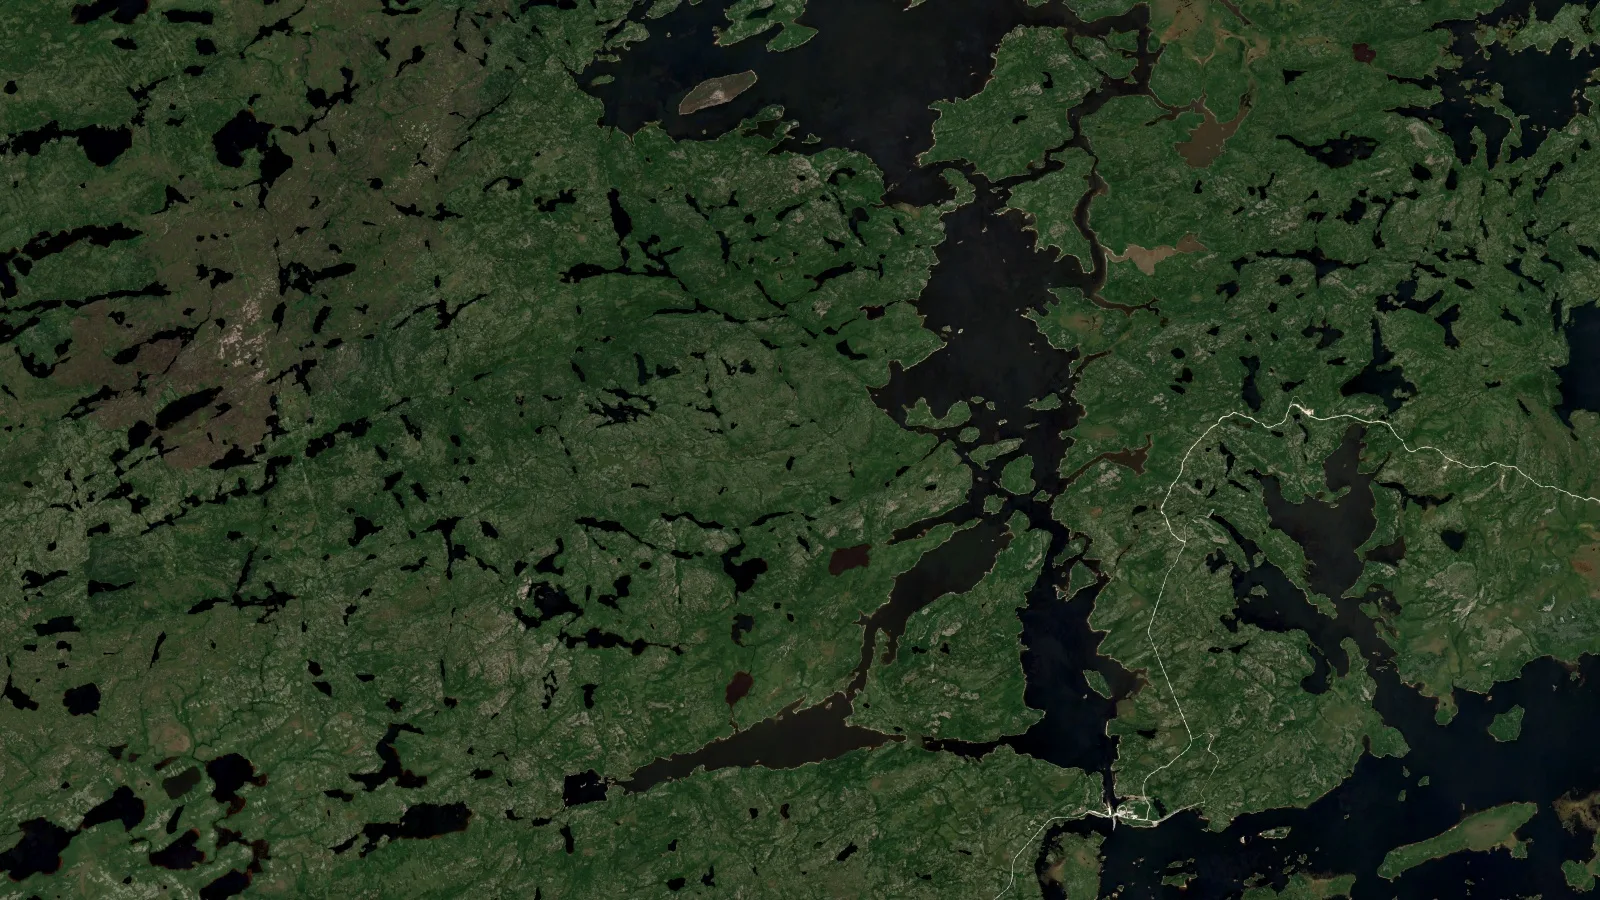
James Bay lithium exploration now sits on about 124,700 active map-designated claims covering 6.5 million hectares, half of all claims in Quebec, but in our Sentinel-2 test corridor less than 1% of the land shows bare rock, so most claimed ground cannot be judged from surface imagery alone.
Key takeaways
- On 13 October 2026, Quebec’s GESTIM file listed 124,695 active map-designated claims in Eeyou Istchee Baie-James, 49.3% of the province’s total.
- More active claims there were issued in 2023 (14,741) than in any other year; 31.8% of all active claims have never been renewed.
- Of 153 SIGÉOM showings that list lithium in the James Bay box, 115 carry a discovery year in the 2020s.
- In a 2.39-million-hectare Sentinel-2 test corridor, only 0.78% of land pixels were bare, and claimed land was barely barer than unclaimed land (0.81% vs 0.76%).
- A bright, low-iron outcrop proxy was 2.6 times more common within 500 m of known lithium showings than across the corridor: a screening aid, not a detector.
In this article
- Why we built a James Bay lithium dataset from open sources
- How many James Bay lithium claims are there?
- James Bay lithium showings: a 2020s story
- The test corridor: Eastmain to La Grande
- How much rock can Sentinel-2 see on James Bay lithium claims?
- What the data means for a James Bay lithium field program
- Where Farmonaut fits, and where it does not
- Frequently asked questions about James Bay lithium
Most writing about James Bay lithium is about individual projects. This page is about the ground itself. We counted the claims in the Quebec government’s public titles file, dated the lithium showings in its geoscience database, and measured how much rock Sentinel-2 can see through the boreal forest, peat and lakes of the Eastmain-La Grande corridor. The audience is the geologist, land manager or investor who has to decide where the next dollar of grassroots work goes, and wants numbers rather than adjectives.
If you want the mineral system itself, our explainer on lithium deposits: pegmatite, brine and clay covers how LCT pegmatites form, and the lithium in Canada overview covers the national picture. For licences in other countries, the mining cadastre portal guide by country is the hub. Here we stay with James Bay lithium claims and the data anyone can download.
Canada’s two producing lithium mines turned out an estimated 5,983 tonnes of lithium in 2024, about 2.5% of world mine output, according to Natural Resources Canada.
Why we built a James Bay lithium dataset from open sources
Ask ten people how big the James Bay lithium rush is and you will hear ten different numbers, usually taken from press releases. Quebec already publishes the raw material to answer the question properly. The Ministère des Ressources naturelles et des Forêts (MRNF) posts its GESTIM digital data as Shapefile, MapInfo and GeoPackage downloads. We used the active-titles file dated 13 October 2026. Its user agreement allows derived works as long as the source is credited, and it warns that the file is raw data behind the official titles map, drawn at a nominal 1:50,000 scale, not the official map itself.
The second source is SIGÉOM, Quebec’s geoscience database. Its showings, deposits and mines layer is published on Données Québec under a CC BY 4.0 licence. Each record lists the main and secondary substances and a discovery year, which lets us count lithium showings by decade without naming a single property.
The third source, and the one that turns this into a James Bay lithium survey rather than a claims census, is the Copernicus Sentinel-2 archive, read through Google Earth Engine’s harmonized surface-reflectance collection. Sentinel-2 records 13 spectral bands at 10, 20 and 60 m, according to the European Space Agency’s mission description. We worked at 20 m, the resolution of the short-wave infrared bands that matter most for rock.
We ran everything with scripts that anyone with an Earth Engine account and the same files can rerun. The claim and showing counts cover the whole territory. The satellite part covers a named sub-area, because processing every pixel of a territory larger than many countries would have been a much bigger job than this question needs.
How many James Bay lithium claims are there?
Strictly, the GESTIM file does not say which claims are for lithium. A map-designated claim gives the holder an exclusive right to explore for mineral substances in general, so the honest count is of all claims in the territory. On 13 October 2026, the file held 252,838 active map-designated claims in Quebec. Of these, 124,695, or 49.3%, sit in the territory that GESTIM records as the Gouvernement régional d’Eeyou Istchee Baie-James. Together they cover 6,546,362 hectares, about 16.2 million acres. The median claim is 53.1 hectares, roughly 131 acres, because cells shrink toward the north on the provincial grid.
That is not all lithium ground. The southern part of the territory overlaps gold country in the Abitibi greenstone belt, and some of the densest claim blocks in our half-degree grid sit there. But the growth of the last five years tracks the James Bay lithium story closely, and the chart below shows when today’s active claims were first issued.
Chart
Active James Bay claims by year of issue
Claims still active on 13 Oct 2026, Eeyou Istchee Baie-James, by issue year (selected years; 2026 to 13 October)
Read this chart with one caveat. It shows claims that are still active, sorted by the year they were issued. A claim staked in 2019 and dropped in 2022 does not appear. So the bars understate the older years and say nothing about turnover. Even so, 2023 stands out: 14,741 claims issued that year are still held, more than any other year. 2025 and 2026 (to 13 October) each added more than 10,000 that are still active.
The renewal count tells a related story. A first term lasts three years, and renewals run in two-year terms, according to the MRNF page on how to obtain an exclusive exploration right. In the territory, 39,635 active claims (31.8%) have never been renewed, 31,803 have been renewed once, and 28,032 have been renewed five times or more. That is a young James Bay lithium land package sitting on top of an older one.
From claim to exclusive exploration right
Quebec now calls the claim an exclusive exploration right, or EER. The MRNF says the EER is “formerly known as a claim” and is the only exploration title available in the province. You obtain one by map designation of grid cells through GESTIM. Most people in the industry, and most searchers, still say “claim”, so we use both words here.
The fees depend on which side of the 52nd parallel the ground sits. On the MRNF’s rates page, as of 15 July 2026, a right of more than 50 hectares north of the 52nd parallel costs C$244.40 to register when a holder takes 1 to 150 rights in a day, and C$1,222.00 each above 150. South of the parallel, a right of 25 to 100 hectares costs C$104.98 for the first 40 in a day. Renewal fees follow the same area bands. Rates are indexed every 1 January, and 2026 indexation was 2.05%. General information, not legal advice; confirm with the MRNF before you designate.
The GESTIM file also records how much work each claim needs before its next renewal. For active claims north of the 52nd parallel in the territory, the median requirement rises with each term: C$135 in the first term, C$450 in the second, C$900 in the third, C$1,350 in the fourth, C$1,800 in the fifth and sixth, and C$2,500 from the seventh term on. Summed across every active claim in the territory, the work required for the current term comes to about C$153.9 million.
Calculator
What does it cost to hold a block of James Bay claims?
Claims north of the 52nd parallel. Amounts in Canadian dollars (C$).
- Fees (C$): $36,660
- Minimum work required (C$): $74,250
- Years covered: 7 years
- Per hectare, 51.74 ha median claim (C$): 42.87 C$/ha
Canadian dollars (C$). Fee per right C$244.40 is the MRNF rate for rights over 50 ha north of the 52nd parallel, 1 to 150 rights per day, as of 15 July 2026 (Gouvernement du Québec, rates and indexation); registration and each renewal are charged at that rate. Work per claim per term is the median required work for active northern claims in Eeyou Istchee Baie-James in the GESTIM file of 13 Oct 2026 (C$135, 450, 900, 1,350, 1,800, 1,800, then 2,500). First term 3 years, renewals 2 years. Excludes the higher fee above 150 rights a day, register fees, taxes and carried-over work credits. General information, not legal advice; confirm with the MRNF.
At the defaults, 50 northern claims held for three terms, or seven years, need C$36,660 in fees and C$74,250 of required work: about C$110,900 in total, or roughly C$43 a hectare. Most of that is work, which is the point of the system: James Bay lithium claims are cheap to stake and costly to keep idle. The cheapest way to meet it is to spend it on the ground that most deserves it, and that is where the satellite part of this study comes in.

▶ Video (2 min 25 s): how satellite and soil data are being combined in Canadian critical-mineral exploration. · 2:25
James Bay lithium showings: a 2020s story
SIGÉOM records each showing with its substances and a discovery year. We searched every main and secondary substance field for lithium (Li) and kept records inside the bounding box of the territory’s active claims, 49.0 to 55.0° N and 79.5 to 70.0° W. That box is a little wider than the territory, so a few showings near its edges may sit just outside. We counted each showing once.
The box holds 153 lithium showings. One was recorded in the 1950s, eleven in the 1960s, two in the 1970s, none in the 1980s, two in the 1990s, four in the 2000s and eighteen in the 2010s. Then 115, three in every four, were recorded in the 2020s. The chart below starts at the 1960s.
Chart
Lithium showings by decade of discovery
SIGÉOM showings listing Li, James Bay territory bounding box, by recorded discovery year
Two cautions apply to these James Bay lithium showing counts. A discovery year in SIGÉOM is the year a showing was recorded, which follows reporting, not geology. And a showing is a documented occurrence of a substance, often a single outcrop or sample, not a resource. What the curve does show is how fast the documented James Bay lithium inventory has grown, and how recently most of it was written down. Much of the ground around those new showings was mapped at regional scale long before anyone looked for spodumene.

▶ Video (3 min 11 s): satellite and geochemical screening in another Canadian district, British Columbia, for comparison with James Bay. · 3:11
The test corridor: Eastmain to La Grande
For the satellite part we chose a single rectangle, 52.0 to 53.5° N and 78.0 to 75.5° W, between the Eastmain and La Grande rivers. We picked it from the data, not from any project: it contains three of the five half-degree cells with the most lithium showings in the territory. It holds about 2.39 million hectares of land (5.9 million acres) after lakes and rivers are removed, 18,847 active claims that touch it, and 52 of the lithium showings counted above. On our rasterised count, 33.2% of its land sits under an active claim. The whole box lies north of the 52nd parallel, so the northern fee bands apply.
This is Cree territory. The James Bay and Northern Quebec Agreement divides it into Category I, II and III lands, and the Cree Nation Government’s Cree Nation Mining Policy (June 2024) states that no mineral claims can be made on Category I land without prior approval by the affected Cree First Nation. The same policy says the territory holds over 300 traplines, each managed by a designated tallyman. We come back to what that means for a field program below.
How the satellite classes were made
We took every Sentinel-2 surface-reflectance scene over the corridor from July to September in 2019 to 2022 with less than 40% cloud, 580 scenes in all. We masked cloud, cloud shadow, cirrus and snow with the scene classification band, then took the median of each band at every 20 m pixel. Using summers before 2023 was deliberate. Quebec’s 2023 fire season burned 42,883 km², according to Environment and Climate Change Canada, and fresh burn scars look like bare ground to a vegetation index.
Each pixel then went into one of four classes. Water: the scene classification marked it as water, or the modified water index was above zero. Bare: the vegetation index (NDVI) was below 0.25. Bright low-iron outcrop: bare, with mean visible reflectance above 0.12, a red-to-blue ratio below 1.6 and short-wave infrared (band 11) reflectance above 0.20. Everything else counted as vegetated land. The thresholds were set by hand, not trained on known pegmatites. The idea follows published work: Cardoso-Fernandes, Teodoro and Lima used Landsat, Sentinel-2 and ASTER to map lithium-bearing pegmatites in scenes with low vegetation cover. White, iron-poor felsic rock is what a spodumene pegmatite often looks like at surface. So does a quartz vein, a granite dome, a sand esker or a gravel pit.
Infographic
From open data to a James Bay field program
- 1ScreenGESTIM map, SIGÉOM showings and satellite outcrop classes.
- 2DesignateMap designation in GESTIM; three-year first term.
- 3Plan and informAnnual work plan to the municipality and Cree community 30 days ahead.
- 4Work and reportOutcrop mapping and sampling; report the work to the MRNF.
- 5Renew or dropRenew in two-year terms with fees and required work.
The flow above is how this kind of screen fits a real James Bay lithium program in Quebec. The steps after the screen come from the MRNF’s own pages, and the order matters: the screen tells you where to designate and where to walk, while the rules decide when you may walk there.
How much rock can Sentinel-2 see on James Bay lithium claims?
Very little. Across the corridor, 0.78% of land pixels were bare: about 18,600 hectares out of 2.39 million. Claimed land was barely different from unclaimed land, at 0.81% against 0.76%. Across 328 grid cells of 0.1 degree, the rank correlation between how much of a cell is claimed and how much bare rock it shows was 0.08, close to none. When we split the cells into quarters by bare-rock share, the share under claim stayed between 31.9% and 34.2% in every quarter.
Chart
How much bare rock a 0.1-degree cell shows
Grid cells in the Eastmain-La Grande corridor by bare-rock share of land (328 cells)
Most cells show almost nothing. 187 of the 328 cells, 57%, have less than 0.5% bare land; only 21 reach 2% or more. That is the reality of exploring a lowland of black spruce, lichen, peat and lakes. It also explains why James Bay lithium claims cannot be valued from imagery alone. Where the rock is hidden, the satellite has nothing to measure, and the decision has to rest on geology, geophysics, till and lake-sediment geochemistry and boots on the ground.
The bright-outcrop proxy near known lithium showings
The second number is more encouraging. Our bright, low-iron proxy covered 0.048% of corridor land. On unclaimed land it was 0.041%; on claimed land it was 0.062%, half again as much. Within 500 m of the 52 known lithium showings, a combined 3,811 hectares, it rose to 0.126%: 2.6 times the corridor average and 3.1 times the unclaimed rate.
Chart
Bright low-iron outcrop pixels, by zone
Share of land pixels flagged as the felsic-outcrop proxy (%), Eastmain-La Grande corridor
For James Bay lithium explorers, note what did not change. Bare ground of any kind was no more common near the showings (0.65%) than elsewhere. What changed was the type of bare surface: brighter, less iron-stained, more reflective in the short-wave infrared. That is consistent with white pegmatite outcrops, or with the stripped and trenched outcrop that follows a discovery. Our test cannot separate the two, and with 52 showings it is a small sample. Treat it as a reason to look, not as a result.
The limits: forest, peat, fire, snow and pixel size
Every James Bay lithium number on this page depends on what the ground surface allows. In plain words, here are the limits we know about.
- Vegetation: a thin cover of lichen or moss hides rock completely from an optical sensor. The NDVI threshold sends those pixels to the vegetated class.
- Glacial cover: much of the lowland is blanketed by till, clay and peat left by the last ice sheet. Rock under a metre of till is invisible to Sentinel-2 at any resolution.
- Fire: burned stands look bare for years. We used pre-2023 summers to avoid the 2023 scars, but older burns can still add false bare ground.
- Snow and cloud: only July to September scenes were used, with clouds and snow masked. Thin haze that the mask misses can still brighten pixels.
- Pixel size: 20 m is coarse next to a dyke a few metres across. Narrow pegmatites will be missed or diluted.
- Grid geometry: claims were rasterised at 20 m, and the GESTIM file is drawn at a nominal 1:50,000, so edge pixels are approximate.
None of this makes satellite screening useless on James Bay lithium ground. It makes it a ranking tool for the small fraction of land that is exposed, and a planning tool for access, camps and traverses on the rest. On the exposed fraction, higher-resolution and hyperspectral imagery can say far more than our four simple classes.

▶ Video (2 min 38 s): soil-based methods for covered Canadian Shield ground, where outcrop is scarce, as in most of James Bay. · 2:38
What the data means for a James Bay lithium field program
Put the James Bay lithium numbers to work. Think of a junior holding 50 claims, about 2,600 hectares, in the corridor. On our averages it might show about 20 hectares of bare ground and about one hectare of bright, low-iron outcrop, around 30 pixels at 20 m. Those few hectares are where a prospecting crew should land first. The rest of the block needs other tools before anyone spends drill money on it.
Calculator
How much outcrop might a James Bay block show from orbit?
Expected surface indicators from Farmonaut’s Sentinel-2 corridor averages.
- Bright low-iron outcrop: 1.2 ha
- Bright 20 m pixels to field-check: 30
- Bare area in acres: 48.2 acres
Default shares are Farmonaut’s Sentinel-2 averages for the Eastmain-La Grande corridor (Jul-Sep 2019-2022 median, 20 m): 0.78% bare and 0.048% bright low-iron outcrop. Use 0.81% and 0.062% for claimed land, or 0.126% for the bright share within 500 m of known lithium showings. One 20 m pixel is 0.04 ha; 1 ha is 2.471 acres. Results are expected areas of surface indicators, not pegmatites, resources or values.
Here is an order of work that follows from the numbers and the rules:
- Desk screen in winter. Pull GESTIM to see open and held ground, SIGÉOM for showings and old reports, and a summer satellite composite for outcrop and access. Rank the exposed patches.
- Designate with intent. If you are adding ground, map designation through GESTIM gives a three-year first term. North of 52°, fees jump above 150 rights in one day, so plan the batch.
- Plan and inform. The MRNF’s annual work planning rule requires the plan to reach the local municipality and the Indigenous community concerned at least 30 days before any work, airborne surveys included, with an information session on request.
- Walk the bright patches first. July to September is the clear-sky window our composite used. Map, sample and photograph the flagged outcrops before you move to covered ground.
- Report and renew. Outcrop work goes into the MRNF’s simplified exploration work report; reports over C$5,000 must be signed by the qualified professional who supervised the work.
Where Farmonaut fits, and where it does not
We are a satellite data company. Our satellite-based mineral detection work analyses multispectral and hyperspectral imagery for alteration, lithology and structure, and lithium is on our list of detectable materials. A client sends an area as coordinates, KML/KMZ or a polygon, names the target mineral, and gets ranked high-potential zones with GIS files, usually in 5 to 20 business days depending on size and complexity. We have scanned more than 100,000 hectares across more than 20 minerals and 25 countries. Remote screening of this kind can cut early-exploration timelines from months to days and reduce early-stage cost by up to 80 to 85%.
What we do not do matters as much on James Bay lithium ground. Our results are exploration targets that sit ahead of any resource estimate. They are not NI 43-101 disclosure, and a qualified person still has to sample, drill and report; our NI 43-101 explainer covers that line. We are not a licensing agent or a land broker, and a land screen is not an environmental or social clearance. On covered ground, where this study shows most of the territory sits, a satellite report helps you decide where to send the geophysics and the crew, not whether a deposit exists. For the geophysical side, see geophysical survey methods for mining, and for public geology data across Canada, our guide to geological survey agencies.
There are over 300 traplines covering the territory, and the harvesting activities on each are managed by a designated responsible tallyman.” (Cree Nation Mining Policy, 2024)
Method notes and how to reproduce this James Bay lithium survey
All inputs, scripts and result tables are kept with this article’s working files. The steps are short enough to rerun on a newer GESTIM file.
- Claims: active titles shapefile from the GESTIM download directory, file of 13 October 2026. Kept map-designated claims (title code CDC) whose municipality field is Eeyou Istchee Baie-James. Holder fields were deleted on load. Claims were counted by issue year, renewal count and half-degree cell, and rasterised at 20 m for the corridor.
- Showings: SIGÉOM metallic substances table from Données Québec, downloaded 15 October 2026. Kept records listing Li in any substance field, inside 49.0 to 55.0° N and 79.5 to 70.0° W, one record per showing number.
- Imagery: Sentinel-2 L2A harmonized, July to September 2019 to 2022, scene cloud below 40%, scene-classification masks for cloud, shadow, cirrus and snow, per-band median, 20 m in UTM zone 18N, 120 tiles.
- Statistics: class shares of land pixels for the whole corridor, claimed and unclaimed land, and 500 m buffers around showings; and per 0.1° cell, sampled every 25th pixel, with cells under 200 sampled land pixels dropped.
Because the GESTIM file updates often, James Bay lithium claim counts will drift between versions. Anyone rerunning the scripts on a newer file should expect different totals and the same broad picture: a territory with half the province’s claims, a young land package, and very little rock at surface.
Frequently asked questions about James Bay lithium
How many mining claims are there in James Bay, Quebec?
In the GESTIM active-titles file of 13 October 2026, Eeyou Istchee Baie-James held 124,695 active map-designated claims covering about 6.55 million hectares, 49.3% of the 252,838 in Quebec. Not all are for lithium, because a claim covers mineral substances in general.
Why is James Bay lithium exploration so active?
The documented lithium inventory has grown fast. Of 153 SIGÉOM showings listing lithium in the James Bay box, 115 were recorded in the 2020s. Claim issue dates show the same pattern, with 2023 the peak year among claims still active.
What is a map-designated claim in Quebec now called?
An exclusive exploration right (EER). The MRNF describes it as formerly known as a claim and the only exploration title in Quebec. It is obtained by map designation in GESTIM for a first term of three years, then renewed in two-year terms.
How much does a claim cost north of the 52nd parallel?
As of 15 July 2026, the MRNF lists C$244.40 per right over 50 hectares for 1 to 150 rights a day, and C$1,222.00 per right above 150. Renewal fees follow the same area bands. Rates are indexed each January; confirm with the MRNF.
Can satellites find lithium in James Bay?
They can flag exposed rock whose colour and short-wave infrared response resemble pegmatite, which is a useful screening step. They cannot see through forest, peat or till, and in our test corridor only 0.78% of land was bare. Every satellite flag needs a field check.
How much bare rock is there on James Bay lithium claims?
In the Eastmain-La Grande corridor, 0.81% of claimed land and 0.76% of unclaimed land showed bare rock or bare ground in Sentinel-2 summer imagery. 57% of 0.1-degree cells had less than 0.5% bare land.
Do I need Cree consent to explore in Eeyou Istchee?
The Cree Nation Mining Policy says no claims can be made on Category I land without prior approval of the affected Cree First Nation. On all land, the annual work plan must reach the Indigenous community concerned 30 days before work, and the policy expects contact with tallymen. Confirm the rules for your block with the Cree Nation Government.
When is the field season in James Bay?
We built our composite from July to September scenes to keep snow out of the imagery. Those summer months are when outcrop can be seen and walked, so plan mapping and sampling for them, and do desk work, designation and the 30-day work-plan notice before.
Where can I download Quebec mining claim data?
The MRNF publishes active titles, open ground and other layers on its GESTIM digital data download page, in Shapefile, MapInfo and GeoPackage formats. SIGÉOM geoscience layers, including showings, are on Données Québec under CC BY 4.0.
Are satellite targets the same as lithium resources?
No. A satellite flag is an exploration indicator. A mineral resource needs drilling, assays and an estimate by a qualified person under NI 43-101. Nothing in this study is a resource or a reserve.
General information, not legal, tax or investment advice. Claim rules and fees change; confirm with the MRNF and, for work in Eeyou Istchee, the Cree Nation Government. Contains modified Copernicus Sentinel data. GESTIM data used under the MRNF digital data user agreement; it is not the official titles map. Farmonaut results are exploration targets ahead of any resource estimate.
Farmonaut mineral detection
Rank the exposed ground on your James Bay block
Send your claim boundary as KML, KMZ or a polygon. Farmonaut returns ranked satellite exploration targets for it, usually in 5 to 20 business days.

Keep reading
Sources
- MRNF, GESTIM digital data downloads, active titles file (13 October 2026): diffusion.mern.gouv.qc.ca
- MRNF, GESTIM mining titles management system (2026): gestim.mines.gouv.qc.ca
- Gouvernement du Québec, Procedure to obtain an exclusive exploration right (2026): quebec.ca
- Gouvernement du Québec, Rates and indexation, exclusive exploration rights (as of 15 July 2026): quebec.ca
- Gouvernement du Québec, Annual exploration work planning (2026): quebec.ca
- Gouvernement du Québec, Obligations of an exclusive exploration right holder (2026): quebec.ca
- Données Québec, SIGÉOM showings, deposits, mines and quarries (2026): donneesquebec.ca
- Données Québec, CC BY 4.0 licence: donneesquebec.ca
- Cree Nation Government, Cree Nation Mining Policy (June 2024): cngov.ca
- Cree Nation Government, Mining in Eeyou Istchee (2026): cngov.ca
- Environment and Climate Change Canada, Forest management and disturbances indicator (2023 data): canada.ca
- Natural Resources Canada, Lithium facts (2024 data): natural-resources.canada.ca
- European Space Agency, Sentinel-2 mission, SentiWiki (2026): sentiwiki.copernicus.eu
- Google Earth Engine, Harmonized Sentinel-2 MSI Level-2A collection: developers.google.com
- Cardoso-Fernandes, Teodoro and Lima, Remote sensing data in lithium (Li) exploration, IJAEOG (2019): doi.org
Discussion
Questions, corrections or field experience? Share them below. First-time comments are reviewed before they appear, and your email is never published.
No comments yet. Be the first to add a question or your experience.

 Berks Gold Limited
 Mwerezi Minerals Company Limited
 Congo Mining Solutions
 Mining SARL
 SenGold Invest SAS
 Sania Corporation
 Sean Mining Limited
 NTS Group (Pty) Ltd
 Mine4Africa
 Lithspo Minerals Limited
 Tintina Mining Group
 Dalgety Minerals Pty Ltd
 Vortex Minerals Pty Ltd
 Faith At Work (Pty) Ltd
 Geotech Mining Solutions plc
 Vulcan International Limited
 Kidepo Associates
