

Company data · Kainantu gold mine, Papua New Guinea
K92 Mining: Kainantu Output, Costs and Mine Life Data
K92 Mining produced 174,134 oz gold equivalent at Kainantu in 2025 and targets 190,000 to 225,000 oz in 2026. This page sets out output, grade, costs, resources, mine life and exploration from the company’s own filings, with a margin calculator.
Key takeaways
- K92 produced a record 174,134 oz AuEq in 2025 and 142,612 oz in the first nine months of 2026; guidance is 190,000 to 225,000 oz (K92, 8 October 2026).
- Gold feed grade fell from 10.7 g/t in Q3 2025 to 6.1 g/t in Q3 2026 while ore processed rose 82% (K92 Q3 2026 and Q2 2026 releases).
- All-in sustaining cost was US$1,308/oz gold in 2025 and US$1,376 in Q2 2026, against 2026 guidance of US$1,250 to US$1,350 (K92, 10 August 2026).
- The only mine-life case in K92’s filed technical report is the 7-year Stage 3 feasibility study, to 2030; the Stage 4 case that ran to 2037 was removed on 31 March 2025 (K92).
- David Medilek became chief executive on 1 October 2026; John Lewins is non-executive chair (K92, 17 August 2026).
In this article
- What Kainantu is and how it got here
- Output by quarter: more ore, lower grade
- Costs per ounce against guidance
- Reserves, resources and mine life
- Stage 3 and Stage 4: what the expansion changes
- Exploration: Kora, Judd and Arakompa
- Power, people and tax in PNG
- PNG gold in context
- Estimate recovered gold and margin for a K92-style ore feed
- Facts about the listing and leadership
- Frequently asked questions
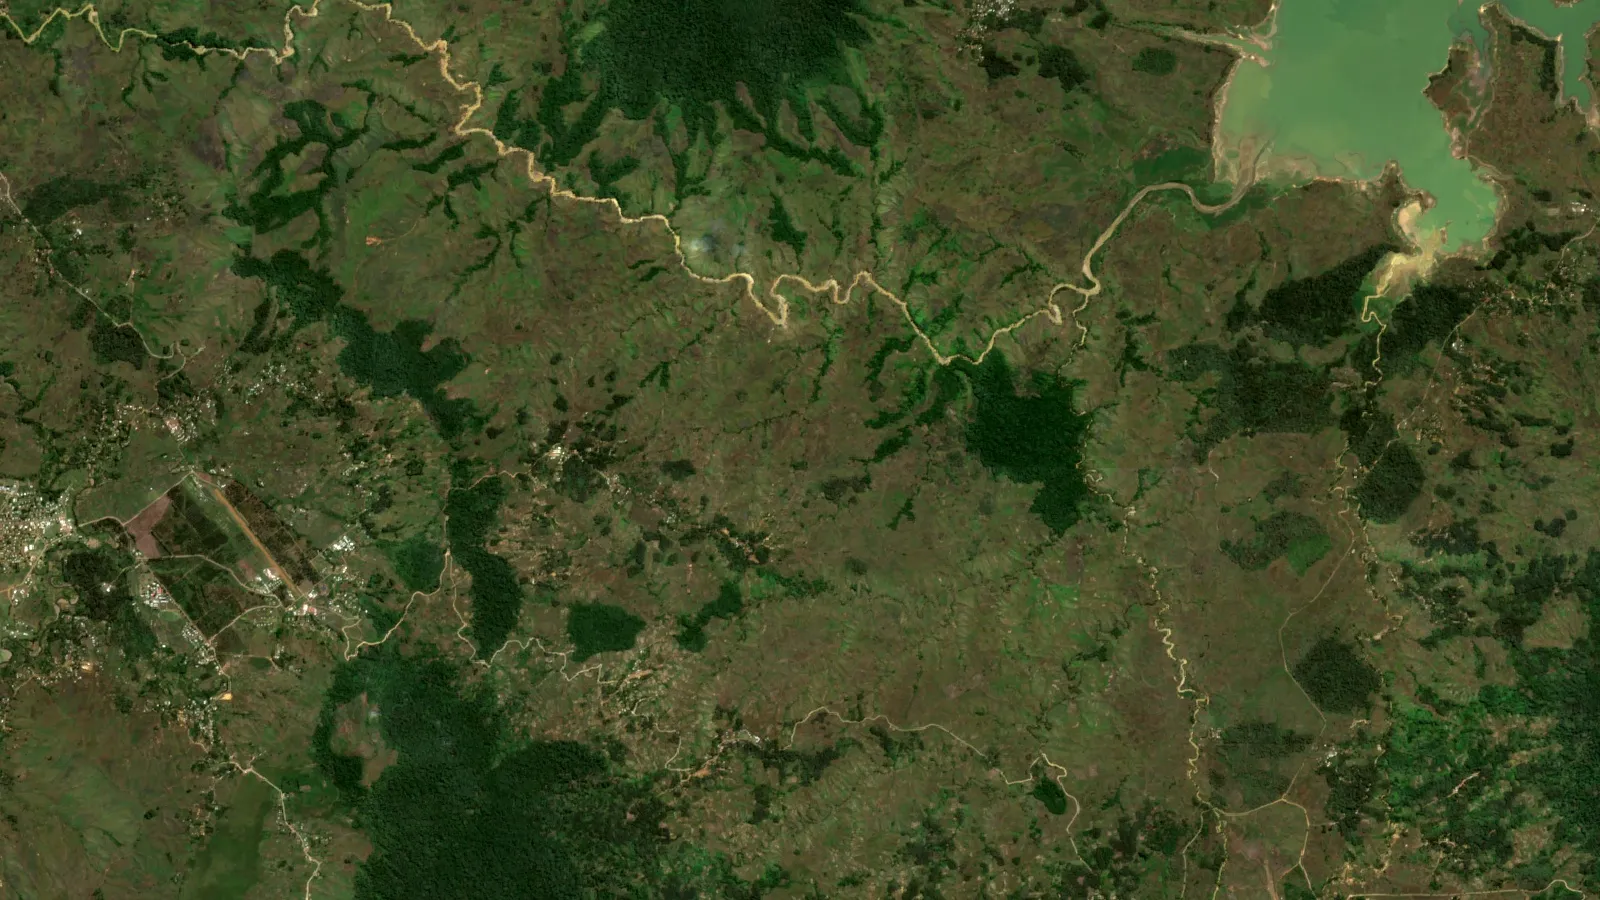
K92 Mining (TSX: KNT; OTCQX: KNTNF) runs one mine, Kainantu in the Eastern Highlands of Papua New Guinea (PNG). It produced a record 174,134 ounces of gold equivalent (AuEq) in 2025, and its 2026 target is 190,000 to 225,000 ounces (K92 results, 2 March 2026; K92 guidance, 26 January 2026). After nine months of 2026 it stands at 142,612 ounces, the sum of three quarterly releases. This page collects the company’s own filed figures in one place: output, grade, costs, resources, the expansion plan and the exploration pipeline. It gives no share price and no view on the stock.
Gold equivalent means copper and silver are converted to gold at the prices set in each release, so quarter-to-quarter comparisons move with the metal prices used. Where we say gold alone, the figure is ounces of gold.
What Kainantu is and how it got here
K92 bought the past-producing Kainantu mine from Barrick in 2015, restarted it in late 2016 and declared commercial production in February 2018 (K92, December 2020; K92, 17 August 2026). The turnaround came from the Kora North discovery in 2017, which earned the company the 2021 Thayer Lindsley Award from the Prospectors and Developers Association of Canada. Kainantu is an underground mine. It sells gold-copper-silver concentrate and also produces doré, and it mines the Kora and Judd vein systems.
Chart
Quarterly production, thousand ounces gold equivalent
Kainantu, Q2 2025 to Q3 2026
The company’s one-million-ounce milestone arrived in the third quarter of 2026: one million AuEq ounces produced since commercial production began in February 2018 (K92, 8 October 2026).
For scale, the 164,484 ounces of gold K92 produced in 2025 equal about 5.1 tonnes. The USGS estimates world mine production in 2025 at 3,300 tonnes, so Kainantu supplied roughly 0.16% of it (USGS Mineral Commodity Summaries 2026, gold; our arithmetic).
Output by quarter: more ore, lower grade
Quarterly output has climbed from 34,816 ounces AuEq in the second quarter of 2025 to 49,776 in the third quarter of 2026, which is the second-highest quarter on record. Q3 2026 came from 46,063 ounces of gold, 1.95 million pounds of copper and 55,746 ounces of silver.
Chart
Gold grade fed to the plant, g/t
Head grade, gold only, by quarter
The plant now takes much more rock. Ore processed reached a record 250,042 tonnes in Q3 2026, up 82% on Q3 2025, after the new 1.2 million tonnes-per-year Stage 3 plant finished commissioning in December 2025. But the gold grade fed to the plant fell from 10.7 g/t in Q3 2025 to 6.1 g/t in Q3 2026, so 82% more tonnes gave only about 9% more gold ounces (46,063 against 42,244) and 12% more AuEq ounces. The company says the grade is in line with, or moderately above, its latest resource model (K92 Q2 production release, 8 July 2026).
Gold recovery in the plant was 94.1% in Q3 2026, above the 92.6% assumed in the feasibility study for the tenth quarter running. K92 expects the fourth quarter to be the strongest of 2026, helped by a higher-grade mining sequence and a second and third mining front (the third delivered its first stope ore in September). To reach the low end of guidance it needs about 47,400 ounces in Q4, which is in line with recent quarters; the top end needs about 82,400, well above anything achieved so far. Those two figures are our arithmetic from the released numbers.
Costs per ounce against guidance
K92 reports costs two ways. The by-product basis nets copper and silver sales against the cost of producing gold, so the figure is per ounce of gold. The co-product basis spreads costs over all gold-equivalent ounces. In 2025 cash cost was US$695 per ounce of gold and all-in sustaining cost (AISC) was US$1,308, both better than the guidance ranges of US$710 to US$770 and US$1,460 to US$1,560.
Chart
Cost per ounce of gold, by-product basis
US$ per ounce, 2025 full year vs Q2 2026
Costs rose in 2026 while the mine was ramping up. Q2 2026 cash cost was US$859 per ounce of gold and AISC US$1,376 on the by-product basis, or US$1,045 and US$1,529 per ounce AuEq on the co-product basis (K92 Q2 2026 results, 10 August 2026). The 2026 guidance is US$710 to US$770 cash cost and US$1,250 to US$1,350 AISC per ounce of gold on the by-product basis. Q2 cash cost and AISC were both above those ranges.
Q2 2026 revenue was US$205.2 million and net income US$84.6 million, with US$349.4 million in cash and a US$310.0 million net cash position at 30 June 2026. Third-quarter financial results were still to be published when this page was updated; the company announced the call details on 9 October 2026.
If this topic matters to you, read Gold Detector Price in PNG: 8 Models Compared next.
Related reading on this site: Granny Smith Gold Mine: Output, Costs and Mine Life.
Reserves, resources and mine life
Resources and reserves are different measures. A resource is mineralised rock with reasonable prospects of eventual extraction; a reserve is the economically mineable part of the measured and indicated resource (CIM Definition Standards, 2014). K92’s last published Kora and Judd resource (effective 12 September 2023) put Kora at 2.3 million ounces AuEq measured and indicated plus 3.9 million inferred, and Judd at 0.35 million measured and indicated plus 0.56 million inferred (K92, 5 December 2023). The separate Blue Lake copper-gold porphyry holds an inferred resource of 686 million tonnes at 0.66 g/t AuEq, or 14.6 million ounces AuEq (effective 1 August 2022, restated in an amended technical report filed 31 March 2025 that replaced the 10.8 million ounce figure from the 2022 report), and it is still open at depth (K92, 31 March 2025). Blue Lake uses a different gold-equivalent formula and a 0.4 g/t cut-off, against 3 g/t for Kora and Judd, so the resource bars are not on one price basis.
Chart
Published resources, million ounces AuEq
Kora and Judd (effective 12 September 2023); Blue Lake (effective 1 August 2022, restated March 2025)
Inferred resources are the least certain category and, under the CIM standards, can only be used in preliminary economic studies.
K92’s Updated Integrated Development Plan of October 2024 set out two cases, a Stage 3 feasibility study and a Stage 4 preliminary economic assessment (K92, 16 October 2024). The company later filed an amended technical report on 31 March 2025 that removed the Stage 4 case, so only the Stage 3 feasibility study remains in the filed report (K92, 31 March 2025). The October 2024 figures were:
| Case | Plant size | Mine life | Average output at run-rate | Life-of-mine AISC (per oz gold) | After-tax NPV at 5%, US$1,900/oz gold |
|---|---|---|---|---|---|
| Stage 3, feasibility study | 1.2 Mt a year | 7 years, to 2030 | 303,000 oz AuEq a year (2027-2029) | US$665 | US$680 million |
| Stage 4, preliminary economic assessment (removed from the filed technical report on 31 March 2025) | 1.8 Mt a year | 14 years, to 2037 | 414,000 oz AuEq a year (2028-2034) | US$432 | US$2.3 billion |
The Stage 4 case was a preliminary study that included inferred resources. The Stage 4 expansion itself was approved by K92’s board on 6 December 2022 and is funded in the 2026 growth budget, but it has no filed economic study at present. Both cases were written at a US$1,900 gold price, far below the 2026 averages in K92’s own releases (US$4,561 per ounce in Q2 2026 for the gold-equivalent calculation), and costs have moved since.
Stage 3 and Stage 4: what the expansion changes
Stage 3 is a new 1.2 million tonnes-per-year plant, a tailings filtration plant and an underground pastefill plant, so that most tailings go back underground. As of 30 June 2026, 98% of Stage 3 capital was spent or committed and on budget. The pastefill circuit is due to be fully commissioned in the fourth quarter of 2026 (K92, Q3 2026).
Stage 4 means running the 0.6 million tonne Stage 2A plant and the new 1.2 million tonne Stage 3 plant together, 1.8 million tonnes a year, and mining the deposits through several fronts at once. For 2026 the company budgets US$100 to US$108 million of growth capital: US$25 to US$28 million for Stage 3 and US$75 to US$80 million for Stage 4 and accelerated items such as a 15.3 MW power plant, a 132 kV power line, haul roads and a port upgrade at Lae. The primary ventilation upgrade, which lifts airflow from about 350 to 600 cubic metres per second, was due to finish commissioning in the second half of October 2026.
If you are new to how a gold mine turns rock into metal, the video below follows a nugget through the stages every gold mine shares, from drilling to refining. Kainantu itself ships gold-copper concentrate and also produces doré.

▶ Follows a gold nugget from rock to ring: found, drilled, crushed, dissolved, melted and refined. · 5:27
Exploration: Kora, Judd and Arakompa
K92 plans US$31 to US$35 million of exploration in 2026, a record, with 14 drill rigs by the first quarter. The near-mine targets are Arakompa, Maniape and Judd North, plus new drilling at the Mati, Mesoan and Bona Creek veins, and regional drilling at Wera (K92 guidance).
Arakompa sits about 4.5 kilometres from the process plant. By 4 June 2026 the company had released 100 holes from its maiden surface programme, and all of them hit mineralisation. A near-surface zone on the AR1 vein is defined over about 300 metres of vertical extent and 400 metres of strike at a weighted 9.47 g/t AuEq over 4.32 metres true width (K92, 4 June 2026). K92’s 2023 release cites a historic Arakompa resource of 800,000 ounces at 9.0 g/t gold, and the company is targeting a maiden resource estimate in the second half of 2026 (K92, 10 August 2026). Until that estimate is published, the drill results are not ounces.
Exploration of this kind starts well before drilling. Satellite imagery cannot see gold, but it can map the iron staining, clay minerals and fault lines that hot fluids leave around a vein system, and teams use those maps to decide where to put the first holes. Farmonaut applies the same screening idea to a licence area as an exploration target map, ahead of any resource estimate. K92 has not said it uses that method.

▶ Explains how satellites map the rock around gold rather than the gold itself. · 4:25
Power, people and tax in PNG
The 2025 sustainability report, published 2 June 2026, reports about 2,150 employees and permanent contractors, around 91% of them PNG nationals, and US$161.8 million of purchases from PNG companies, 52% of total spend. It reports US$139.2 million of taxes and royalties paid or accrued in PNG and 918 days without a lost-time injury (K92, 2 June 2026). These are company-reported figures. The mine is supplied with hydroelectric power, and the company is working on a greenhouse-gas reduction target for 2030 through grid upgrades and solar engineering.
Any mine changes the land around it. The short clay animation below lists the seven main environmental impacts of mining in plain words.

▶ A plain-language claymation on the seven environmental impacts of mining. · 2:31
PNG gold in context
PNG’s Ministry of Mining classes Kainantu as a medium-scale gold-silver mine, alongside Simberi and Hidden Valley; the large mines are Lihir and Porgera (gold), Ok Tedi (copper-gold) and Ramu (nickel-cobalt). The same ministerial statement says national gold output fell from over 2 million ounces to about 1.3 million after Porgera closed in April 2020, and that Porgera was declared open on 22 December 2023 (PNG Ministry of Mining statement, 2024). It also notes that the Kainantu project won the 2021 Thayer Lindsley Award. The statement was published in March 2024, so the national figures are from that date.
Estimate recovered gold and margin for a K92-style ore feed
The calculator below is built for this page. Enter the ore you process, the head grade and the recovery, then your own gold price and cost per ounce. The starting values are round examples near K92’s Q3 2026 feed (250,042 tonnes at 6.1 g/t gold, 94.1% recovery), not forecasts.
Calculator
What is a quarter of ore worth at your gold price?
Enter your own tonnes, grade, recovery, gold price and cost per ounce.
- Gold value at your price (US$): $203,996,335
- Cost at your cost per ounce (US$): $63,465,526
- Gold value minus cost (US$): $140,530,808
Example values only, not K92 forecasts. Defaults are rounded from K92’s Q3 2026 feed (250,042 t at 6.1 g/t gold, 94.1% recovery). Prices and costs are inputs: example, use today’s price (US$ per ounce). K92’s reported AISC is net of copper and silver credits, so a gold-only margin against it is a rough guide.
Facts about the listing and leadership
K92 is listed on the Toronto Stock Exchange as KNT and trades over the counter in the United States as KNTNF on the OTCQX market. David Medilek became chief executive on 1 October 2026, succeeding John Lewins, who became non-executive chair; Chris Kinver became chief operating officer (K92, 17 August 2026). Trafigura buys K92’s concentrates under an offtake agreement that started on 1 January 2026, which the company says improved metal payabilities and charges against its earlier assumptions (K92, 16 October 2024). This page gives facts only and no buy or sell view.
Frequently asked questions
What does K92 Mining produce?
Gold, copper and silver from the Kainantu mine in PNG. In 2025 it produced 164,484 ounces of gold, 5.9 million pounds of copper and 159,309 ounces of silver (K92, 2 March 2026).
Where is the Kainantu mine?
In the Eastern Highlands province of Papua New Guinea. The processing plant is the reference point for nearby targets such as Arakompa, about 4.5 km away.
How much gold will K92 produce?
The guidance is 190,000 to 225,000 ounces AuEq. Production was 142,612 ounces after three quarters, and the company reiterated guidance on 8 October 2026.
What is K92’s all-in sustaining cost?
US$1,308 per ounce of gold for 2025 and US$1,376 in Q2 2026, both net of copper and silver credits. The 2026 guidance range is US$1,250 to US$1,350.
How long will the Kainantu mine last?
The Stage 3 feasibility study, the only case left in K92’s filed technical report, gives a seven-year life to 2030 from 1 January 2024. It rests on the 2023 resource estimate and will change as drilling adds ounces. The earlier Stage 4 case that ran to 2037 was removed from the filing in March 2025.
What is the difference between Stage 3 and Stage 4?
Stage 3 is a 1.2 million tonne-per-year plant now operating. Stage 4 is the planned 1.8 million tonne-per-year step, running the Stage 2A and Stage 3 plants together. It is board-approved and funded in the 2026 budget but has no filed economic study.
Who runs K92 Mining?
David Medilek is chief executive from 1 October 2026; John Lewins is non-executive chair.
Where does K92 stock trade?
On the TSX as KNT and on the OTCQX as KNTNF. This is not investment advice.
Can satellites find a deposit like Kainantu?
They cannot see gold, but they can map the alteration around vein systems to rank where to drill first. Drilling decides whether there is ore.
This page is for information only. It is not investment advice. It gives no share price, target or recommendation. Check the company’s filings on SEDAR+ before you decide anything.
Farmonaut mining
Map your own site from space
Mining consultants can order a satellite exploration target map for a licence area, ahead of any resource estimate.

Mining Pro sample view, synthetic data
Keep reading
Sources
- K92 Mining, 2025 Q4 and annual results (2 March 2026): k92mining.com
- K92 Mining, 2026 operational guidance (26 January 2026): k92mining.com
- K92 Mining, Q2 2026 production results (8 July 2026): bnnbloomberg.ca
- K92 Mining, Q2 2026 financial results (10 August 2026): k92mining.com
- K92 Mining, Q3 2026 production results (8 October 2026): k92mining.com
- K92 Mining, Updated Integrated Development Plan (16 October 2024): arc-dev.theglobeandmail.com
- K92 Mining, Kora and Judd resource update (5 December 2023): k92mining.com
- K92 Mining, Arakompa drilling results (4 June 2026): k92mining.com
- K92 Mining, 2025 Sustainability Report highlights (2 June 2026): k92mining.com
- K92 Mining, leadership succession (17 August 2026): k92mining.com
- K92 Mining, Thayer Lindsley Award for Kora North (December 2020): k92mining.com
- PNG Ministry of Mining, ministerial update on the mining sector (2024): mra.gov.pg
- USGS, Mineral Commodity Summaries 2026: Gold: pubs.usgs.gov
- CIM, Definition Standards for Mineral Resources and Mineral Reserves (2014): mrmr.cim.org
- K92 Mining, amended technical reports filed (31 March 2025): k92mining.com
Discussion
Questions, corrections or field experience? Share them below. First-time comments are reviewed before they appear, and your email is never published.
No comments yet. Be the first to add a question or your experience.

 Berks Gold Limited
 Mwerezi Minerals Company Limited
 Congo Mining Solutions
 Mining SARL
 SenGold Invest SAS
 Sania Corporation
 Sean Mining Limited
 NTS Group (Pty) Ltd
 Mine4Africa
 Lithspo Minerals Limited
 Tintina Mining Group
 Dalgety Minerals Pty Ltd
 Vortex Minerals Pty Ltd
 Faith At Work (Pty) Ltd
 Geotech Mining Solutions plc
 Vulcan International Limited
 Kidepo Associates

 Licence holder · Nigeria · Gold + lithium










