

Gold mine · Fact guide
Granny Smith Gold Mine: Output, Costs and Mine Life
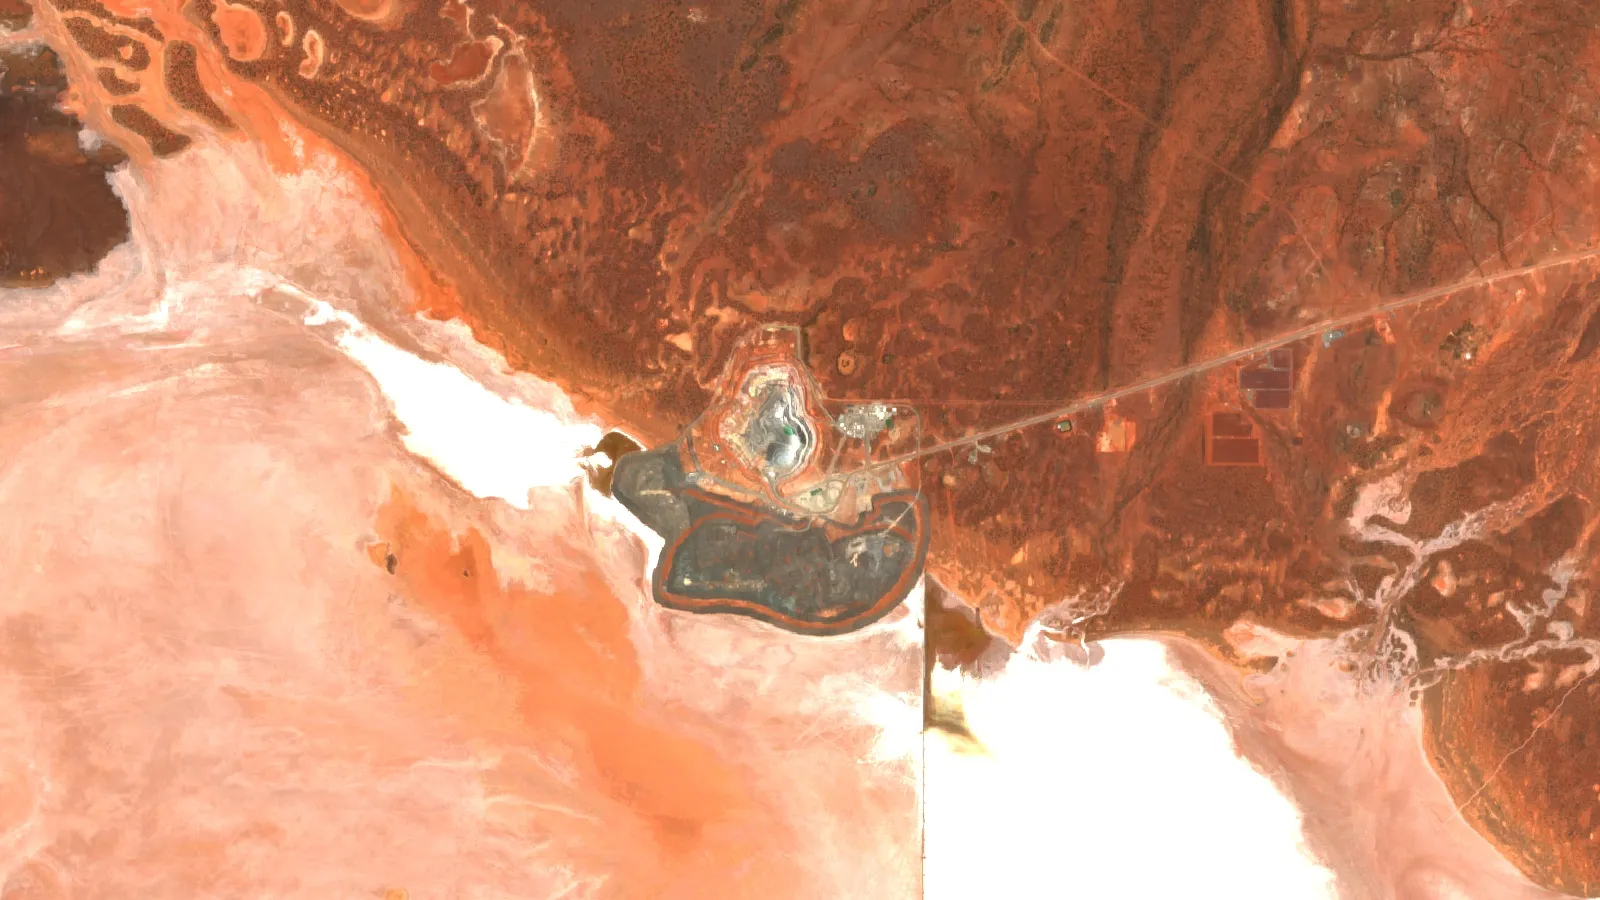
Granny Smith is Gold Fields’ underground gold mine in the Laverton district of Western Australia. It made 261,700 oz in 2025 at an all-in sustaining cost of A$2,337 per oz, with 2.58 million oz of reserves and a mine life to 2035.
Key takeaways
- Granny Smith produced 261,700 oz of gold in 2025, down 9% from 287,400 oz in 2024; H1 2026 output was 147,400 oz, up 10% on H1 2025, against a 2026 guide of 250,000 to 260,000 oz (Gold Fields).
- Proved and Probable Reserves were 12.4 Mt at 6.48 g/t for 2,579 koz at 31 December 2025, which supports an 11-year life of mine to 2035 (Gold Fields supplement).
- AISC was A$2,337 per oz in 2025 against A$1,779 in 2024. The 2026 guide is A$3,100 to A$3,300, while H1 2026 AISC was A$2,543 (Gold Fields, 25 August 2026).
- All ore comes from the Wallaby underground mine, where the deepest planned stopes in Zone 150 lie 1,500 m to 2,000 m below surface (Gold Fields supplement).
- A hybrid plant of gas, 19 MW of solar and an 11 MW battery supplies the site; the 11 MW solar addition was commissioned in Q2 2025 (Gold Fields; Aggreko).
In this article
- Granny Smith gold mine at a glance
- Where is Granny Smith mine located?
- Who owns Granny Smith and how its history ran
- How much gold does Granny Smith produce?
- How ore becomes gold at the mill
- What does it cost to produce an ounce at Granny Smith?
- How deep is the mine and how is the ore mined?
- Granny Smith reserves and resources explained
- What is changing at Granny Smith
- Power at Granny Smith: gas, solar and battery
- Environment, closure and tailings
- People and local benefit
- How Granny Smith compares with other Gold Fields mines in Western Australia
- How to look up Granny Smith in public records
Granny Smith gold mine at a glance
Granny Smith is an underground gold mine in the Laverton district of Western Australia, owned and run by Gold Fields. It produced 261,700 ounces of gold in 2025, down 9% from 287,400 ounces in 2024, at an all-in sustaining cost of A$2,337 per ounce (Gold Fields, reviewed results for 2025). Its Mineral Reserves stand at 2.58 million ounces at 6.48 grams of gold per tonne (g/t), enough for an 11-year life of mine to 2035 (Gold Fields Mineral Resources and Mineral Reserves Supplement, 31 December 2025).
This page uses Gold Fields’ own filings, not press summaries, so the figures can be traced. Where a number is a guide, a plan or a vendor claim, the text says so.
| Item | Latest figure | Basis and source |
|---|---|---|
| Owner and operator | Gold Fields, 100% | Held through GSM Mining Company Pty Ltd; Gold Fields supplement, 31 December 2025 |
| Mine type | Underground (Wallaby deposit) | Reserves contain no open pits; one open pit adds to resources only |
| Gold produced, 2025 | 261,700 oz (8,140 kg) | Gold Fields reviewed results, year to 31 December 2025 |
| Guidance for 2026 | 250,000 to 260,000 oz | AISC guide A$3,100 to A$3,300 per oz |
| Mineral Reserves | 12.4 Mt at 6.48 g/t, 2,579 koz | Proved and Probable, 31 December 2025 |
| Mill | 3.5 Mtpa, leach and carbon-in-pulp | Campaign milling; 94.7% plant recovery in 2025 |
| Mine life | 11 years to 2035 | Life of mine based on Mineral Reserves only |
Units used below: oz is a troy ounce (31.1035 grams), koz is a thousand ounces, Mt is a million tonnes and Mtpa is Mt per year. AISC means all-in sustaining cost, the cost to produce and sell an ounce including the capital needed to keep the mine running. AIC (all-in cost) adds growth capital.
Where is Granny Smith mine located?
The mine sits in the Laverton district of the Eastern Goldfields, about 400 km by road north-north-east of Kalgoorlie (roughly 225 km in a straight line), at latitude 28°51’S and longitude 122°18’E at an elevation of about 400 m (Gold Fields supplement). A 2020 report on its power plans placed it 20-odd km south of Laverton town (RenewEconomy, August 2020).
The climate is semi-arid. Gold Fields gives an average annual rainfall of 220 mm, with an average January maximum of 36°C and a June minimum of 4°C. Granny Smith controls exploration and mining rights over 72 tenements covering 68,240 hectares, of which about 55,348 ha are mineral tenements (the rest are miscellaneous and non-managed tenements).
Western Australia holds about 60% of Australia’s gold resources, and Geoscience Australia names Granny Smith among the primary-deposit mines in the state (Geoscience Australia, gold facts). Australia mined an estimated 280 tonnes of gold in 2025 against a world total of about 3,300 tonnes (USGS, Mineral Commodity Summaries 2026). Granny Smith’s 8.14 tonnes is about 2.9% of the Australian estimate (our calculation from the two reports; USGS figures are estimates and Gold Fields reports its own output).
Who owns Granny Smith and how its history ran
Gold Fields lists the Granny Smith and Goanna deposits as discovered in 1979, with open-pit mining starting in 1989. Barrick Gold took the operation through its purchase of Placer Dome in 2006, and Gold Fields acquired 100% in 2013 as part of the Yilgarn South asset package (Gold Fields supplement).
The Wallaby open pit produced 1.5 million ounces before it closed in 2006. Underground mining at Wallaby began in 2005 and has produced about 3.5 million ounces to date, so Wallaby is now the main source of ore. Gold Fields says exploration has added more than 5 million ounces of Mineral Reserves since 2013, which gives the mine its longest reserve life to date (Gold Fields Integrated Annual Report 2025).
How much gold does Granny Smith produce?
Gold Fields says the mine has produced just under 300,000 ounces a year in recent years. The actual figures were 284,000 oz in 2023, 287,000 oz in 2024 and 262,000 oz in 2025. The 2025 fall followed the business plan: less ore was mined and milled, partly offset by a higher grade.
Chart
Gold produced each year
Thousand ounces (koz); H1 2026 covers six months only; the 2026 guide bar is the midpoint of 250 to 260 koz
| Operating statistic | 2023 | 2024 | 2025 |
|---|---|---|---|
| Ore mined (kt) | 1,760 | 1,566 | 1,398 |
| Mined grade (g/t) | 5.4 | 6.1 | 6.3 |
| Ore milled (kt) | 1,765 | 1,571 | 1,342 |
| Head grade (g/t) | 5.4 | 6.1 | 6.38 |
| Yield (g/t) | 5.0 | 5.7 | 6.07 |
| Plant recovery (%) | 92.8 | 93.8 | 94.7 |
| Gold produced (koz) | 284 | 287 | 262 |
Head grade is the grade of ore going into the mill. Yield is the grams of gold actually recovered per tonne milled, and recovery is the share of the contained gold that the plant captures (Gold Fields supplement, annual operating statistics). Higher grade and recovery let the mine make 262,000 oz from 24% less milled ore than in 2023.
Gold Fields’ guidance for 2026 is 250,000 to 260,000 ounces (Gold Fields, reviewed results for 2025). A guide is a company plan, not a result.
In the first half of 2026 (six months to 30 June) the mine produced 147,400 oz, up 10% from 133,800 oz in H1 2025, on a 9% rise in ore processed. Yield was 5.95 g/t against 5.90 g/t (Gold Fields, H1 2026 results, 25 August 2026). Half-year figures are not an annual forecast.
How ore becomes gold at the mill
Ore leaves the Wallaby decline portal by road and goes to a mill about 15 km north-east of the mine. The plant crushes and grinds the rock, dissolves the gold in a cyanide solution (leaching) and captures it on activated carbon (carbon-in-pulp, or CIP). It runs in campaigns, meaning batches of ore from different areas are processed in blocks, at a capacity of 3.5 Mtpa.
Tailings, the crushed rock left after the gold is removed, are stored in one tailings storage facility of four cells. Cells 3 and 4 together hold about 14.11 Mt of life-of-mine capacity against a planned 11.3 Mt of tailings, according to the Gold Fields supplement. The company reports that the International Cyanide Management Code recertification was completed in 2022.
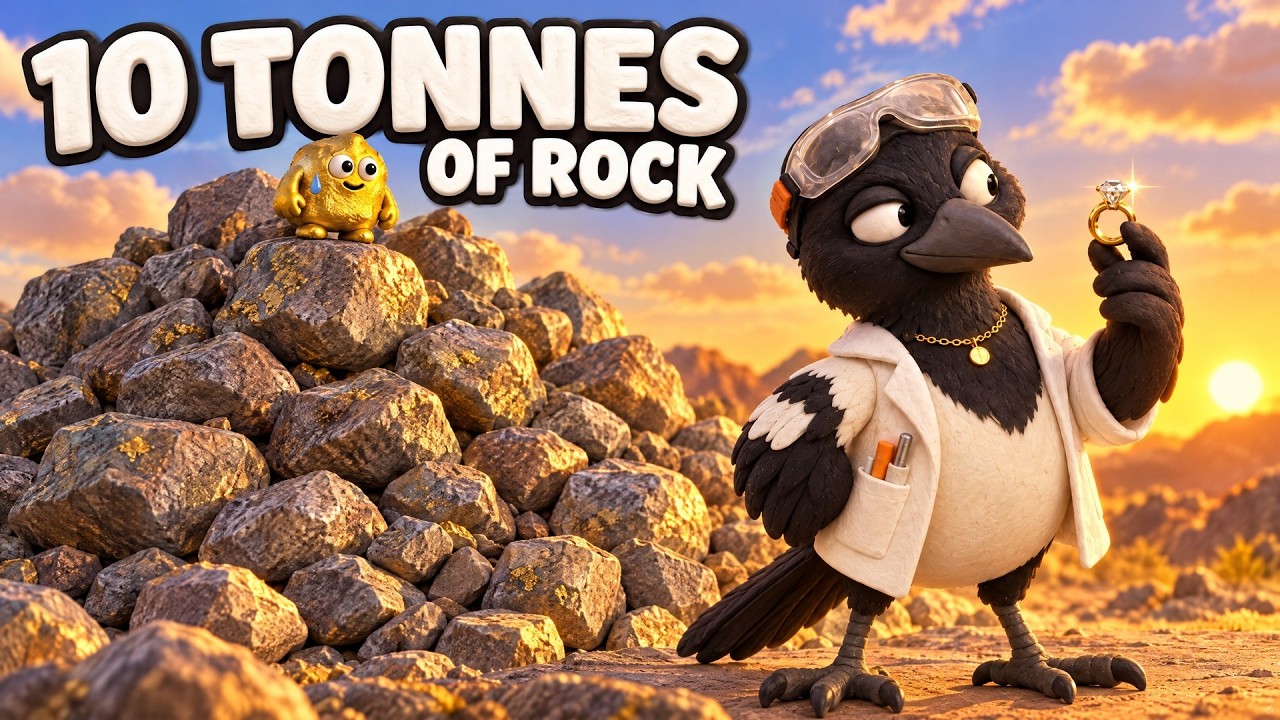
▶ Follows a gold nugget from rock to ring: drilling, crushing, dissolving, carbon capture, melting and refining. · 5:27
What does it cost to produce an ounce at Granny Smith?
Costs rose sharply in 2025. AISC was A$2,337 per ounce (US$1,506) against A$1,779 in 2024, a 31% rise in Australian dollars. All-in cost was A$2,427 per ounce, up from A$1,925. Gold Fields puts the AIC rise down to lower gold sold, higher cost of sales and more capital spending, which grew 55% to A$190 million for underground development and a new fresh-air intake system (Gold Fields, reviewed results for 2025).
Chart
Gold price received against all-in cost
A$ per ounce, Granny Smith, annual
The gold price rose faster. Gold Fields received an average US$3,619 per ounce in 2025 (A$5,323), against US$2,437 (A$3,696) in 2024. Adjusted pre-tax cash flow at the mine rose 87% to A$850 million. The 2026 guide is for AISC of A$3,100 to A$3,300 per ounce and AIC of A$3,450 to A$3,650 on lower output, so the guide points to higher cost per ounce than in 2025. The first half of 2026 came in lower: AISC was A$2,543 per ounce (US$1,787), up 7% from A$2,374 in H1 2025, and AIC was A$2,585 (US$1,816). Adjusted pre-tax cash flow for the half was A$583 million, up 50% (Gold Fields, H1 2026 results, 25 August 2026).
The gap between the price received and AIC is arithmetic, not profit: it ignores tax, corporate costs and financing.
How deep is the mine and how is the ore mined?
The gold sits in the Wallaby system, which Gold Fields describes as an orogenic gold deposit: gold in quartz-carbonate veins and sulphide-altered rock, hosted by basalt and intrusive rocks and controlled by fractures and shear zones. Geoscience Australia explains that most gold is concentrated by hot fluids moving through the crust, which deposit it in cracks as they cool or react with the rock (Geoscience Australia, gold facts).
Wallaby is reached by declines (sloping tunnels). Mining methods are room and pillar, bulk stopes and long-hole open stoping, with paste fill. A stope is the excavated void left after ore is removed, and paste fill is a paste made mostly from tailings that is pumped back into the void to support the surrounding rock. The Zone 150 stopes are the deepest in the plan, between 1,500 m and 2,000 m below surface. Gold Fields plans to paste-fill all stopes in Zones 135 and 150. For the wider picture of how gold is mined from the surface and underground, see our guide to surface mining methods for gold.
Depth brings risk. Gold Fields names seismicity (rock movement caused by mining stress) as a key issue and uses a Geotechnical Review Board to guide design and sequencing. It also says regional stability pillars may need to be larger, and that deeper mining reduces flexibility and raises cost. Ventilation and cooling upgrades are planned for the lower mine.
Related reading on this site: Pinto Valley Mine: Output, Water Limits, Mine Life.
We cover a connected topic in Cripple Creek Gold Mine: Output, Reserves, Costs.
Granny Smith reserves and resources explained
A Mineral Resource is mineralisation that has reasonable prospects of being mined. A Mineral Reserve is the part of the Measured and Indicated resource that is economically mineable once mining, processing and cost factors are applied. Gold Fields reports its resources in addition to reserves, a basis called exclusive Mineral Resources (EMR), so the figures below should be added, not compared as subsets.
Chart
Reserves and resources a year apart
Thousand ounces of gold (koz); resources are reported in addition to reserves
| Category (31 December 2025) | Tonnes (Mt) | Grade (g/t) | Gold (koz) |
|---|---|---|---|
| Proved and Probable Reserves | 12.4 | 6.48 | 2,579 |
| Measured and Indicated Resources (EMR) | 19.9 | 4.37 | 2,796 |
| Inferred Resources (EMR) | 11.4 | 4.90 | 1,793 |
Reserves rose from 2,389 koz a year earlier. Gold Fields credits the move mainly to the conversion of resources to reserves at Zone 150 (+314 koz). The reserve cut-off grades are 2.6 to 3.3 g/t for underground ore, mining recovery is 90 to 92% and dilution is 12 to 20%. The reserve assumes metallurgical recovery of 90.3 to 91.1%, more cautious than the 94.7% the plant achieved in 2025.
The reserve is not very sensitive to the gold price. Across a plus or minus 15% price range, contained reserve ounces move only between 2,551 and 2,584 koz. In metric terms the reserve is about 80 tonnes of contained gold (2,579,000 oz x 31.1035 g/oz).
Gold Fields’ medium-term goals for the mine are an average output above 275,000 ounces a year over 15 years and a Mineral Reserve base of about 2.5 million ounces (Gold Fields Integrated Annual Report 2025). These are goals, not forecasts. The current reserve-based life of mine is 11 years.
What is changing at Granny Smith
These seven items come from Gold Fields’ own reporting. Each is either done or a stated plan, and the list says which.
- Zone 150 development. The feasibility study for Zone 150 was nearing completion in the 2025 results, with independent peer review expected from Q1 2026 and development anticipated to begin in H2 2026 (plan as stated in February 2026; the H1 2026 results of 25 August 2026 give no Zone 150 update). Zone 160 is still in exploration drilling.
- Ventilation and cooling. Spending in 2025 went into a new fresh-air intake system for the Zone 135 and Zone 150 levels, with cooled air supply and primary ventilation upgrades planned.
- A Wallaby material handling system. A prefeasibility study is under way, with the feasibility study to start in H2 2026. Gold Fields says it aims to reduce diesel use and emissions by moving ore from the deeper zones without as many trucks.
- Autonomous haulage. Gold Fields lists implementing autonomous haulage and material handling systems for lower-cost extraction as a performance enabler. Gold Fields’ H1 2026 results (25 August 2026) credit record autonomous truck performance for a 10% rise in half-year output at Granny Smith, so autonomous trucks are already in use; the wider materials-handling plan is still a plan.
- Solar power. An 11 MW solar plant was commissioned in Q2 2025 and ran at full capacity in Q3 2025.
- Open-pit ore. Studies are planned that could start open-pit mining within five years, to use spare mill capacity.
- Native title agreement. Gold Fields signed an agreement with the Wangkatja Tjungula Aboriginal Corporation for the Nyalpa Pirniku native title holders in December 2025, covering compensation, heritage management and access.
Sources: Gold Fields supplement and Integrated Annual Report 2025.
Power at Granny Smith: gas, solar and battery
The site moved from diesel to gas after a gas pipeline was built in 2016. Aggreko, the power company that builds and runs the plant, describes a 75 MW hybrid system under a 15-year power purchase agreement that supplies all of the site’s power: 40 MW of gas, 5 MW of diesel, a 19 MW solar farm and an 11 MW battery with 11 MWh of storage. Aggreko estimates emissions savings of about 23,803 tonnes of CO2-equivalent a year (Aggreko case study). This is a vendor figure.
In 2020 the plant had 8 MW of solar, a battery and 24.2 MW of gas generation. The 11 MW addition commissioned in Q2 2025 brings solar to 19 MW. Gold Fields lists a review of renewable projects of around 50 MW as a medium-term enabler.
Environment, closure and tailings
Granny Smith kept its ISO 14001 (environment), ISO 45001 (safety) and ISO 27001 (information security) certifications. Gold Fields estimates total closure costs at US$90.6 million: US$4.0 million for progressive rehabilitation and US$71.4 million for closure after the reserve is mined, backed by a rehabilitation trust of about US$15.2 million. Gold Fields includes the closure cost in its reserve economics.
Tailings cell 2 is full and is harvested for paste fill, and cell 1 is kept for contingency storage. Cell 3 was raised in March 2022 and cell 4 was completed in July 2023. Gold Fields reported US$8 million of savings in 2025 from aligning tailings dam design to the Global Industry Standard on Tailings Management (GISTM).
People and local benefit
The headcount in the Gold Fields annual report page for the mine is 590 employees and 264 contractors in 2024, with 16% of employees women (Gold Fields Integrated Annual Report 2024). The 2025 native title agreement described above covers compensation, heritage management and access provisions.
How Granny Smith compares with other Gold Fields mines in Western Australia
Gold Fields runs four mines in Western Australia: Gruyere, Granny Smith, St Ives and Agnew. Granny Smith had the second-highest yield of the four and the largest rise in AISC in 2025 (31%), because the cost of deeper mining grew while output fell.
Chart
Gold yield at Gold Fields’ Western Australian mines, 2025
Grams of gold recovered per tonne milled (g/t)
| Mine | Style | Gold produced 2025 (koz) | Yield 2025 (g/t) | AISC 2025 (A$/oz) |
|---|---|---|---|---|
| St Ives | Underground and surface | 369.6 | 2.53 | 2,589 |
| Granny Smith | Underground | 261.7 | 6.07 | 2,337 |
| Agnew | Underground | 245.3 | 6.37 | 2,225 |
| Gruyere | Open pit | 295.6 | 0.96 | 3,150 |
Source: Gold Fields reviewed results for 2025. Gruyere’s reporting basis changed in 2025, when Gold Fields acquired Gold Road, its joint-venture partner, on 26 September 2025, so read its production against the basis in the report. Yield is grams per tonne milled, so a higher number means richer ore.
How to look up Granny Smith in public records
- Start with Gold Fields’ reports. The annual Mineral Resources and Mineral Reserves supplement holds the reserve table, cut-off grades, recovery and a mine description. The reviewed results give production and cost each quarter and each year.
- Search MINEDEX. The Western Australian government database lists mining and exploration sites with status, location, resource estimates and production. Searching is by text, with no login or registration required (Government of Western Australia, MINEDEX).
- Map it in GeoVIEW.WA. MINEDEX points can be viewed on the state’s geological map system, together with tenements and geology layers.
- Read the exploration reports. Company reports lodged with the regulator are collected in WAMEX, the mineral exploration report system (Government of Western Australia, WAMEX).
- Check Geoscience Australia. Its national commodity summaries put gold resources at 12,955 tonnes of economic demonstrated resources at 31 December 2024, with 141 operating gold mines and 284 tonnes of 2024 production (Geoscience Australia, Australia’s Identified Mineral Resources 2025).
The same steps work for other Western Australian gold projects. For a view of exploration across states, see gold exploration in Australia by state. For a comparable greenstone belt in Canada, see the Abitibi greenstone belt.

▶ Shows how to read the Western Australian public maps and databases, including GeoVIEW.WA, WAMEX and MINEDEX. · 4:13
Mill output and margin calculator
Use the calculator below with your own numbers to see how ore tonnes, grade and recovery turn into ounces, and how a price and cost per ounce change the margin. The default values are round examples, not Granny Smith’s results.
Calculator
What do ore, grade and recovery turn into?
Enter your own ore tonnes, grade, recovery, price and cost.
- Revenue at your price (A$ million): 1,179 A$m
- Cost at your AISC (A$ million): 707 A$m
- Margin before tax (A$ million): 471 A$m
- Yield per tonne milled: 5.64 g/t
Example values only, not Granny Smith’s results or a forecast. Price is an input: example, use today’s price (A$ per ounce). AISC is an input read from a company report. The margin ignores tax, corporate costs, financing and the difference between ounces produced and sold.
What satellites can and cannot show at an underground gold mine
A satellite cannot see ore 1,500 m underground, and it cannot see gold. What it can map is the rock at the surface: iron-oxide staining, clay and mica minerals, silica and long straight fracture lines, which are clues to the structures that guide gold. For a site like Wallaby, drilling and underground sampling define the ore. Satellites are most useful at the start of a search, when a licence holder wants to rank large areas before sending drill rigs, or later for tracking surface changes such as tailings footprint and rehabilitation. Farmonaut works from a KML, KMZ or polygon of your licence area and returns an exploration target report. These are targets ahead of a resource estimate, not a resource under JORC or NI 43-101.
Operators that report emissions, run vehicle fleets or document the origin of gold can also look at Farmonaut’s pages on carbon footprinting, fleet management and product traceability.

▶ Explains that satellites map the rock and alteration around gold rather than the gold itself. · 4:25
Frequently asked questions
Where is the Granny Smith gold mine?
It is in the Laverton district of the Eastern Goldfields, Western Australia, about 400 km by road north-north-east of Kalgoorlie (roughly 225 km in a straight line) at 28°51’S, 122°18’E, according to Gold Fields. A 2020 news report put it 20-odd km south of Laverton town.
Who owns the Granny Smith mine?
Gold Fields owns 100% through its subsidiary GSM Mining Company Pty Ltd. It acquired the mine in 2013 as part of the Yilgarn South asset package. Barrick Gold had owned it since buying Placer Dome in 2006.
How much gold does Granny Smith produce a year?
It produced 261,700 oz in 2025, 287,400 oz in 2024 and about 284,000 oz in 2023. Gold Fields guides to 250,000 to 260,000 oz for 2026.
Is Granny Smith an open pit or an underground mine?
Underground. The Wallaby underground mine supplies the ore, and the Wallaby open pit closed in 2006 after producing 1.5 million ounces. Studies could bring open-pit ore back within five years to use spare mill capacity.
How deep is the Granny Smith mine?
The deepest planned stopes in Zone 150 are between 1,500 m and 2,000 m below the surface. Drilling has also crossed the Zone 160 lode deeper still, but mining below Zone 150 needs further study.
How long will Granny Smith keep operating?
The reserve-based life of mine is 11 years, to 2035. Gold Fields has a goal of keeping output above 275,000 oz a year for 15 years, which depends on converting more resources to reserves.
How much gold is left at Granny Smith?
At 31 December 2025, Proved and Probable Reserves were 2,579 koz. Additional Measured and Indicated Resources were 2,796 koz and Inferred Resources 1,793 koz, reported in addition to reserves. Resources are less certain than reserves and may not convert.
What does it cost to mine an ounce of gold at Granny Smith?
The 2025 AISC was A$2,337 per ounce (US$1,506) and AIC was A$2,427 (US$1,564). The 2026 guide is A$3,100 to A$3,300 AISC.
Does Granny Smith use solar power?
Yes. An 11 MW solar plant was commissioned in Q2 2025, bringing solar to 19 MW. It sits in a 75 MW hybrid system with gas, diesel and a battery run by Aggreko.
What type of gold deposit is Wallaby?
Gold Fields classes it as an orogenic gold system, with gold in quartz-carbonate veins and sulphide-altered rock, controlled by fractures and shear zones in basalt and intrusive rocks.
How many people work at Granny Smith?
Gold Fields reported 590 employees and 264 contractors in its 2024 annual report for the mine.
Where can I find official data on the mine and its tenements?
Start with Gold Fields’ annual supplement and quarterly results. For government records use MINEDEX, GeoVIEW.WA and WAMEX from the Western Australian government.
This page is for information only. It is not investment advice. It gives no share prices or targets, and company guidance is a plan, not a result. Check Gold Fields’ own reports before you rely on any figure.
Farmonaut mining
Map your mining site from space
Consultants can send a KML, KMZ or polygon of a licence area and get a satellite-based exploration target report, ahead of any resource estimate.

Mining Pro sample view, synthetic data
Keep reading
Sources
- Gold Fields, Mineral Resources and Mineral Reserves Supplement to the Integrated Annual Report 2025: goldfields.com
- Gold Fields, Reviewed Results for the year ended 31 December 2025: review of operations: goldfields.com
- Gold Fields, Integrated Annual Report 2025: goldfields.com
- Gold Fields, Integrated Annual Report 2024: Granny Smith: goldfields.com
- Aggreko, one of the world’s largest renewable microgrids powers a remote gold mine: aggreko.com
- RenewEconomy, Gold Fields eyes wind energy bolt-on at Granny Smith mine (August 2020): reneweconomy.com.au
- Government of Western Australia, Access Mines and Mineral Deposits (MINEDEX): wa.gov.au
- Government of Western Australia, Access Mineral exploration reports (WAMEX): dmp.wa.gov.au
- Geoscience Australia, Gold (Australian mineral facts): ga.gov.au
- Geoscience Australia, Australia’s Identified Mineral Resources 2025: commodity summaries: ga.gov.au
- USGS, Mineral Commodity Summaries 2026: Gold: pubs.usgs.gov
- Gold Fields, H1 2026 results booklet (25 August 2026): goldfields.com
Discussion
Questions, corrections or field experience? Share them below. First-time comments are reviewed before they appear, and your email is never published.
No comments yet. Be the first to add a question or your experience.

 Mulopwe Metals Mining Ltd
 Tintina Mining Group
 Dalgety Minerals Pty Ltd
 Vortex Minerals Pty Ltd
 Faith At Work (Pty) Ltd
 Geotech Mining Solutions plc
 Vulcan International Limited
 Kidepo Associates
 GKY Mining
 Alkimy SARL
 Double A Trading
 GemSprout Metals Limited
 Qader Group
 Ileys General Trading
 SG Gold Mining LLC
 VRV Global Pte Ltd
 Omsri International FZE
 G.I.T.T.
 Jaunita Erss Ltd
 Almosi SARL
 SRK Consulting
 Berks Gold Limited
 Mwerezi Minerals Company Limited
