

Silver · Company comparison
Wheaton vs Pan American Silver: Output, Costs, Risk
Wheaton Precious Metals and Pan American Silver produced about 22.4 and 22.8 million ounces of silver in 2025, but Wheaton streams metal from other mines while Pan American runs its own. Dated company figures, side by side.
Key takeaways
- 2025 attributable silver: Pan American 22.84 Moz, Wheaton 22.43 Moz; gold 742 koz against 416 koz (company releases, January and February 2026).
- 2026 guidance: Wheaton 27 to 29 Moz of silver and 860,000 to 940,000 gold equivalent ounces; Pan American 25 to 27 Moz of silver and 700 to 750 koz of gold.
- Full-year 2025: Wheaton revenue US$2.3 billion and net earnings US$1.5 billion; Pan American revenue US$3.6 billion and net earnings US$980 million.
- Cost measures differ: Wheaton reports cash cost per gold equivalent ounce (US$568 in Q2 2026); Pan American reports all-in sustaining cost (US$17.80 per silver ounce in Q2 2026).
- Pan American reserves at 30 June 2026: about 511.1 Moz of silver and 6.3 Moz of gold (company release, 16 September 2026).
In this article
- Wheaton Precious Metals vs Pan American Silver at a glance
- Streaming company vs silver miner: how each one makes money
- Silver and gold output compared
- Revenue, earnings and dividends
- Costs and margins: cash cost per ounce vs all-in sustaining cost
- Where the metal comes from: key assets
- Pan American Silver reserves and growth projects
- Risks on each side
- How to compare precious metals companies listed in the USA
- Environment and stewardship
- Where satellite data fits: screening ground before you commit
- Frequently asked questions
Wheaton Precious Metals and Pan American Silver produced almost the same amount of silver in 2025 (22.4 and 22.8 million troy ounces, attributable), but they earn it in opposite ways: Wheaton buys a share of other companies’ metal under streaming contracts, while Pan American digs up its own. Pan American also produced about 742,000 ounces of gold in 2025, about 1.8 times Wheaton’s 416,000, so it is no longer a silver-only miner. This page sets the two side by side with dated company figures, so a consultant, investor or business owner can see what each model means for output, costs, reserves and risk.
All figures come from the companies’ own releases and filings, plus USGS and Silver Institute data, and each carries its date. “Attributable” means the company’s ownership or contract share, not the whole mine. Prices quoted are the companies’ planning assumptions, not today’s market price. This is information only, not investment advice.
Wheaton Precious Metals vs Pan American Silver at a glance
The table below lines up the numbers most readers ask for. Moz means million troy ounces; koz means thousand ounces. Pan American reports gold and silver production by ownership share, and Wheaton reports the metal delivered under its contracts.
| Measure | Wheaton Precious Metals | Pan American Silver |
|---|---|---|
| Business model | Streaming and royalties on mines run by others | Owns and operates mines |
| Listings | NYSE, TSX and London Stock Exchange (Wheaton Q2 2026 results) | NYSE and TSX, ticker PAAS |
| Asset count (Aug 2026) | 22 operating mines, 20 development and 15 exploration or other projects | Mines in Mexico, Peru, Argentina, Bolivia, Brazil, Chile and Canada (11 producing sites in the 2026 outlook) |
| Silver produced, 2025 | 22.4 Moz | 22.8 Moz |
| Gold produced, 2025 | 416 koz | 742 koz |
| Silver guidance, 2026 | 27 to 29 Moz | 25 to 27 Moz |
| Gold guidance, 2026 | 400 to 430 koz | 700 to 750 koz |
| Revenue, full year 2025 | US$2.3 billion | US$3.6 billion |
| Net earnings, full year 2025 | US$1.5 billion | US$980 million |
| Quarterly dividend declared with Q2 2026 results | US$0.195 per share | US$0.184 per share |
Sources: Wheaton’s production and guidance release (16 February 2026), its second-quarter 2026 results (6 August 2026), and Pan American’s production and guidance release (20 January 2026), full-year 2025 results and second-quarter 2026 results (12 August 2026). Revenue is as reported, not attributable. Pan American now expects 2026 gold production at the low end of its 700 to 750 koz range (second-quarter 2026 release).
Streaming company vs silver miner: how each one makes money
A streaming agreement (Wheaton calls it a precious metals purchase agreement) works like this. The streamer pays a mine owner a large sum up front. In return it gets the right to buy a set share of the mine’s future gold or silver, and it pays only a small, pre-agreed price per ounce on delivery, then sells the metal at the market price. The mine owner uses the cash to build or expand. Wheaton reported that fixed per-ounce payments applied to the majority of its operating streams, which made up 80% of its fourth-quarter 2025 revenue (Wheaton, 12 March 2026).
A primary producer such as Pan American owns the ground, drills, mines, mills and sells. It keeps the whole margin when prices rise, but pays for labour, power, royalties, taxes and sustaining capital, and it carries the risk of a strike, a flood or a falling ore grade. In its second-quarter 2026 release Pan American said higher metal prices raised its royalties and labour-related costs, and that it expected to pay between US$585 million and US$635 million in tax in 2026 (Pan American, 12 August 2026).
Two terms matter when you read their reports:
- Gold equivalent ounce (GEO). Wheaton converts its silver, palladium, platinum and cobalt into gold-equivalent ounces using fixed price assumptions. For 2026 it used US$4,800 per ounce of gold and US$80 per ounce of silver. Because the assumptions change, GEO totals for different years are not directly comparable unless restated.
- All-in sustaining cost (AISC). Pan American reports AISC per ounce, which adds mining, processing, royalties, sustaining capital and overhead, less credits from by-product metals. Wheaton reports cash cost per GEO, which is mostly the fixed price it pays the mine. The two numbers measure different things, so never subtract one from the other.
Silver and gold output compared
On 2025 attributable output the two are level in silver. Pan American reported 22.84 Moz of silver and 742.2 koz of gold, including 2.49 Moz of silver from its 44% share of the Juanicipio mine in Mexico after it completed the acquisition of MAG Silver on 4 September 2025. Wheaton reported 22.43 Moz of silver and 416,286 ounces of gold. For scale, USGS estimates world mine production of silver at 26,000 tonnes in 2025, about 836 Moz; each company’s silver is about 2.7% of that (22.4 or 22.8 Moz divided by 836 Moz) (USGS, Mineral Commodity Summaries 2026).
Chart
Attributable gold produced in 2025
Thousand troy ounces
Chart
Attributable silver: 2025 actual and 2026 guidance midpoint
Million troy ounces; midpoint of each company’s guidance range
For 2026, Wheaton guided to 27 to 29 Moz of silver and Pan American to 25 to 27 Moz. Wheaton’s rise comes mainly from the additional silver stream at the Antamina mine in Peru. The Silver Institute expects primary silver mines to supply 28% of world silver mine output in 2026, with the rest coming mainly as a by-product of other mining (Silver Institute, 10 February 2026). Both companies are exposed to that by-product pattern: Wheaton’s stream mines include copper and zinc operations, and Pan American’s gold mines add silver.
▶ Follows gold from rock to refined metal, the path behind Pan American’s gold output. · 5:27
Revenue, earnings and dividends
Pan American is the bigger business by reported revenue, US$3.6 billion against Wheaton’s US$2.3 billion for 2025. Wheaton kept more of it: its net earnings of US$1.47 billion were about 64% of its US$2.31 billion revenue, against about 27% for Pan American’s US$980 million on US$3.6 billion. A streamer pays only a fixed price per ounce and carries no mining or processing costs, so a wider margin is expected. Wheaton also declared record dividends of US$0.66 per share for 2025 (Wheaton, 12 March 2026).
Chart
Full-year 2025 revenue and net earnings
US$ million as reported (Pan American revenue rounded to US$0.1 billion)
In the second quarter of 2026, Wheaton reported revenue of US$929 million, net earnings of US$543 million and operating cash flow of US$650 million. Pan American reported revenue of US$1.1 billion, net earnings of US$305 million and attributable cash flow after capital spending of US$344 million, and returned a record US$300 million to shareholders through dividends and share buybacks (Pan American Form 6-K, 12 August 2026). Wheaton’s cash balance was US$100 million after it paid US$4.3 billion for the BHP share of the Antamina silver stream, leaving net debt of US$1.9 billion. Pan American held US$1.8 billion in cash and investments and US$841 million of total debt.
Costs and margins: cash cost per ounce vs all-in sustaining cost
Wheaton’s average cash cost in the second quarter of 2026 was US$568 per GEO, against an average realized price that left a cash operating margin of US$3,875 per GEO sold. In 2025 the figures were US$514 and US$3,040. Pan American guided 2026 silver-segment AISC of US$15.75 to US$18.25 per silver ounce and gold-segment AISC of US$1,700 to US$1,850 per gold ounce, built on planning prices of US$70 silver and US$4,200 gold. In the second quarter its actual AISC was US$17.80 per silver ounce and US$1,984 per gold ounce.
The calculator below shows why the two models react differently to a price fall. Enter your own numbers: it compares a stream paying a fixed price per ounce with a mine carrying an all-in cost, before the stream’s upfront payment and before the miner’s income tax.
Calculator
Stream or mine: what does a price fall do to the margin?
Enter your own ounces, price and costs.
- Mine margin per year at your price: $40,000,000
- Stream margin after the price fall: $37,000,000
- Mine margin after the price fall: $22,000,000
Example values only, not forecasts or company figures. Stream payment is the fixed price per ounce paid to the mine owner; mine cost is an all-in sustaining cost per ounce. Upfront stream payments, tax and sustaining capital timing are not included. Default US$60 is Pan American’s dated second-half 2026 planning price (12 Aug 2026); use today’s price.
Where the metal comes from: key assets
Wheaton’s cornerstone streams
Wheaton’s 2025 results release names Salobo (gold, Brazil), Antamina (Peru) and Peñasquito (silver, Mexico) as cornerstone assets. In the second quarter of 2026, Salobo delivered 62,100 ounces of gold, Antamina 2.3 Moz of silver and Peñasquito 1.8 Moz. Newmont reported that Peñasquito’s silver output was expected to rise in 2026 on better grades and stockpile feed. At Constancia in Peru, operated by Hudbay, the high-gold Pampacancha pit was finished in the fourth quarter of 2025, so gold from there fell, and Hudbay won a permit in July 2026 to lift the mill to 34 million tonnes a year. Since 1 April 2026 Wheaton has received 67.5% of Antamina’s silver, up from 33.75%.
Chart
Antamina silver attributable to Wheaton, by quarter
Million troy ounces
Pan American’s mines
Pan American splits its operations into a silver segment (La Colorada and Juanicipio in Mexico, Cerro Moro in Argentina, Huaron in Peru, and San Vicente in Bolivia, in which it holds 95%) and a gold segment (Jacobina in Brazil, El Peñon and Minera Florida in Chile, Timmins in Canada, Shahuindo in Peru and Dolores in Mexico). Its 2026 silver guidance by mine ranges from 2.70 to 2.90 Moz at San Vicente to 6.00 to 6.50 Moz at Juanicipio, and Jacobina is its largest gold mine at 181 to 191 koz expected (Pan American, 20 January 2026). Dolores is approaching the end of its residual leaching phase, which lowers its output.
Silver is a Mexican and Peruvian story for both firms. USGS estimates 2025 mine production of 6,300 tonnes in Mexico and 3,600 tonnes in Peru, the two largest of any country, ahead of China at 3,400 tonnes. Mexico and Peru therefore carry country risk (tax, permitting, community relations) for both companies.
Pan American Silver reserves and growth projects
Pan American’s latest reserve update is dated 30 June 2026 and was published on 16 September 2026. It estimates proven and probable reserves of about 511.1 Moz of silver and 6.3 Moz of gold, measured and indicated resources (excluding reserves) of about 1,126.7 Moz of silver and 7.5 Moz of gold, and inferred resources of about 437.0 Moz of silver and 7.2 Moz of gold. The figures include its 44% share of Juanicipio, and the company says it replaced more than 100% of the silver mined (Pan American, 16 September 2026). A reserve is the part of a deposit shown by feasibility work to be economic to mine; a resource is mineralisation with reasonable prospects but without that proof; inferred is the least certain class. About 351,000 metres of drilling were completed by 31 August 2026 out of more than 500,000 metres planned for the year, aimed at replacing reserves near existing mines.
Growth is centred on the La Colorada Skarn project in Mexico. The company completed the first cut of the 588 Decline in early August 2026, and a revised preliminary economic assessment dated 24 March 2026 describes the expansion. It also plans a preliminary economic assessment for the Timmins Camp Project in the first half of 2027. 2026 capital spending is guided to US$580 million to US$615 million (US$340 million to US$360 million sustaining and US$240 million to US$255 million project), after project guidance was raised in May 2026 to fund La Colorada Skarn.
Wheaton’s reserves are measured differently. At 31 December 2025, the proven and probable reserves attributable to Wheaton’s streams were 556.1 Moz of silver and 15.1 Moz of gold, with inferred resources of 449.5 Moz of silver (Wheaton, 12 March 2026). These are ounces attributable to Wheaton’s contracts at partner mines, so they should not be set directly against Pan American’s own reserves. Wheaton forecasts growth of about 50% to 1.2 million GEOs a year by 2030 and holds a further group of assets classed as “optionality” outside that forecast.
Risks on each side
Streaming risks (Wheaton)
- Counterparty and operator risk. Wheaton does not run the mines, so a delay, a ramp-up that goes slowly or lower grades at a partner mine cut its deliveries. Its fourth-quarter 2025 release said B2Gold’s Goose mine was held back in 2025 by crushing-plant limits and delays reaching higher-grade ore, and that the Mineral Park concentrator was still ramping up.
- Concentration. A few cornerstone assets supply a large share of output, so a problem at one of them matters.
- Funding. New streams are paid for in cash up front. The Antamina purchase lifted net debt to US$1.9 billion at 30 June 2026 and the company enlarged its revolving credit facility to US$2.5 billion.
- Price assumptions. The 2026 guidance is calculated at US$4,800 gold and US$80 silver; if market prices differ, the GEO total shifts.
Mining risks (Pan American)
- Cost and operating risk. Gold production in the second quarter of 2026 fell below its quarterly range, and the company now expects gold at the low end of the annual range and gold AISC at the high end.
- Tax and royalties. Taxes paid in 2026 are expected to be US$585 million to US$635 million at planning prices of US$60 silver and US$4,000 gold for the second half.
- Jurisdiction and community. Operations in six Latin American countries bring permitting, tax and community consultation risk. Workforce health and safety also sits with the operator; see our guide to the health hazards of mining for the main exposures.
- Integration. The MAG Silver acquisition added Juanicipio, which produced 2.49 Moz attributable in 2025 and paid a US$44 million dividend to Pan American in December 2025.
How to compare precious metals companies listed in the USA
If you are screening precious metal companies on US exchanges, treat Wheaton and Pan American as two ends of a spectrum and check the same seven things for any name you add:
- Model. Operator, streamer or royalty holder. Our silver royalty and streaming company ranking compares the royalty side.
- Output share. Attributable ounces of silver and gold, and the guidance range.
- Cost measure. AISC for miners, cash cost per ounce for streamers, with the price assumption stated.
- Revenue mix. Wheaton’s 2025 revenue was 62% gold and 36% silver; in the first half of 2026 it was 49% each. Pan American is more gold-weighted than its name suggests.
- Balance sheet. Cash, debt and undrawn credit.
- Reserve basis. Whether reserves are the company’s own or attributable ounces at partner mines, and their date.
- Jurisdiction. Where the ounces come from and how fast the pipeline is growing.
Investors who want broad silver exposure without choosing between the two may also compare funds; see how much exposure silver mining stocks give through ETFs and silver ETFs versus silver miners. Not investment advice.
Environment and stewardship
A stream does not remove the environmental footprint of a mine; it sits outside the fence while the operator manages tailings, water and land. Wheaton’s second-quarter 2026 release lists an MSCI rating of AAA and a Prime rating from ISS. A primary producer such as Pan American manages those impacts directly and reports them in its own sustainability disclosures. When you compare the two, ask for the operator’s tailings and water data in either case, because the streamer’s exposure follows the operator’s record.
Where satellite data fits: screening ground before you commit
Streamers and miners both depend on one input: whether the ground holds enough metal. For consultants advising a licence owner or an investor reviewing a project, satellite imagery gives a first screen of mapped alteration, structure and terrain before drilling money is spent. Farmonaut, a US-based company, produces such screens as exploration targets for 20+ minerals, delivered in 5 to 20 business days from a KML, KMZ or polygon file; they are targets that sit ahead of any resource estimate, not a stand-in for one. Our guide to satellite-based mineral detection explains the method, you can send a polygon through the mining query form, or contact our team with a question.
▶ Explains remote sensing for mining in plain words, covering the six instrument families. · 2:01
Related reading on this site: Antofagasta plc Mines: Output, Costs and Growth.
Frequently asked questions
What is the main difference between Wheaton Precious Metals and Pan American Silver?
Wheaton buys a share of the gold, silver and other metals produced by mines that other companies operate, paying an upfront sum plus a small fixed price per ounce. Pan American owns and runs its own mines in the Americas, so it takes the full revenue and the full operating cost.
Which company produces more silver?
They are close. Pan American reported 22.84 Moz of attributable silver in 2025 and Wheaton 22.43 Moz. For 2026 Wheaton guided to 27 to 29 Moz and Pan American to 25 to 27 Moz.
Is Pan American Silver mostly a gold company now?
Its 2025 gold output of 742.2 koz was well above Wheaton’s, and gold-segment mines such as Jacobina, Shahuindo and Timmins carry much of the business. It still reports a silver segment and guided 25 to 27 Moz of silver for 2026, so it is a mixed silver and gold producer.
Does Wheaton Precious Metals own any mines?
Wheaton’s business is streams and royalties on mines owned by others. Its second-quarter 2026 release counts 22 operating mines, 20 development projects and 15 exploration or other projects, 57 assets in total, all under streaming or royalty agreements.
Where are Wheaton and Pan American listed?
Pan American trades under PAAS on both the New York Stock Exchange and the Toronto Stock Exchange. Wheaton’s filing lists its shares on the NYSE, TSX and London Stock Exchange.
Which company pays the higher dividend?
Per share, Wheaton declared US$0.195 and Pan American US$0.184 with their second-quarter 2026 results. A per-share figure does not show yield, which depends on the share price on the day; Pan American also returns cash through buybacks, with about 7.3 million shares repurchased by 11 August 2026.
What is a gold equivalent ounce?
It is Wheaton’s way of adding different metals into one number by converting silver, palladium, platinum and cobalt to gold at fixed price ratios. Wheaton’s 2026 guidance of 860,000 to 940,000 GEOs uses US$4,800 gold and US$80 silver.
What does AISC mean, and can I compare it with Wheaton’s cash cost?
AISC is the all-in sustaining cost per ounce a miner spends to produce and sustain output, net of by-product credits. Wheaton’s cash cost per GEO is mostly the price it pays the mine per ounce. They are different measures, so compare each company’s margin against its own realized price instead.
What are Pan American Silver’s reserves?
At 30 June 2026 the company estimated proven and probable reserves of about 511.1 Moz of silver and 6.3 Moz of gold, including its 44% share of Juanicipio (Pan American, 16 September 2026).
What are the biggest risks of streaming compared with mining?
Streaming trades operating risk for dependence on the mine operator, concentration in a few big assets and the cost of funding new deals. Mining carries cost inflation, tax, labour and permitting risk but gives control over the mine plan.
Can satellite imagery help evaluate a mine or a streaming project?
It can screen terrain, alteration and structure at an early stage, which helps a consultant decide where to look before drilling. It does not replace drilling, a resource estimate or a reserve statement.
This page is for information only. It is not investment advice. Company figures are as reported on the dates shown and change each quarter.
Farmonaut mining
Map a client's site from space
Consultants can request a quote for a satellite screen of a licence area before drilling money is committed.
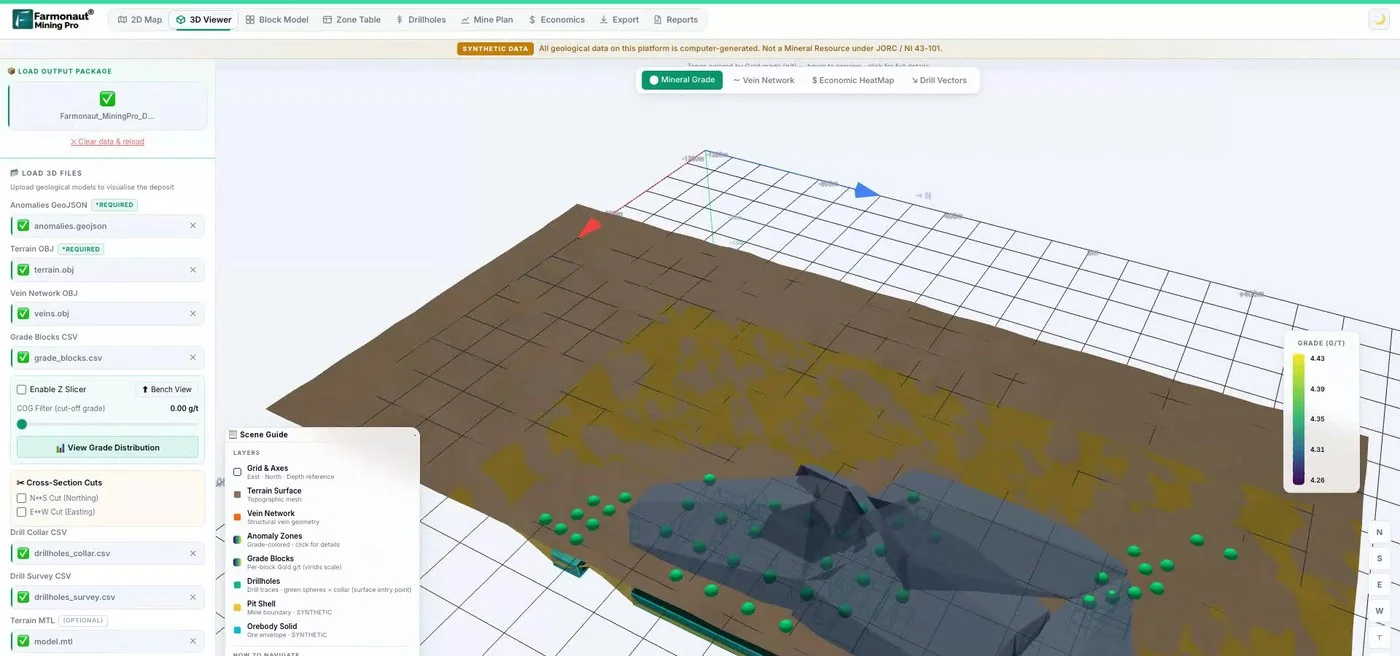
Mining Pro sample view, synthetic data
Keep reading

Sources
- Wheaton Precious Metals, 2025 production and 2026 guidance (16 February 2026): s203.q4cdn.com
- Wheaton Precious Metals, fourth quarter and full year 2025 results (12 March 2026): s203.q4cdn.com
- Wheaton Precious Metals, second quarter 2026 results (6 August 2026): s203.q4cdn.com
- Pan American Silver, 2025 production and 2026 guidance (20 January 2026): s202.q4cdn.com
- Pan American Silver, fourth quarter and full year 2025 results (18 February 2026): s202.q4cdn.com
- Pan American Silver, second quarter 2026 results (12 August 2026): s202.q4cdn.com
- Pan American Silver, mineral reserves and resources as at 30 June 2026 (16 September 2026): s202.q4cdn.com
- USGS, Mineral Commodity Summaries 2026: Silver: pubs.usgs.gov
- Silver Institute, Global silver investment to remain strong in 2026 (10 February 2026): silverinstitute.org
- Wheaton Precious Metals, Q2 2026 earnings call transcript (Motley Fool, 14 August 2026): fool.com
- Pan American Silver, Form 6-K with Q2 2026 news release (SEC EDGAR, 12 August 2026): sec.gov
Discussion
Questions, corrections or field experience? Share them below. First-time comments are reviewed before they appear, and your email is never published.
No comments yet. Be the first to add a question or your experience.

 Almosi SARL
 SRK Consulting
 Berks Gold Limited
 Mwerezi Minerals Company Limited
 Mining SARL
 SenGold Invest SAS
 Sean Mining Limited
 NTS Group (Pty) Ltd
 Mine4Africa
 Lithspo Minerals Limited
 Tintina Mining Group
 Dalgety Minerals Pty Ltd
 Vortex Minerals Pty Ltd
 Faith At Work (Pty) Ltd
 Geotech Mining Solutions plc

 Licence holder · Nigeria · Gold + lithium










