

Gold equities · Evaluation guide
Low Priced Gold Stocks: 7 Checks Before You Judge One
A low share price says little about a gold company. Judge it on cost per ounce (AISC), dilution, jurisdiction, resource stage and cash, using filings. Examples below are facts from company reports, not picks. Not investment advice.
Key takeaways
- Under SEC Rule 3a51-1, shares priced below five dollars are penny stocks unless they meet exchange listing conditions; share count matters more than price per share (eCFR, 17 CFR 240.3a51-1).
- Endeavour Mining reported first-half 2026 AISC of US$1,871 per ounce; a higher realised gold price (US$4,579 against a US$3,000 plan) added US$184 per ounce through royalties (Endeavour, Q2 2026 results).
- Fresnillo’s Herradura AISC rose about 30% to US$1,790.56 per equivalent ounce in the first half of 2026, while Ciénega’s fell about 14% (Fresnillo interim results, 2026).
- Inferred mineral resources rest on limited evidence and do not support an economic evaluation under the SEC’s mining rules (17 CFR 229.1300).
- Kitco quoted gold at US$4,157.70 per ounce (bid) at 2:51 p.m. New York time on 15 October 2026; test any company at a lower price too.
In this article
- What low priced gold stocks are, and what a low share price does not tell you
- Seven checks for low priced gold stocks at a glance
- Check 1: Cost per ounce (AISC) against the gold price
- Check 2: Dilution and how the company pays its bills
- Margin and dilution calculator
- Check 3: Jurisdiction, permits and the risk of losing control
- Check 4: Resource stage, grade and what the numbers mean
- Check 5: Balance sheet, debt and cash runway
- Check 6: Governance, ownership and where the shares trade
- Check 7: Concentration in one mine or one project
- Worked examples: what filings show about cost and margin
- Gold price context for the checks
- Red flags that repeat in weak gold stocks
- What satellite data can and cannot add to stock research
A low-priced gold stock is a gold company whose shares trade at a small price per share. That tells you very little by itself. A US$0.05 share can be a better-funded business than a US$50 one, and a US$3 share can still be a bad one. What matters is cost per ounce against the gold price, how many new shares the company must issue to survive, where its mines are, and how firm its resource numbers are. This guide sets out seven checks, with figures from company filings and official sources, so you can judge any such company on facts. It names companies only as worked examples. It does not pick stocks, and it is not investment advice.
A few terms first. Grade is the amount of gold in rock, usually grams per tonne (g/t). AISC (all-in sustaining cost) is the cost of producing one ounce of gold, including the capital needed to keep the mine running. Dilution is the fall in each existing holder’s ownership share when a company issues new shares. A junior is a small explorer or developer with little or no production. A troy ounce is 31.1035 grams.
What low priced gold stocks are, and what a low share price does not tell you
There is no single definition. In the United States, regulators use the term penny stock. The Securities and Exchange Commission’s Rule 3a51-1 excludes shares priced at five dollars or more, and it also excludes shares that meet listing conditions on a qualifying national exchange. Brokers who sell penny stocks must follow extra sales rules. Many gold explorers fall under this label simply because they are small and trade over the counter or on junior exchanges. Others, such as large producers that dipped, are cheap per share but are not penny stocks at all.
The share price alone is a poor signal because the number of shares can be anything. Company value is the share price times the number of shares, called market capitalisation. A company with 2 billion shares at US$0.05 is worth US$100 million. A company with 10 million shares at US$10 is worth the same. When someone says a stock is cheap, ask two questions. Cheap against what: the ounces in the ground, the cash flow, or the assets? And what will the share count be after the next financing?
Readers also search for the “worst” gold stocks. Treat any ranking of the worst names with care. A stock can fall for one bad quarter, a permit delay or a single drill result, and then recover. The checks below describe risks that apply to any low-priced company, so you can test a name yourself instead of relying on a list.
Seven checks for low priced gold stocks at a glance
| Check | The question | Where to find the answer |
|---|---|---|
| 1. Cost per ounce | Is AISC well below the gold price, on the company’s own plan? | Quarterly results, annual report |
| 2. Dilution | How many new shares and warrants are outstanding or likely? | Financing news releases, financial statements |
| 3. Jurisdiction | Can the company get permits and keep its licence and cash? | Annual report risk factors, regulator sites |
| 4. Resource stage | Are the ounces measured and economic, or only inferred? | Technical report, resource tables |
| 5. Balance sheet | Is there cash for the next 12 months, and how much debt? | Balance sheet, going-concern note |
| 6. Governance and listing | Who runs it, who owns it and where does it trade? | Proxy or circular, exchange filings |
| 7. Concentration | Does one mine or one project carry the whole company? | Production table, asset list |
Check 1: Cost per ounce (AISC) against the gold price
For a producer, the gap between the price it receives and its AISC is the margin before tax, interest and costs outside AISC. The World Gold Council issued its guidance note on AISC in 2013. It is a non-GAAP measure, meaning it is not an accounting figure, and each company applies the guidance in its own way. Compare a company with itself over time first, and with peers second.
Chart
AISC changes between two periods
US$ per ounce. Herradura and Ciénega: first half 2025 to first half 2026 (year on year). Endeavour group: Q1 to Q2 2026 (quarter on quarter)
Two points stand out in company filings. First, costs rise when the gold price rises, because royalties are paid as a share of revenue. Endeavour Mining’s second-quarter 2026 results show first-half 2026 AISC of US$1,871 per ounce. The company’s guidance assumed a gold price of US$3,000 per ounce, but it realised US$4,579 per ounce in the half. It states that the higher price added US$184 per ounce through royalties, and that without this effect first-half AISC would have been about US$1,687 per ounce. A cost forecast built on an old price assumption can be wrong even when the mine runs well.
Second, costs can move sharply from one half-year to the next for operating reasons. In its interim results for the first half of 2026, Fresnillo reported that AISC at its Herradura gold mine rose about 30% to US$1,790.56 per equivalent gold ounce, mainly because of a higher cash cost and higher sustaining capital per ounce. The same report says Herradura’s cash cost per ounce rose because of lower ore grade and a higher cost per tonne. At Ciénega, AISC fell about 14% to US$2,007.48 per equivalent ounce, driven by a lower cash cost and lower development spending. Grade and spending decide cost more than the share price does.
When you read a low-priced producer, look for AISC for the last four quarters, the price assumption behind the guidance, and the list of items that are left out. If the company reports only “cash cost”, which excludes sustaining capital, the true cost is higher.
Check 2: Dilution and how the company pays its bills
An explorer has no sales. It pays for drilling, staff and office costs by selling new shares, often with warrants. A warrant is a right to buy one more share at a fixed price for a set period. Each financing therefore adds shares now and may add more later if the warrants are exercised.
A small example from a public news release shows the mechanics. On 15 January 2026, Golden Age Exploration (Canadian Securities Exchange: GDN) announced a non-brokered private placement of up to 5,000,000 units at five cents a unit, with a target of 250,000 in proceeds. Each unit was one share plus one warrant to buy another share at six and a half cents for two years. The release says the money would go to working capital, administration, and exploration and evaluation costs. If every unit were sold and every warrant used, up to 10,000,000 shares would exist where the offer started with 5,000,000. This is how most juniors work, and it is not a fault in itself. It does mean you must follow the share count as closely as the share price.
What to check:
- Shares outstanding over time. Compare the count in the latest quarterly statement with the count two or three years earlier.
- Fully diluted count. Add warrants, options and convertible debt. Companies list these in the notes to the financial statements.
- Financing price against market price. A raise at a deep discount, or with a warrant at a price close to the share price, adds more dilution risk.
- Use of proceeds. Money for drilling creates information. Money for administration and short-term needs only extends the runway.
- Hold periods and insider selling. Shares sold in a placement are often restricted for a four-month hold period in Canada, as in the Golden Age placement release of January 2026, and then come to market.
The calculator in the next section lets you test the effect of an issue on margin per share.
Margin and dilution calculator
Use the calculator to test one producer or one financing. Enter a gold price, an AISC, annual ounces sold, the shares outstanding and the size of a new issue. The result shows the margin and what the issue does to margin per share.
Calculator
What does one financing do to margin per share?
Enter your own gold price, cost, ounces and share counts.
- Margin per ounce: 2,000 US$/oz
- Dilution from the new shares: 16.7 %
- Dilution if all warrants are used: 23.1 %
- Margin per share, fully diluted: 0.77 US$/share
Example values only, not any company’s results and not a forecast. Gold price is an input: example, use today’s price. AISC is an input taken from a company’s own report; each company defines it differently (World Gold Council guidance, 2013). Margin is before tax, interest and costs outside AISC. Share counts are in millions.
Check 3: Jurisdiction, permits and the risk of losing control
A mine is only as safe as the licence behind it. Many low-priced gold companies trade at a discount because their assets sit in countries where rules, taxes or security can change quickly. Ranking systems try to measure this. The Fraser Institute’s 2025 Annual Survey of Mining Companies, published in February 2026 and reported by Skillings Mining Review, ranked Nevada first for investment attractiveness. The survey drew 256 responses from a pool of 2,304 senior mining executives. It is an opinion survey, so use it as a guide to sentiment, not as a legal analysis.
A concrete case shows what jurisdiction risk looks like in a filing. Barrick Mining Corporation’s 2025 annual report says the company resolved its disputes with the government of Mali and regained control of the Loulo-Gounkoto complex on 16 December 2025. The report records other expense adjustments of US$823 million in the fourth quarter of 2025, which it says mainly related to the settlement payment to the Mali government in November 2025 and an inventory fair-value increment. It also lists the resumption of operations under the 2023 Mining Code among the risks to its forward-looking statements. Barrick is a large producer, not a low-priced stock, yet the episode shows how a dispute with a government can halt a mine and carry a large cost. For a small company with one asset, the same event could end the business.
What to check:
- Who holds the licence and whether the company owns it directly or through an option or a joint venture.
- Licence expiry and renewal terms for each project, and any state carried interest or royalty stake.
- Permitting status for mining, water and tailings. Our guide to mining royalties on gold explains how royalty burdens reduce what a company keeps.
- Where cash is held and whether it can leave the country.
Check 4: Resource stage, grade and what the numbers mean
A resource is not a reserve. Under the SEC’s mining rules in 17 CFR 229.1300, an inferred mineral resource is estimated from limited geological evidence and sampling. The rule says the uncertainty is too high to apply technical and economic factors in a way that supports an evaluation of economic viability. Only the mineral reserve category rests on a study showing that extraction is economically viable. Companies that report to the SEC repeat this in their presentations, with a warning that investors should not assume resources will become reserves.
The practical rule is simple. Ounces in the ground are not ounces you can sell. To judge a resource statement, ask:
- What share is measured and indicated, and what share is inferred? A table dominated by inferred ounces is early-stage.
- What grade and what cut-off grade? The cut-off grade is the lowest grade that pays for mining and processing at the stated gold price. A resource calculated at a high gold price can shrink when the price falls.
- What study sits behind it? A preliminary economic assessment is a scoping level. A feasibility study is the basis for a financing decision.
- Who signed it? The technical report names a qualified person and the date. Old estimates may use old prices.
- Does the plan fund itself? Look for capital cost, payback and the financing plan. A project that needs a large build but has a small market value must raise money, and that links back to Check 2.
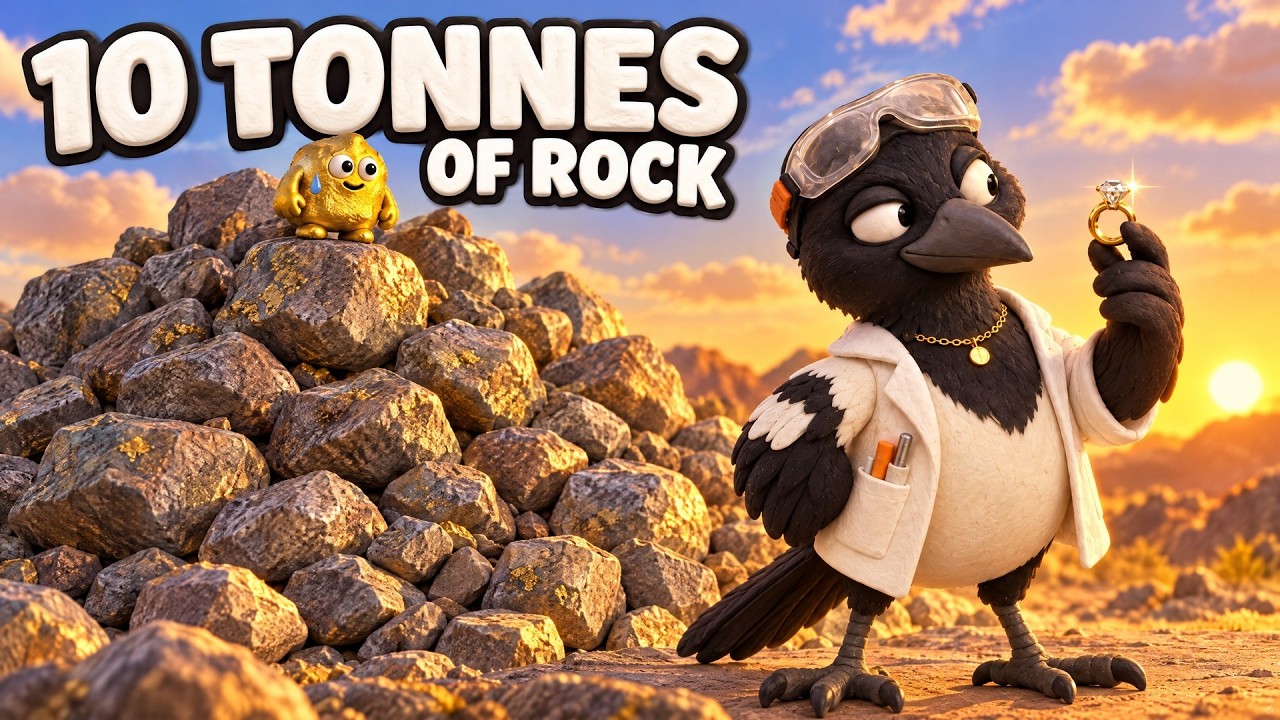
▶ Follows gold from rock to ring: finding, drilling, crushing, dissolving and refining. · 5:27
Check 5: Balance sheet, debt and cash runway
Most failures come from running out of cash, not from running out of gold. Read the balance sheet and the cash flow statement together. Cash at the period end divided by the average quarterly cash spend gives a rough runway in quarters. If the auditor’s report or the notes mention a going-concern doubt, the company is telling you it may not be able to meet its obligations for the next twelve months without new funding.
For producers, add debt to the check. Compare net debt with a full year of operating cash flow. Check whether the company has sold gold forward (hedging), which protects cash flow when prices fall but caps gains when they rise. Endeavour’s results, for example, set out its guidance and its price assumption openly, which makes the cost range easy to test. A smaller company that gives no price assumption is harder to judge.
Check 6: Governance, ownership and where the shares trade
Look at who owns the stock and who runs the company. Large insider holdings can align interests, but a board with no independent members, frequent changes of chief executive, or related-party payments are warning signs. Check whether directors have built a mine before.
The trading venue matters too. Shares on the New York Stock Exchange, Toronto Stock Exchange or Australian Securities Exchange must meet listing and disclosure rules. Shares on over-the-counter markets, which are quoted by dealers and not on a main exchange, may have less information and wider gaps between buying and selling prices. Thin trading means a small order can move the price, and selling later may be hard. Read filings on the regulator’s own database (SEC EDGAR in the United States, SEDAR+ in Canada, the ASX announcements platform in Australia) instead of relying on promotional sites.
Be alert to promotion. Newsletters and social posts that push a tiny gold stock, often with a single drill result, are a classic route for losses. Thinly traded small companies are an easy target for pump-and-dump schemes, in which promoters lift a price and sell into it. If the main source of excitement is a paid promotion and not a filing, treat that as a red flag.
Check 7: Concentration in one mine or one project
A company with a single mine has a single point of failure. A shaft collapse, a flood or a tailings problem can stop all revenue. The Endeavour release is a useful contrast. It reports production from several mines and shows that, in the second quarter, lower output at some sites was offset by higher output at others, so the group total was broadly stable. A single-asset company has no such cushion.
Read the production table by mine, the share of revenue from the largest mine, and the mine life. A short mine life with no plan to extend it means the company must find or buy new ounces, which costs money and, again, may mean new shares.
Worked examples: what filings show about cost and margin
The table sets out the AISC figures behind this guide. All are the companies’ own figures. They are not a ranking and they are not recommendations. AISC definitions differ between companies, and Fresnillo reports per equivalent gold ounce, which converts by-product metals into gold.
Chart
Gap between gold at US$4,157.70 and reported AISC
US$ per ounce; spot minus AISC, before tax, interest, hedging and costs outside AISC
| Operation | AISC, US$ per ounce | Period | What changed |
|---|---|---|---|
| Endeavour Mining, group | 1,871 | First half 2026 | About 1,687 without the royalty effect of a higher gold price |
| Endeavour Mining, group | 1,907 | Second quarter 2026 | US$73 per ounce above the first quarter |
| Fresnillo, Herradura | 1,790.56 | First half 2026 | Up about 30% on the first half of 2025 |
| Fresnillo, Ciénega | 2,007.48 | First half 2026 | Down about 14% on the first half of 2025 |
Set against a gold price, the same figures show the gap. Kitco’s live chart quoted gold at US$4,157.70 per ounce (bid) at 2:51 p.m. New York time on 15 October 2026. The comparison below subtracts each AISC from that price. It is an illustration of arithmetic, not an estimate of profit: it ignores the price each company actually realised, hedging, tax, interest and costs outside AISC, and spot moves every day.
Gold price context for the checks
Cost pressure and margin both depend on the price. The London Bullion Market Association’s survey page shows an average gold price of US$2,386.20 in 2024 and US$3,431.54 in 2025. The survey notes that analysts’ average forecast for 2025 was US$2,735.33, so actual prices ran well above the forecast. The lesson for low-priced stocks is two-sided. A plan built on a price assumption can look cautious a year later, and the same plan can look generous after a fall. Test any company at a lower price than today’s, and see whether it still covers its AISC and its debt.
Chart
Gold prices against one company’s cost plan
US$ per troy ounce; LBMA annual averages, Endeavour’s 2026 plan and sales price, and Kitco spot
Red flags that repeat in weak gold stocks
- A going-concern warning with no financing in place.
- Shares outstanding that have more than doubled in three years with no matching rise in ounces or output.
- AISC missing from results, or reported with large exclusions.
- A resource made mostly of inferred ounces, valued as if it were reserves.
- One mine or one licence supplying all the story, in a jurisdiction with a record of disputes.
- Price targets and “undervalued” claims from paid promoters, with no link to filings.
- Management who change often, or who are paid in ways that do not match results.
None of these proves a company will fail. Each one raises the amount of evidence you should want before you form a view. Our guide to screening copper stocks with data applies the same filing-first approach to another metal.
What satellite data can and cannot add to stock research
Satellite imagery cannot see gold. It maps the rock, alteration and structure around it, such as iron-oxide staining and clay minerals, which exploration teams use to rank targets before drilling. For an investor, that makes it a way to understand a company’s land package, not a substitute for drill results or a resource estimate. Satellite results are exploration targets that sit ahead of any resource estimate, and they are not a reserve, a compliance report or an environmental clearance. If you hold a licence and want to see what a satellite screen shows, the satellite mineral detection page explains the method, and the mining query form is where you send a boundary for a quote.
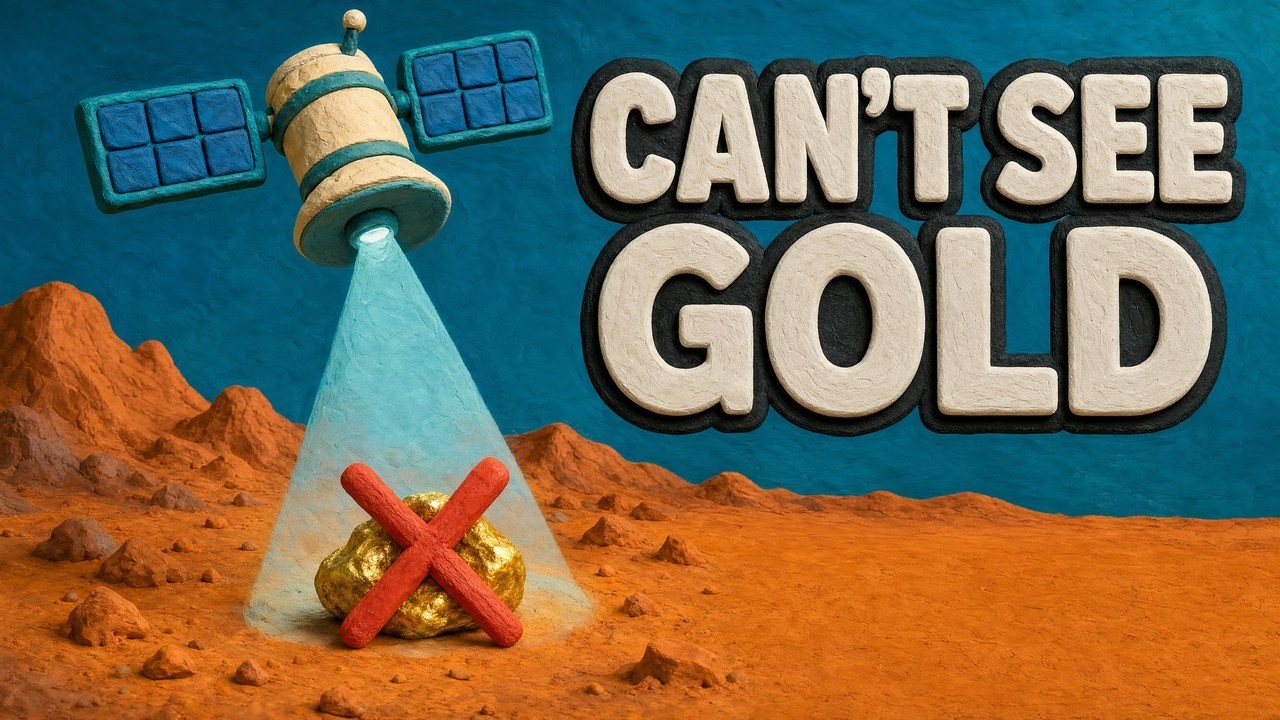
▶ Explains why satellites cannot see gold but can map the rock and alteration around it. · 4:25
For a closer look at a related question, see our guide: Gold Mining Claims for Sale in AZ: 5 Checks Before You Buy.
Frequently asked questions
What counts as a low-priced gold stock?
There is no standard cut-off. In the United States, the SEC’s Rule 3a51-1 treats shares priced below five dollars as penny stocks unless they meet listing conditions on a qualifying exchange. Outside the US, the term is looser and often means any small, low-priced gold explorer or developer.
Is a low share price the same as a bargain?
No. Company value is the share price times the number of shares. A low price on a huge share count can describe an expensive company. Compare market value with cash, debt, ounces and cash flow, not with the price per share.
What is AISC and why does it matter for gold shares?
AISC is all-in sustaining cost per ounce, defined in a World Gold Council guidance note first issued in 2013. It adds sustaining capital and overheads to direct mining costs. The gap between the gold price and AISC shows how much room a producer has before tax and financing.
How does dilution hurt existing shareholders?
When a company issues new shares, each existing share represents a smaller part of the company. If the new money does not raise value by more than the dilution, the value per share falls. Warrants can add further shares later.
How can I check the jurisdiction risk of a gold company?
Read the risk factors in the annual report, check the licence terms and the country’s mining code, and look at survey results such as the Fraser Institute’s. Look for history: past licence disputes, tax changes and export rules in that country.
What is the difference between a mineral resource and a mineral reserve?
Under the SEC rule, a resource is material in such form, grade and quantity that there are reasonable prospects for economic extraction. A reserve is the part shown by a study to be economically viable under stated assumptions. Inferred resources have too little evidence to support an economic evaluation.
Where do I find a gold company’s real numbers?
Use the regulator’s database: SEC EDGAR for US filers, SEDAR+ for Canadian issuers and the ASX announcements platform for Australian ones. Quarterly results and technical reports carry AISC, resources, cash and share counts.
Are over-the-counter gold stocks riskier?
They can be. Disclosure may be thinner, trading volume lower and price gaps wider than on a main exchange. Check the filings for the company and whether it reports to a regulator.
Does a higher gold price fix a weak gold company?
Not by itself. Endeavour’s results show that a higher price raises royalty costs, and a weak balance sheet, a short mine life or a licence dispute does not go away when the price rises. A higher price helps only if costs, debt and permits are in order.
Can satellite imagery tell me if a junior gold company’s project is any good?
Not on its own. It can map alteration and structure and point to targets, but only drilling, assays and a resource estimate by a qualified person show how much gold is there.
This page is for information only. It is not investment advice. Company figures are the companies’ own reports and are not audited by Farmonaut. Examples are not recommendations to buy, sell or hold any security.
Farmonaut mining
Get a satellite screening quote for your licence
Send a licence boundary as KML, KMZ or a polygon and ask for satellite-derived exploration targets, ahead of any resource estimate.

Mining Pro sample view, synthetic data
Keep reading
Sources
- U.S. eCFR, 17 CFR 240.3a51-1, Definition of penny stock: ecfr.gov
- U.S. eCFR, 17 CFR 229.1300, Mining definitions: ecfr.gov
- World Gold Council, Guidance note on non-GAAP metrics: AISC and AIC: gold.org
- Endeavour Mining, H1 and Q2 2026 results news release: edv-14806-s3.s3.eu-west-2.amazonaws.com
- Fresnillo plc, interim results for the six months to 30 June 2026: investegate.co.uk
- Barrick Mining Corporation, Annual Report 2025: s25.q4cdn.com
- LBMA, 2025 precious metals forecast survey results: lbma.org.uk
- Kitco, live gold price (15 October 2026): kitco.com
- Golden Age Exploration, non-brokered private placement (15 January 2026): newsfilecorp.com
- Golden Age Exploration, closing of first tranche: newsfilecorp.com
- Skillings Mining Review, Fraser Institute 2025 survey coverage: skillings.net
- Contango Silver & Gold, 8-K exhibit with S-K 1300 cautionary notes (April 2026): boardroomalpha.com
Discussion
Questions, corrections or field experience? Share them below. First-time comments are reviewed before they appear, and your email is never published.
No comments yet. Be the first to add a question or your experience.

 Sean Mining Limited
 NTS Group (Pty) Ltd
 Mine4Africa
 Lithspo Minerals Limited
 Tintina Mining Group
 Dalgety Minerals Pty Ltd
 Vortex Minerals Pty Ltd
 Faith At Work (Pty) Ltd
 Geotech Mining Solutions plc
 Vulcan International Limited
 Kidepo Associates
 GKY Mining
 Alkimy SARL
 Double A Trading
 GemSprout Metals Limited
 Qader Group
 Ileys General Trading
 SG Gold Mining LLC
 VRV Global Pte Ltd
 Omsri International FZE
 G.I.T.T.
 Jaunita Erss Ltd
 Almosi SARL
 SRK Consulting
 Berks Gold Limited
