

Reviewed September 2026 against MSHA equipment approval regulations, OPSIMA mining industry KPI benchmarks, and UES Systems predictive-maintenance cost data.
Try it: Run your own numbers →
Mining equipment performance data usability testing checks whether the dashboards, alerts, and reports built from sensor data are something a haul-truck operator or maintenance planner can actually act on in the field — not just data a system can store. Scalability and load testing check the second half of the same problem: whether that same platform still returns results in seconds, not minutes, when every machine on a multi-pit site is reporting at once. Get either one wrong and the downtime bill lands in the same place — US mining operations report equipment downtime costs ranging from $5,000 to $100,000 per hour depending on operation scale and equipment class, according to a UES Systems and MapTrack analysis of predictive-maintenance case studies (UES Systems).
This article walks through what usability testing, stress testing, load testing, accessibility testing, and scalability testing actually mean for a mining performance-data platform, what “good” looks like against published industry benchmarks, and how to run each test on your own site — with a calculator at the end that turns your own downtime numbers into a cost-of-delay estimate.
Why Mining Equipment Performance Data Testing Exists
Modern mining machinery — drilling rigs, haul trucks, crushers, IoT-enabled excavators — carries vibration monitors, fuel-flow meters, temperature gauges, and AI-driven health analyzers that stream continuously. The bottleneck was never collection. It’s whether a maintenance planner staring at that stream at 6 a.m. can find the one reading that matters before a $130,000-an-hour asset goes down.
That figure is not a rounding exercise: MapTrack and UES Systems put the downtime cost of high-production mining assets — the large shovels, draglines, and primary crushers that anchor a pit’s throughput — at approximately $130,000 per hour when they stop unexpectedly (MapTrack). Ultimo and AIM by HonestDig separately put the average cost per downtime incident, across equipment classes and operation sizes, at $180,000 (Ultimo). Those numbers only move if the data that would have predicted the failure actually reached someone who could act on it in time. That’s the entire justification for testing the interface, not just the sensor.
There’s a compounding effect worth naming here too: HonestDig and Umbrex document that in open-pit operations, queue formation and dispatch imbalance — trucks backed up behind a single down shovel, or a crusher waiting on trucks that are waiting on a scale — amplify the effective cost of one piece of downtime by 3 to 5 times across the fleet (HonestDig). A dashboard that surfaces a bearing-temperature trend two hours before failure, instead of an alarm at the moment of failure, is the difference between a scheduled swap and a fleet-wide queue.
Usability Testing: What It Actually Checks
Mining equipment performance data usability testing evaluates whether collected data can effectively support real-world decisions — not whether the software has a modern-looking dashboard. In practice it breaks into five concrete checks:
- User-centered design evaluation: equipment operators, maintenance crews, and engineers use the actual dashboard on the actual hardware they’ll have in the field (often a rugged tablet with gloves on, not a wide monitor) and are timed on finding a specific metric.
- Data accessibility checks: does the data load and render at a remote pit with degraded connectivity, not just on the office network during the demo.
- Integration testing: does performance data flow cleanly into the ERP, fleet management, and maintenance systems already in use, or does someone end up re-keying numbers from one screen into another.
- Interface intuitiveness: can a new maintenance planner, with no training beyond a five-minute walkthrough, correctly interpret a trend line and an alert threshold.
- Relevance and clarity: is the default view free of metrics nobody on that role actually uses, or does every screen show all 40 sensor channels regardless of who’s looking.
On the “does a quantified failure rate exist for mining dashboard usability” question specifically: it doesn’t, publicly. No published study compares error rates or task-completion rates across mining monitoring software interfaces in production use — this is proprietary to individual OEM telematics platforms and mining software vendors. If you want that number for your own site, the only reliable path is to run the test yourself: give five to eight actual users (not developers) a list of realistic tasks — “find yesterday’s fuel consumption for Truck 14,” “identify which excavator has the oldest overdue service” — and time them, without hints, on your production dashboard.

User Interface and User Experience Testing
UI and UX testing for a mining performance-data platform is narrower than general usability testing: it’s specifically about layout, navigation, and visual hierarchy, tested against the conditions the interface will actually face. A screen that reads fine on a 27-inch office monitor at 100% brightness can be unreadable on a 10-inch tablet in direct sun at a Nevada or Arizona open-pit site, or with a glove-tipped finger trying to tap a control sized for a mouse cursor.
A practical UI/UX test pass covers:
- Contrast and font size under outdoor daylight conditions, not just indoor screenshots
- Touch-target size for gloved operation on rugged tablets
- Navigation depth — how many taps from login to the one number a shift supervisor checks first
- Consistency of color coding for alert severity across every screen, so red always means the same thing
- Whether the same task (e.g., logging a fault) takes a comparable number of steps across web, Android, and iOS versions of the same platform
This is also where role-based design pays off. An equipment operator needs one or two live numbers and a clear alert. A reliability engineer wants historical trend lines and comparison across the fleet. A site manager wants a rollup across all active equipment. Testing all three as if they need the same screen is a common design mistake that shows up immediately in usability sessions.
Accessibility Testing for Mining Dashboards
Accessibility testing checks whether the platform works for users with visual, motor, or hearing impairments, and — in a mining-specific sense — whether it works under the physical conditions of a mine site: gloves, noise-cancelling headsets that block audio alerts, and screens viewed at odd angles from a cab seat.
The baseline technical checks follow WCAG conventions used across enterprise software generally: keyboard navigability, screen-reader compatibility for control-room staff, sufficient color contrast ratios, and text resizing that doesn’t break the layout. On top of that baseline, a mining-specific accessibility pass should verify:
- Critical alerts are never color-only — a colorblind operator needs a shape or text cue too
- Audible alarms have an equally reliable visual equivalent, since cab and shop-floor noise routinely exceeds levels where an audio-only alert is safe to rely on
- Text and icon sizing hold up on the smallest device the fleet actually issues to field staff, not the reference device used in development
No industry-wide accessibility compliance benchmark specific to mining software exists in the public record as of this review — treat WCAG 2.1 AA as the working standard until a mining-specific rule is published, and re-test after every major UI release rather than once at launch.

Scalability, Load, and Stress Testing
These three terms get used interchangeably and shouldn’t be. They test different failure modes:
- Load testing: can the platform handle its expected peak — every machine on site reporting simultaneously during a shift change or a planned data sync — without response times degrading.
- Stress testing: what happens past that expected peak — double the machine count, a sensor firmware bug that triples reporting frequency — does the system degrade gracefully (slower but still correct) or does it drop data or crash.
- Scalability testing: can the platform grow — more sites, more machines, more sensor types — over months and years without a re-architecture, and does cost grow linearly with volume or does it spike.
Concretely, that means simulating: hundreds or thousands of new machines added to a fleet; more granular data collection such as sub-second vibration sampling instead of per-minute averages; and integration with AI/deep-learning analytics layers for predictive maintenance, all without degrading the response time a maintenance planner sees when they open the dashboard.
Network conditions matter as much as server capacity here. Mining sites are frequently in locations with limited or intermittent connectivity, so scalability testing has to include deliberately degraded-bandwidth and high-latency scenarios — not just a fast office network — to confirm data queues and syncs correctly rather than silently dropping readings when a link drops.
On the ROI question specifically — how much does load/stress testing investment save in avoided downtime — no peer-reviewed, third-party-verified benchmark exists publicly; the estimates you’ll find are vendor white papers, which is a conflict of interest you should discount accordingly. What is verifiable is the downside case: a dashboard that fails to load during a load spike is a dashboard nobody can use during exactly the moment — a fleet-wide event — when they need it most.

Performance Testing and Experimentation
Performance testing measures response time, throughput, and resource use under realistic conditions — how long a dashboard takes to render a 90-day trend chart for a 40-machine fleet, for example, rather than whether it can survive an artificial stress spike. It’s the day-to-day quality gate that catches a slow database query or an unoptimized chart-rendering routine before it reaches the field.
Experimentation, in this context, means structured A/B or phased testing of dashboard changes before a full rollout: does a redesigned alert panel actually reduce the time to acknowledge a critical fault, tested against the existing panel with a subset of real users, before every site gets the new version. This matters specifically because mining software changes are hard to reverse in the field — once a fleet of tablets is updated, rolling back requires another site visit or remote push, so validating with a smaller group first catches problems cheaply.
A reasonable performance-testing cadence pairs every UI or backend release with:
- A synthetic load test matching current peak fleet size before deployment
- A staged rollout to one site or one shift before a fleet-wide push
- A rollback plan that can be executed remotely, not one requiring a site visit

Architecture: What Sits Behind the Dashboard
None of the testing above matters if the underlying architecture can’t support it. The components that make usability and scalability testing possible at all:
- Cloud and edge computing: edge devices preprocess sensor data on-site, sending summaries rather than raw streams to the cloud, which reduces both bandwidth needs and the load the central platform must handle.
- AI-driven analytics: surfaces the handful of readings that matter out of the thousands collected, which is the actual mechanism by which usability improves — less for a human to sift through, not just a prettier chart.
- IoT integration: synchronized sensors and smart devices need a common data schema; architecture that bolts on each new sensor type as a special case is what eventually fails scalability testing.
- Blockchain-based traceability: for unalterable logging of maintenance, origin, and operational events across an equipment’s lifecycle — see Farmonaut’s traceability tools for how this applies to mining supply chains specifically.
- Environmental impact monitoring: satellite-backed tracking of carbon and water footprints tied to mining operations — covered in more depth on Farmonaut’s carbon footprinting page.
Architecture decisions made early — a rigid schema, a database that doesn’t horizontally scale, a UI framework that doesn’t gracefully degrade on low bandwidth — are exactly what surface as usability and scalability failures 12-24 months later when the fleet has doubled. Testing architecture assumptions against a 3x-current-scale scenario before committing to a platform is cheaper than migrating later.
The MSHA Angle: Equipment Approval vs. Data Testing
It’s worth separating two things that sound related but aren’t: the Mine Safety and Health Administration’s (MSHA) equipment approval and certification process, and the software usability/scalability testing this article otherwise covers. MSHA regulations under 30 CFR Parts 6 through 36 govern testing, evaluation, and approval of mining equipment itself — across coal, metal, and nonmetal mine types — before that equipment can be used underground or on a surface mine site (MSHA). That’s a physical-equipment safety certification, not a data-platform usability standard.
The two do intersect at one point worth knowing about: in December 2024, MSHA finalized a rule incorporating 8 voluntary consensus standards from ANSI into its Part 18 regulations covering electric motor-driven mine equipment and accessories testing (Federal Register, December 10, 2024). That rule affects what counts as an approved sensor or monitoring device on electric mining equipment — which matters if your performance-data pipeline depends on MSHA-approved sensors reporting into it. No published dataset covers how often equipment fails MSHA approval testing on a first submission, or how many iterations a typical approval takes; that data is not publicly released and would need to come directly from MSHA or from the equipment manufacturer going through approval.
For the current testing procedures and any updates beyond the December 2024 rule, MSHA’s Volume II Testing and Evaluation page is the primary source to check periodically — new rules are published there as they’re incorporated, not on a fixed schedule.
Testing Types Compared
The table below distinguishes the testing categories covered in this article by what they measure, when to run them, and the tools or methods typically used. Use it as a reference for scoping a testing programme rather than running every category simultaneously.
| Testing Type | What It Measures | When to Run It | Typical Method |
|---|---|---|---|
| Usability testing | Can real users complete real tasks without confusion | Before major UI release; quarterly review | Moderated sessions with 5-8 field/office users |
| UI/UX testing | Layout, navigation, visual hierarchy under field conditions | Every design change; new device rollout | Field device testing in daylight/glove conditions |
| Accessibility testing | Usability for impaired users; WCAG 2.1 AA compliance | Every major release | Automated scanners plus manual screen-reader pass |
| Performance testing | Response time and throughput under normal load | Every release, pre-deployment | Synthetic transaction timing against current fleet size |
| Load testing | Behavior at expected peak concurrent usage | Before fleet expansion; before shift-change peak events | Simulated concurrent-user and sensor-burst scripts |
| Stress testing | Failure mode beyond expected peak | Annually; before major sensor-type additions | Load scripts scaled past 2x expected peak |
| Scalability testing | Growth capacity over months/years without re-architecture | Annually; before multi-site expansion | Projected-volume simulation at 3x-5x current scale |
| Experimentation (A/B) | Whether a specific change improves a measurable outcome | Before fleet-wide UI rollout | Phased rollout to a subset of sites/users first |
Downtime Cost Calculator
Use your own fleet’s downtime hours and cost-per-hour range to estimate what a testing programme that catches problems earlier is actually worth avoiding — enter the figures for your operation, not the industry averages cited above.
Run your own numbers
Assumptions: figures are illustrative estimates based on the ranges cited in this article (UES Systems, MapTrack, HonestDig), not a guarantee for any specific site. The calculator does not account for planned maintenance downtime, seasonal production variation, or capital cost of new monitoring hardware. Use it to compare scenarios, not as a budget figure.
Where Farmonaut Fits
Farmonaut runs a satellite-driven platform layered on top of the equipment and site data mining operators already collect, built to hold up under the usability and scalability demands described above.
-
Real-time monitoring —
Our web and mobile apps (available on



) are built for the low-connectivity, high-glare conditions described above, not adapted from an office-first design. -
Jeevn AI advisory —
Analyzes mining equipment performance datasets alongside weather forecasts and site conditions to surface predictive maintenance and safety recommendations, aimed at the "which reading matters" usability problem, not just more charts. -
APIs and integration —
Developers can integrate directly via the Farmonaut API (developer docs), feeding performance data into existing dashboards and fleet management systems instead of forcing a platform switch. -
Blockchain traceability —
Traceability tools for end-to-end tracking of extracted resources and equipment lifecycles. -
Environmental monitoring —
Carbon footprinting tools track emissions data alongside equipment performance data. -
Centralized site management —
The large-scale admin app gives centralized visibility across distributed sites and equipment for operators managing more than one pit or region.
Get started with large-scale site and field performance monitoring:

A Testing Checklist You Can Reuse
This is the durable part of this article — a checklist that stays valid regardless of what the specific benchmark numbers look like next year:
- Test with real field users, on real field devices, in real field conditions — not developers, not office monitors, not office Wi-Fi.
- Separate usability metrics by role — an operator's dashboard, a reliability engineer's dashboard, and a site manager's rollup are three different usability tests, not one.
- Run load tests at your actual peak, then stress-test at 2-3x that peak — most platforms fail quietly past 2x, well before they fail loudly.
- Test degraded-connectivity scenarios explicitly — simulate the actual bandwidth and latency of your most remote site, not your head-office connection.
- Re-run accessibility checks after every major UI release, not just at initial launch — regressions creep back in.
- Track your own fleet's physical availability rate against the 88%+ benchmark that OPSIMA documents for world-class operations with mature predictive-maintenance programmes, and your PM schedule compliance against their 85%+ benchmark, and your reactive-maintenance share against their sub-20% target (OPSIMA) — recalculate these quarterly from your own maintenance logs, since they will drift as your fleet ages or expands.
- Stage every UI change to a subset of sites before a fleet-wide push, and keep a rollback path that doesn't require a site visit.
Supported by an API-driven architecture:
Farmonaut Mining Performance Data API
(developer documentation)
— integrate real-time mining performance data into custom dashboards, analytics tools, and enterprise systems.


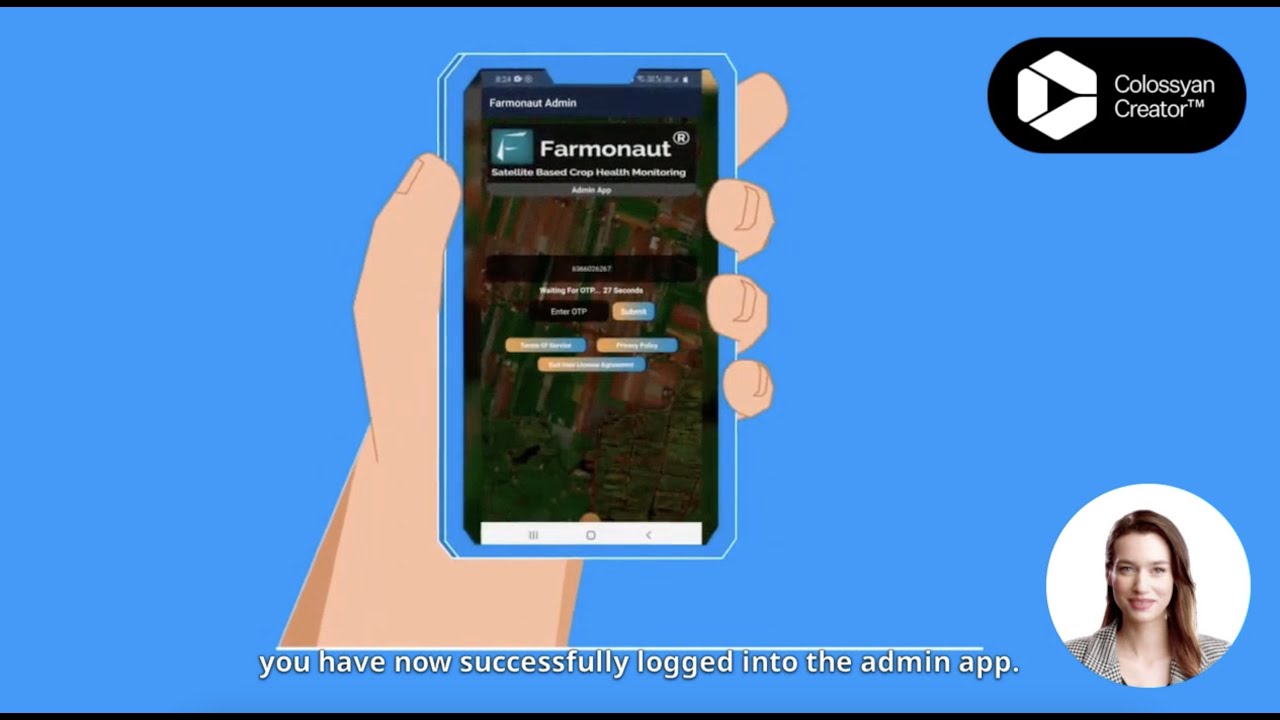
For large-scale field, mine, and asset monitoring: explore the Large Scale Farm & Mining Management App.
Farmonaut Mining Solutions: Access & Subscription
Subscription plans are available for individual operators, larger operations, and regulatory bodies. Choose a plan that matches your site's scale and data needs:
Frequently Asked Questions
What is mining equipment performance data usability testing?
It's the process of validating whether performance data collected from drilling rigs, haul trucks, crushers, and excavators is clear, relevant, and actionable for the people who need to act on it — operators, maintenance crews, and managers — tested with real users on real field devices, not just reviewed on paper.
What's the difference between load testing and stress testing for a mining data platform?
Load testing confirms the platform handles its expected peak — for example, every machine on a site reporting during a shift change — without slowing down. Stress testing pushes past that peak, often to 2-3x expected volume, to see whether the system degrades gracefully or fails outright.
How much does mining equipment downtime actually cost?
Estimates range from $5,000 to $100,000 per hour depending on operation scale and equipment class, with high-production assets like large shovels running closer to $130,000 per hour, and an average cost of $180,000 per incident across equipment types, per UES Systems, MapTrack, and Ultimo analyses. Open-pit queue formation can amplify the fleet-wide cost of a single downtime event by 3 to 5 times, per HonestDig.
What accessibility standard should a mining dashboard meet?
No mining-specific accessibility standard is currently published; WCAG 2.1 AA is the reasonable working baseline, layered with mining-specific checks such as non-color-dependent alerts and visual backups for audio alarms given cab and shop-floor noise levels.
Is there a public benchmark for mining fleet reliability I can compare against?
Yes — OPSIMA documents that world-class mining operations with mature predictive-maintenance programmes achieve physical availability above 88%, PM schedule compliance above 85%, and keep reactive (unplanned) maintenance below 20% of total maintenance activity. Calculate the same three ratios from your own maintenance logs quarterly to see where your fleet sits against that benchmark.
Does MSHA regulate mining data-dashboard software?
No — MSHA's 30 CFR Parts 6-36 regulate the approval and certification of the physical mining equipment itself, not the software or dashboards analyzing its data. The one intersection is that MSHA's Part 18 rules (updated December 2024 to incorporate 8 ANSI standards) govern approval of electric motor-driven equipment and accessories, which can include the sensors your data pipeline depends on.
The Bottom Line
Usability testing and scalability testing solve two different failure modes with the same downstream cost. A platform that collects perfect data nobody can interpret in time is functionally the same as a platform that can't stay online during a load spike — both leave a $5,000-to-$130,000-per-hour asset sitting idle while the right person figures out what's wrong. The fix in both cases is the same discipline: test with real users on real devices under real network conditions, benchmark your fleet against OPSIMA's published availability and maintenance-compliance figures, and re-run both usability and load tests every time the platform or the fleet changes meaningfully — not once at launch and never again.
Ready to Transform Mining Performance Data Usability?
See how Farmonaut's satellite-driven platform supports usability and scalability testing at every stage of a mining operation's growth.

 Southbridge & Wess PDC Ltd
 Qader Group
 Ileys General Trading
 SG Gold Mining LLC
 VRV Global Pte Ltd
 Omsri International FZE
 G.I.T.T.
 Jaunita Erss Ltd
 Almosi SARL
 SRK Consulting
 Berks Gold Limited
 Mwerezi Minerals Company Limited
 Mining SARL
 SenGold Invest SAS
 Sean Mining Limited
 NTS Group (Pty) Ltd
 Mine4Africa
 Lithspo Minerals Limited
