

Copper-gold mine · Fact sheet
Mount Milligan Mine Facts: Output, Reserves and Costs
Mount Milligan, owned by Centerra Gold, produced 147,581 ounces of gold and 50.5 million pounds of copper in 2025. This page gives reserves, costs, the Royal Gold stream and permit status, each with its filing date.
Key takeaways
- Mount Milligan produced 147,581 oz of gold and 50.5 million lb (about 22,900 t) of copper in 2025 (Centerra, February 2026).
- Reserves at 31 December 2025 were 470.3 Mt at 0.28 g/t gold and 0.17% copper (Centerra annual information form).
- Permits run to 2035; a 2025 pre-feasibility study plans mining to 2042 and stockpiles to 2045, which needs further approvals.
- Royal Gold buys 35% of the gold at US$435/oz and 18.75% of the copper at 15% of spot, which cuts realised prices.
- 2025 gold production cost was US$1,388/oz and AISC US$1,194/oz; 2026 guidance is US$1,450-1,550 and US$1,200-1,300.
In this article
- Mount Milligan mine facts at a glance
- Where Mount Milligan is and how it is supplied
- Geology: why Mount Milligan is a copper-gold porphyry
- How much gold and copper Mount Milligan produces
- Mill throughput, recovery and the process
- Reserves and the life-of-mine plan
- Costs and capital at Mount Milligan
- How the Royal Gold stream works
- Permits, tailings, water and reclamation
- Jobs and First Nations agreements
- Exploration and technology at the site
- Risks and what to check
- Frequently asked questions
Mount Milligan mine facts at a glance
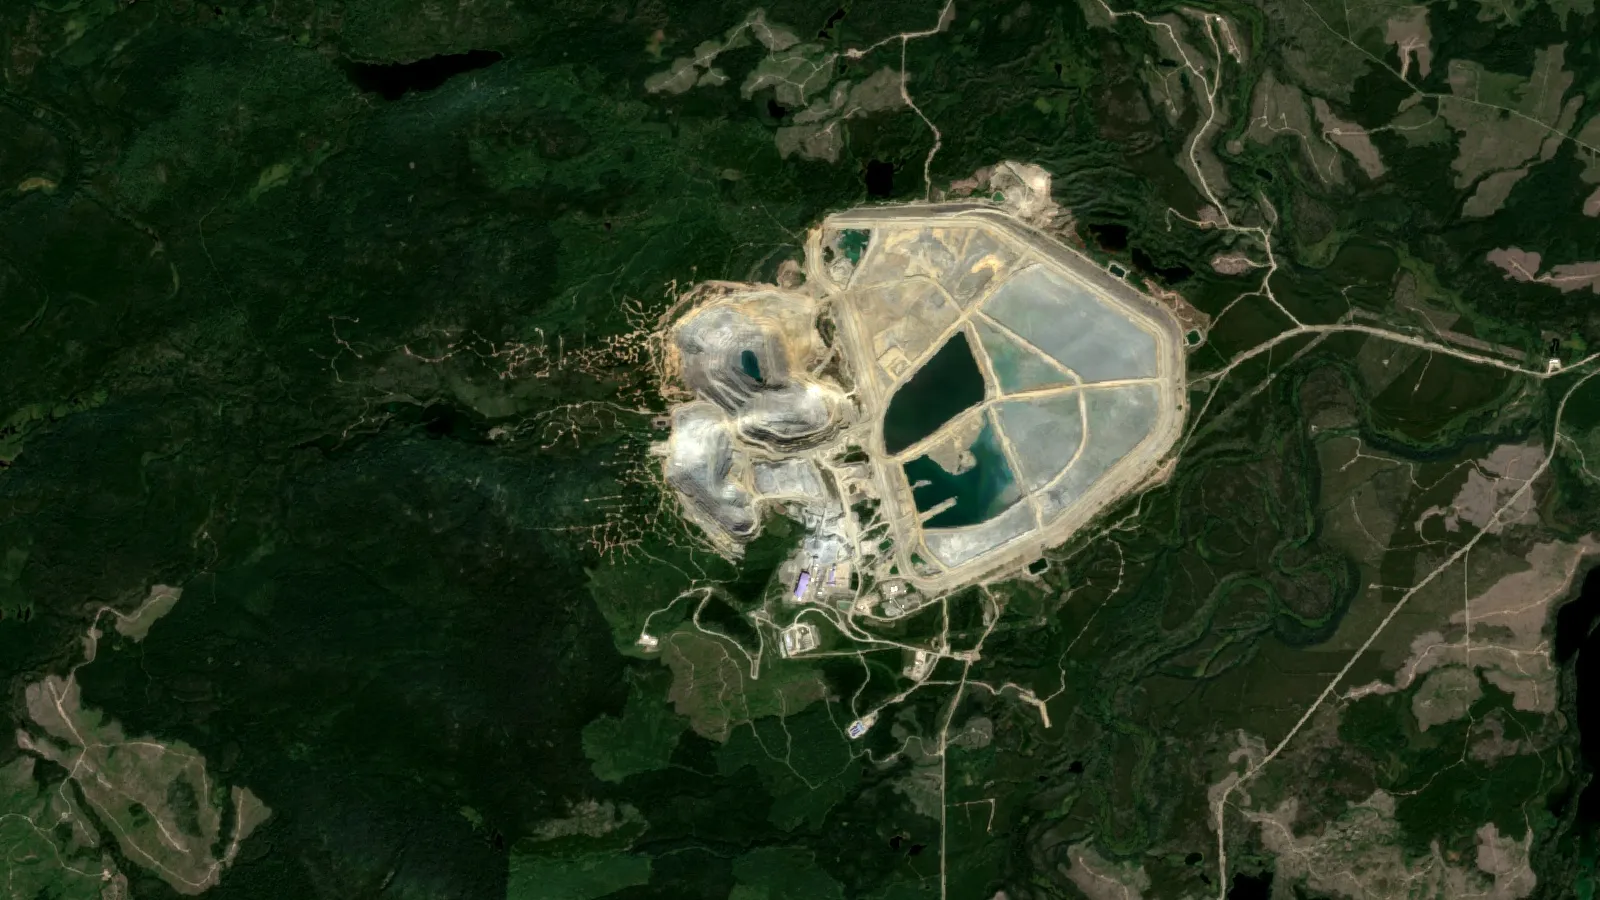
Mount Milligan is an open-pit copper-gold mine in north-central British Columbia, owned 100% by Centerra Gold. In 2025 it produced 147,581 ounces of gold and 50.5 million pounds of copper, about 22,900 tonnes (Centerra Q4 2025 results). Copper output is therefore about 23,000 tonnes a year,.
A 2025 pre-feasibility study (PFS) extends the mine plan to 2045. The permits in hand, however, run to 2035, so the longer plan still needs further approvals (Government of British Columbia, January 2026).
| Item | Figure | Source and date |
|---|---|---|
| Owner and operator | Centerra Gold (TSX: CG, NYSE: CGAU), 100% | Centerra MD&A, December 2025 |
| Gold produced | 147,581 oz | Centerra, calendar 2025 |
| Copper produced | 50.5 million lb (about 22,900 t) | Centerra, calendar 2025 |
| 2026 guidance | 140,000 to 155,000 oz gold; 50 to 60 million lb copper | Centerra, February 2026 |
| Reserves | 470.3 Mt at 0.28 g/t gold and 0.17% copper | Centerra annual information form, 31 December 2025 |
| Contained metal in reserves | 4.29 million oz gold; 1.72 billion lb copper | Same |
| Permitted life | To 2035; PFS plan to 2045 | Government of British Columbia, January 2026 |
| Employees | 645 | Centerra annual information form for 2025 |
Grade is the metal content of the rock. Gold grade is quoted in grams per tonne (g/t); copper grade in percent. A grade of 0.28 g/t gold is low by hard-rock gold standards. The mine works because it moves a very large volume of ore and sells copper as well as gold from the same rock.
Where Mount Milligan is and how it is supplied
The mine lies in the Omineca Mining Division, about 155 km northwest of Prince George (straight-line distance), with Fort St. James and Mackenzie within daily commuting range. The road distance from Prince George is 253 km (Centerra annual information form for 2025). British Columbia’s government describes it as about 90 km northeast of Fort St. James.
Power comes from BC Hydro over a 91-km line. Concentrate, the copper-gold product from the mill, is trucked to Mackenzie, railed on the Canadian National line to Vancouver Wharves in North Vancouver and loaded onto bulk carriers. Sales therefore depend on ship timing: Centerra said weather-related logistics disruption in late December 2025 left Q4 sales below production, and it expects that gap to reverse in 2026.
History in brief: Terrane Metals was acquired by Thompson Creek Metals in October 2010, the mine reached commercial production on 18 February 2014, and Centerra took it over on 20 October 2016 by buying Thompson Creek Metals (same annual information form).
Geology: why Mount Milligan is a copper-gold porphyry
A porphyry deposit forms when hot fluids from a cooling intrusion spread copper, and sometimes gold, through a large volume of surrounding rock in thin veinlets. Porphyry copper deposits supply about 60% of the world’s copper, and the USGS lists giant deposits in western Canada among them (USGS Fact Sheet 2014-3004). For a wider explanation see our guide to porphyry copper deposits, their alteration and grades.
Mount Milligan sits in the Quesnel Terrane. The host rocks are mainly Upper Triassic Witch Lake volcanic rocks, intruded by the Mount Milligan intrusive complex. The deposits are classed as silica-saturated alkalic copper-gold porphyries, linked to the MBX, Saddle, Southern Star and Goldmark monzonite stocks (a stock is a small intrusion). Two styles occur: early porphyry gold-copper mineralisation, and a later style rich in gold but low in copper (Centerra annual information form, as above). The PFS leaves the South Boundary zone out of the resource because its high-gold, low-copper mineralogy and pyrite make recovery harder (Centerra PFS release, 11 September 2025).
The deposit is also a textbook case for geophysics. The USGS uses Mount Milligan to show how resistivity, induced polarisation (IP) and magnetic data were combined in a 1997 study. Chargeability followed chalcopyrite and pyrite tied to potassic alteration near the monzonite stock, and the strongest chargeability was expected slightly outboard of the copper (USGS Scientific Investigations Report 2010-5070-B). Satellites cannot see that buried signature, but they can map surface clay and iron-oxide alteration over similar ground.

▶ Explains how satellites map the iron stains, clay and faults that surround gold systems. · 4:25
How much gold and copper Mount Milligan produces
Gold is the larger revenue line. In 2025 payable gold sales were 140,720 ounces worth US$367.0 million, against US$198.2 million for 50.0 million pounds of payable copper (annual information form, 100% basis, before the Royal Gold stream described below). Payable metal is the part the smelter pays for, which is why it differs from the milled output.
Chart
Metal sales, 2025
Payable metal sold, US$ million, 100% basis
Recoveries are modest. Gold recovery was 60.3% and copper recovery 75.8% in 2025, against PFS life-of-mine averages of 64.8% and 78.0% (Centerra MD&A and PFS release). The 2026 guidance of 140,000 to 155,000 ounces of gold and 50 to 60 million pounds of copper assumes grades and throughput similar to 2025. Gold is weighted to the second and third quarters by mine sequencing, with about 20% of annual gold in the first quarter, while copper is expected evenly through the year.
Two planned mill shutdowns in the first and third quarters of 2026 reline the SAG and ball mills, the big rotating drums that grind the ore.
Mill throughput, recovery and the process
Mining is by conventional truck and shovel: drill, blast, load and haul. The ore goes to a flotation plant that makes a copper-gold concentrate. Flotation uses air bubbles in a reagent bath so that sulphide minerals float and the barren rock sinks. The PFS puts the life-of-mine strip ratio, waste moved per tonne of ore, at about 1.0, and plans to place potentially acid-generating waste back in the pit.
Chart
Mill throughput against capacity
Tonnes of ore per day
The plant is designed for 62,500 tonnes per day (tpd) and the permit allows an annual average of 66,500 tpd. Fourth-quarter 2025 throughput averaged 57,977 tpd. The PFS plans a roughly 10% increase to 66,300 tpd through ball-mill motor upgrades and extra flotation cells, which should also add about 1% to recovery (annual information form and Centerra Q4 2025 results; the capital is spent in 2028 and the higher rate is planned from 2029).
Reserves and the life-of-mine plan
Reserves are the part of a resource that can be mined profitably under stated assumptions. At 30 June 2025, the PFS reserve was 483.2 million tonnes (Mt) at 0.28 g/t gold and 0.16% copper, holding 4.4 million ounces of gold and 1.7 billion pounds of copper, up 56% and 52% on year-end 2024. By 31 December 2025, after a year of mining, the reserve was 470.3 Mt at 0.28 g/t gold, with 4,294 thousand ounces of gold and 1,716 million pounds of copper (annual information form).
The PFS mine plan averages 150,000 ounces of gold and 69 million pounds of copper a year from 2026 to 2042. Low-grade stockpiles are processed from 2043 to 2045. Mineralisation stays open to the west of the pit, so exploration continues (see below).
Costs and capital at Mount Milligan
In 2025 gold production cost was US$1,388 per ounce and all-in sustaining cost (AISC) on a by-product basis was US$1,194 per ounce. AISC adds sustaining capital and similar items to operating cost, and “by-product” means copper sales are credited against gold cost. Copper production cost was US$2.11 per pound. The mine generated US$245.7 million of cash flow from operations in 2025, and US$168.4 million after capital spending (Centerra MD&A).
Chart
Where the PFS growth capital goes
US$ million, total about 186
Chart
Unit costs: 2025 actual and 2026 guidance
US$ per ounce of gold; 2026 is the midpoint of the guided range
For 2026 Centerra guides to US$1,450 to 1,550 per ounce for production cost and US$1,200 to 1,300 for AISC, with US$115 to 135 million of capital spending at the mine.
The PFS adds about US$186 million of growth capital, most of it not needed until the early-to-mid 2030s: US$114 million for a second tailings facility in 2032 and 2033, US$36 million for plant upgrades, US$28 million for five haul trucks and US$7 million for site infrastructure. At the PFS long-term prices of US$2,600 per ounce gold and US$4.30 per pound copper, after-tax net present value at a 5% discount rate is about US$1.5 billion; at US$4,500 gold and US$6.00 copper it is about US$3.6 billion.
How the Royal Gold stream works
A stream is a financing deal in which a buyer pays up front, then buys a share of the mine’s future metal at a low fixed price. Royal Gold may buy 35% of Mount Milligan’s payable gold at US$435 per ounce and 18.75% of payable copper at 15% of the spot price per tonne delivered (Royal Gold, 11 September 2025). In September 2025 Royal Gold said it had recovered more than 150% of its original advance.
The effect on revenue is large. Using market prices of US$4,500 per ounce and US$5.00 per pound, Centerra expects 2026 realised prices of about US$3,077 per ounce of gold and US$4.20 per pound of copper. In 2025 the realised averages were US$2,608 and US$3.96. A 2024 cost-support agreement with Royal Gold raises what Royal Gold pays once set delivery thresholds are passed (375,000 oz of gold or 30,000 t of copper from 2024, expected around 2030): combined gold payments become the lower of US$850/oz and 50% of spot, then US$1,050/oz and 66% of spot after a second threshold. From no later than 2036 Royal Gold also takes 5% of Mount Milligan’s cash flow after capital spending, rising to 10% (Royal Gold, 11 September 2025). The calculator below uses only the basic terms that apply today.
Calculator
What does the stream cost the mine?
Enter output and prices to see the revenue given up to Royal Gold.
- Gold revenue given up (US$): $204,249,990
- Copper revenue given up (US$): $38,230,078
- Gold price Centerra keeps (US$/oz): $3,077
Example values only, not benchmarks. Prices are examples, use today’s price. Stream terms from Royal Gold and Centerra (2025): 35% of gold at US$435/oz; 18.75% of copper at 15% of spot. The 2024 cost-support agreement and smelter deductions are not included. Streamed metal is payable metal: 97% of gold and 95% of copper. Defaults are rounded 2025 output.
Permits, tailings, water and reclamation
British Columbia’s Environmental Assessment Office amended the mine’s certificate in January 2026 to allow operation to 2035 and a throughput of 66,500 tpd. It added an 80-hectare disturbance area for construction material, a new waste-rock stockpile and a tailings dam raised from 1,095 to 1,121 m above sea level. The province found that continuing would not create significant new impacts if mitigated. New conditions cover First Nations participation in environmental monitoring, wildlife-mortality monitoring along transport routes, and a wetland replacement plan at closure (Government of British Columbia, 5 January 2026).
Tailings are the finely ground waste left after flotation. The existing facility has a centreline embankment about 71 m high. A second facility north of it would hold 262 Mt, about 11.5 years of production, with construction planned from 2032. Process water comes mainly from reclaimed tailings water, thickener overflow, make-up water from Philip Lake and Meadows Creek, and dewatering wells. Reclamation security of C$51.3 million is posted (annual information form).

▶ Explains the seven main environmental impacts of mining in plain words. · 2:31
Jobs and First Nations agreements
The annual information form lists 645 employees. Centerra has a Socio-Economic Agreement with the McLeod Lake First Nation and an Impact Benefit Agreement with Nak’azdli Whut’en. The payment terms are confidential. The filings describe employment and training, environmental management and business contracts such as concentrate hauling, earthworks and catering. Tsay Keh Dene First Nation sits on the Mount Milligan Community Sustainability Committee with those two nations and Takla First Nation, but it is not named as a party to a Mount Milligan agreement.
Exploration and technology at the site
Centerra drilled 83 holes (about 23 km) in the first quarter of 2025 and 117 holes (about 33 km) in the third, and spent US$46.6 million on exploration company-wide in 2025. Work in 2026 targets the western extension and infill drilling between Goldmark and North Slope, plus the Saddle West and Boundary areas (Centerra MD&A). The only fleet change in the PFS plan is five additional conventional haul trucks.
For explorers working similar ground in British Columbia, satellite data can screen a licence before geophysics and drilling. Spectral bands show clay and iron-oxide alteration, and structure maps show faults. Farmonaut states that satellite screening can cut early exploration cost by up to 80-85%, and describes this in its satellite-based mineral detection service; results are exploration targets, not a resource estimate. Related reading: satellite signals over the Golden Triangle, gold mining in British Columbia and first cell claims and Canadian exploration spending. To request a site report, use the mining query form or contact us.

▶ Shows satellite imagery and soil geochemistry used on copper and gold targets in British Columbia. · 3:11
Risks and what to check
- Metal prices: the stream means Centerra keeps less of any price rise on 35% of gold and 18.75% of copper.
- Permits: the permitted life is to 2035, while the mine plan runs to 2045.
- Royalty dispute: on 13 January 2026 the B.C. Court of Appeal ruled that a 2% royalty held by H.R.S. Resources must be calculated on the full concentrate proceeds. Centerra had accrued US$23.2 million at year-end 2025, paid about US$22.4 million to H.R.S. in the first quarter of 2026, and has sought leave to appeal to the Supreme Court of Canada, with a decision awaited. If the appeal succeeds it may recover some or all of the amount (Centerra first-quarter 2026 MD&A).
- Water: Centerra lists sufficient water to reach expected throughput as a risk.
- Tailings capacity: the second facility must be built from 2032 for the extended plan.
- Logistics: shipping delays move sales between quarters.
Not investment advice. Figures are from Centerra’s February 2026 results; its second-quarter 2026 report (29 July 2026) kept the Mount Milligan 2026 guidance unchanged.
If this topic matters to you, read Freeport-McMoRan vs Southern Copper: Reserves and Costs next.
Related reading on this site: Pueblo Viejo Mine, Dominican Republic: Facts and Output.
Frequently asked questions
Who owns Mount Milligan?
Centerra Gold owns 100% through Thompson Creek Metals Company. Royal Gold holds the stream on 35% of gold and 18.75% of copper, with a cash-flow interest from 2036, and H.R.S. Resources holds a 2% royalty.
Where is the Mount Milligan mine?
In north-central British Columbia, about 155 km northwest of Prince George in a straight line and about 90 km northeast of Fort St. James.
How much gold does Mount Milligan produce?
147,581 ounces in 2025, with 2026 guidance of 140,000 to 155,000 ounces.
How much copper does Mount Milligan produce?
50.5 million pounds, about 22,900 tonnes, in 2025. Guidance for 2026 is 50 to 60 million pounds.
What type of deposit is Mount Milligan?
A silica-saturated alkalic copper-gold porphyry in the Quesnel Terrane, with an additional late high-gold, low-copper style.
When did Mount Milligan start producing?
It reached commercial production on 18 February 2014. Centerra has owned it since 20 October 2016.
How long will the mine operate?
Permits allow operation to 2035. The 2025 pre-feasibility study plans mining to 2042 and stockpile processing to 2045, which needs further approvals.
What are the reserves at Mount Milligan?
At 31 December 2025: 470.3 million tonnes at 0.28 g/t gold and 0.17% copper, containing about 4.29 million ounces of gold and 1.72 billion pounds of copper.
How many people work there?
Centerra’s 2025 annual information form lists 645 employees.
Which First Nations have agreements with the mine?
The McLeod Lake First Nation (Socio-Economic Agreement) and Nak’azdli Whut’en (Impact Benefit Agreement). Terms are confidential.
What does the Royal Gold stream mean for revenue?
For the streamed share, Centerra receives US$435 per ounce of gold and 15% of the copper spot price instead of the market price.
This page is for information only. It is not investment advice. Production, reserves and guidance are as reported by Centerra Gold and may change.
Farmonaut mining
Map your mining site from space
Request a satellite mineral detection quote for your licence area.

Mining Pro sample view, synthetic data
Keep reading
Sources
- Centerra Gold, fourth quarter and full year 2025 results (February 2026): s205.q4cdn.com
- Centerra Gold, 2025 management’s discussion and analysis: s205.q4cdn.com
- Centerra Gold, annual information form for 2025 (Form 40-F exhibit): sec.gov
- Centerra Gold, Mount Milligan pre-feasibility study release (11 September 2025): thecanadianpressnews.ca
- Government of British Columbia, Mount Milligan certificate amendment (5 January 2026): news.gov.bc.ca
- Royal Gold, Mount Milligan life-of-mine release (11 September 2025): s28.q4cdn.com
- Royal Gold, fourth quarter 2025 earnings call highlights: finance.yahoo.com
- USGS, Scientific Investigations Report 2010-5070-B, geophysical methods: pubs.usgs.gov
- USGS, Fact Sheet 2014-3004, global copper resources: pubs.usgs.gov
- Centerra Gold, first quarter 2026 management’s discussion and analysis: sec.gov
Discussion
Questions, corrections or field experience? Share them below. First-time comments are reviewed before they appear, and your email is never published.
No comments yet. Be the first to add a question or your experience.

 Klusetic Mining Investments
 Mine4Africa
 Lithspo Minerals Limited
 Tintina Mining Group
 Dalgety Minerals Pty Ltd
 Vortex Minerals Pty Ltd
 Faith At Work (Pty) Ltd
 Geotech Mining Solutions plc
 Vulcan International Limited
 Kidepo Associates
 GKY Mining
 Alkimy SARL
 Double A Trading
 GemSprout Metals Limited
 Qader Group
 Ileys General Trading
 SG Gold Mining LLC
 VRV Global Pte Ltd
 Omsri International FZE
 G.I.T.T.
 Jaunita Erss Ltd
 Almosi SARL
 SRK Consulting
 Berks Gold Limited
 Mwerezi Minerals Company Limited











