

Northern Dynasty Minerals · Price and project guide
Northern Dynasty Stock: Price Chart and What Moves It
Northern Dynasty trades as NDM on the TSX and NAK on NYSE American. NAK closed at US$0.95 on 14 October 2026, a 52-week closing low. The price follows one court ruling on the EPA veto of the Pebble copper-gold project, still pending after oral arguments on 25 June 2026.
Key takeaways
- NAK closed at US$0.95 on 14 October 2026, down from a 2-year closing high of US$2.76 on 14 October 2025 (Yahoo Finance; StockAnalysis).
- On 17 February 2026 the Department of Justice filed a brief defending the EPA veto; NAK fell about 39% in one day, from US$2.03 to US$1.23.
- Oral arguments in the veto case were held on 25 June 2026; the company’s news page showed no ruling as of 16 October 2026.
- Pebble’s measured and indicated resource is 57 billion lb of copper and 71 million oz of gold; the 2023 preliminary economic assessment plans about a tenth of that over 20 years (company).
- Northern Dynasty (Canada, no producing mine) is a different company from Northern Star Resources (Australia, 1,543,000 oz of gold sold in the year to June 2026, preliminary).
In this article
- Key facts at a glance
- NAK price history in numbers
- What moves the share price
- Pebble permit fight: timeline of the court case
- How big is the Pebble deposit?
- Environmental case: what the EPA and the company each say
- Northern Dynasty vs Northern Star: two different companies
- Copper and gold prices behind the story
- Compare Pebble's in-ground metal with its market value
- How to research this stock yourself in 6 steps
- Frequently asked questions
Northern Dynasty Minerals trades as NDM on the Toronto Stock Exchange and as NAK on NYSE American. NAK closed at US$0.95 on 14 October 2026, its lowest close in 52 weeks. The company has no producing mine. Its main asset is the Pebble copper-gold project in southwest Alaska, and the share price mostly follows one question: will a federal court set aside the EPA veto that blocks the project? Oral arguments in that case were held on 25 June 2026, and the company’s news page showed no ruling as of 16 October 2026.
This page gives the price history with dates, the court and permit timeline, the size of the deposit, and a calculator that sets the metal in the ground against the company’s market value. It states facts and sources. It is not investment advice. Terms used below: market capitalisation (market cap) is the share price multiplied by the number of shares. Measured, indicated and inferred are the three confidence levels of a mineral resource estimate, from highest to lowest. A going concern note is an auditor’s remark that a company’s ability to keep operating depends on future funding.
Key facts at a glance
The table collects the basic facts from the company’s own releases and from market data pages. Market data changes every trading day, so each price carries its date.
| Item | Detail |
|---|---|
| Company | Northern Dynasty Minerals Ltd., an exploration and development company based in Vancouver, Canada (company release, 26 June 2026) |
| Tickers | TSX: NDM (Canadian dollars); NYSE American: NAK (US dollars) |
| Main asset | 100% of the Pebble Project through its Alaska-based subsidiary Pebble Limited Partnership: 1,840 mineral claims, 200 miles from Anchorage and 125 miles from Bristol Bay (same release) |
| NAK close, 14 October 2026 | US$0.95, down 7.2% on the day (StockAnalysis); the stock traded near US$0.92 intraday on 15 October |
| 52-week intraday range | US$0.88 (intraday low on 15 October, session still open when checked) to US$2.85 (Yahoo Finance price data) |
| Market cap, 12 October 2026 | About US$616 million on 12 October, when NAK traded near US$1.09; at US$0.95 the same share count gives about US$540 million (MarketBeat) |
| Auditor’s note | The audit report on the 2025 financial statements carried a going concern emphasis of matter, as in previous years (company release, 1 April 2026) |
| Latest company release | 31 August 2026: director Wayne Kirk stepped down from the board for personal reasons (company news) |
NAK price history in numbers
The chart below plots month-end closes for NAK in US dollars. The stock ended December 2024 at US$0.58 and December 2025 at US$1.97. The highest close in the two years to 15 October 2026 was US$2.76, on 14 October 2025 (one year and one day before 15 October 2026) (Yahoo Finance).
Chart
NAK month-end close
US dollars, NYSE American; every second month-end close, then the 15 October 2026 price
The sharpest one-day fall in the period came after the US Department of Justice (DOJ) filed a brief on 17 February 2026 that defends the EPA veto. NAK closed at US$2.03 on 17 February and US$1.23 on 18 February, a drop of about 39%. On the Toronto exchange the stock fell by as much as 45% during the session, to C$1.52, and the company’s market value was about C$1 billion at midday (MINING.COM, 18 February 2026).
The recent slide has no matching company news. NAK closed at US$1.68 at the end of August 2026, US$1.37 on 30 September and US$0.95 on 14 October, a fall of about 31% in 10 trading days. The company’s last news release before 16 October was the 31 August board change. A market data page reported a new 52-week low on 12 October (MarketBeat, 12 October 2026). Price moves without news are normal for a stock whose value rests on a legal outcome.
What moves the share price
The company earns no revenue from metal sales, so the price reflects expectations about permits, courts, money and metal prices. These are the items to follow, in order of weight.
- The summary judgment ruling. In summary judgment a judge decides on the written legal record, with no trial. The case is Northern Dynasty Minerals Ltd. et al. v. EPA, No. 3:24-cv-00059, in the US District Court for Alaska. After the hearing the company said the matter was ready for the judge’s decision. No date for a ruling has been published.
- Settlement talks. On 19 February 2026 the chief executive said the company would continue to explore a settlement with the EPA while pushing for a court decision.
- The Army Corps permit denial. A veto ruling would not be the last step. The Army Corps of Engineers denied the project’s main federal permit in November 2020, and the company says the Corps declined to take up the remand because of the EPA veto.
- Money. The 2025 audit report carries the going concern note quoted in the table above. A company without revenue may need to raise money by selling new shares, which can dilute existing holders. The financial statements on SEDAR+ and SEC EDGAR show cash and spending.
- Compensation claims. Northern Dynasty and the State of Alaska both filed takings suits (claims that a government action took the value of property without payment) in the Court of Federal Claims in March 2024, which are stayed. Alaska’s claim asks for US$700 billion (Harvard Environmental and Energy Law Program tracker).
- Copper and gold prices. A higher metal price raises the value of any future mine plan, though not the chance of getting a permit. Prices are covered further down.
Pebble permit fight: timeline of the court case
The project has been under federal review for more than a decade. This table lists the main dated steps from public sources.
| Date | Event |
|---|---|
| January 2014 | EPA releases its final assessment of large-scale mining effects on the Nushagak and Kvichak river salmon systems (EPA Bristol Bay page) |
| 2019 | EPA withdraws its earlier proposed restriction on the Pebble site (Harvard EELP) |
| 25 November 2020 | The Army Corps of Engineers denies the Clean Water Act permit (Alaska Public Media) |
| 30 January 2023 | EPA issues its Final Determination under section 404(c) of the Clean Water Act, which effectively blocks the project (EPA) |
| April 2023 | The Corps’ Pacific Ocean Division sends the permit decision back to the Alaska District; the Corps later declines to re-open it, the company says (company permitting page) |
| 8 January 2024 | The US Supreme Court denies Alaska’s request to bring its own suit against the EPA directly (Harvard EELP) |
| March 2024 | The company files two actions: one to vacate the veto, one for a takings claim (company) |
| 17 July 2025 | The administration says it will defend the Corps’ 2020 decision and the EPA’s 2023 determination in court, while talks may continue (Harvard EELP) |
| 17 February 2026 | DOJ files its brief supporting the veto (company release) |
| 25 June 2026 | Oral arguments in Alaska federal court; ruling pending (company release) |
How big is the Pebble deposit?
The company reports the Pebble resource at a cut-off of 0.3% copper equivalent (CuEq). A cut-off grade is the lowest grade included in the estimate, and copper equivalent converts the other metals into copper terms so one number can be used. Grade is the amount of metal in the rock: percent (%) for copper, grams per tonne (g/t) for gold and silver, and parts per million (ppm) for molybdenum. These are the company’s figures as shown on its website on 16 October 2026 (the page does not date the estimate itself): company’s website.
Chart
Share of contained metal that the 20-year plan would recover
20-year recovered metal as % of contained measured and indicated metal
| Category | Tonnes | Cu | Au | Mo | Ag | Contained metal |
|---|---|---|---|---|---|---|
| Measured and indicated | 6.5 billion | 0.40% | 0.34 g/t | 240 ppm | 1.7 g/t | 57 billion lb copper, 71 million oz gold, 3.4 billion lb molybdenum, 345 million oz silver |
| Inferred | 4.5 billion | 0.25% | 0.25 g/t | 226 ppm | 1.2 g/t | 25 billion lb copper, 36 million oz gold, 2.2 billion lb molybdenum, 170 million oz silver |
The mine plan is much smaller than the resource. The company’s independent preliminary economic assessment (PEA), effective August 2023, describes a 20-year open pit of 180,000 tons per day. It would produce about 320 million lb of copper and 368,000 oz of gold a year, and over 20 years 6.4 billion lb of copper, 7.4 million oz of gold, 300 million lb of molybdenum and 37 million oz of silver (company, Economic Benefits page). A PEA is an early-stage study. This one includes inferred resources, which the company itself calls too speculative to count as reserves, and it states that development requires overturning the EPA veto.
Put against the resource, the plan recovers roughly a tenth of the contained metal, as the chart shows. The company says expansion cases could extend the mine life to as much as a century and extract slightly more than 70% of the resource. Any such step would need new permits.
Environmental case: what the EPA and the company each say
The dispute is about water and fish. The Bristol Bay watershed supports the largest sockeye salmon fishery in the world and is home to 25 federally recognized Tribal governments, according to the EPA. The EPA’s 2023 finding was that the mine would have unacceptable adverse effects on salmon fishery areas, and it said the mine would destroy more than 2,000 acres of wetlands (MINING.COM).
The company disagrees. It points to the project’s final environmental impact statement, which was led by the Army Corps with eight federal and three state cooperating agencies, and which it says found the project can co-exist with the fishery. It also says the proposed plan does not use cyanide, and that the 2023 US Supreme Court decision in Sackett v. EPA narrowed which wetlands fall under the Clean Water Act (all from the company’s permitting page). A judge, not either party, will decide how those arguments apply to the veto.

▶ A claymation explainer of the seven environmental impacts of mining, in plain words. · 2:31
Northern Dynasty vs Northern Star: two different companies
Searches for this stock often mix it up with Northern Star Resources. They are separate listed companies. Northern Star is an Australian gold producer on the ASX, and Northern Dynasty is a Canadian developer with no producing mine.
| Item | Northern Dynasty Minerals | Northern Star Resources |
|---|---|---|
| Tickers | TSX: NDM; NYSE American: NAK | ASX: NST |
| Stage | Exploration and development; no producing mine | Producer: 1,543,000 oz of gold sold in the year to June 2026 (preliminary) |
| Main assets | Pebble Project, Alaska (undeveloped) | Kalgoorlie (844,000 oz sold), Yandal (434,000 oz) and Pogo (265,000 oz), all preliminary |
| Cash position | Going concern note in the 2025 audit report | A$1,255 million unaudited cash and bullion at 30 June 2026 (unaudited), no corporate bank debt |
| Source | Company release | ASX announcement, 2 July 2026 |
Pogo is one of the operating gold mines in Interior Alaska listed by the Alaska Division of Geological and Geophysical Surveys. Pebble, by contrast, is in the Bristol Bay region of southwest Alaska. Producers and developers also differ in how they are valued: a producer is judged on ounces, costs and cash flow, a developer on whether it can get permits and funding. For other Canadian-listed names, see our comparison of Vancouver and Toronto mining companies.
Copper and gold prices behind the story
Pebble is a copper-gold project, so metal prices set the size of any prize. On 15 October 2026, December Comex copper traded near US$6.58 per pound, about 4.5% below the record settlement of US$6.89 set on 9 September (MINING.COM, 15 October 2026). The copper figure is an intraday futures quote, not a final settlement.
Chart
Pebble’s planned copper output next to national mine output
Thousand tonnes of copper a year; three selected countries, 2025 estimates (USGS mine output); Pebble is the 20-year plan average of recovered metal
The demand case is documented. S&P Global projects copper demand of 42 million tonnes by 2040, against a supply peak of 33 million tonnes in 2030 and a gap of 10 million tonnes by 2040 (S&P Global, 8 January 2026). In the United States, mine output was an estimated 1.0 million tonnes of copper in 2025 and net import reliance was 57% (USGS Mineral Commodity Summaries 2026).
The PEA’s average of 320 million lb of copper a year equals about 145,000 tonnes, or roughly 15% of 2025 US mine output, if the mine were permitted and built. The measured and indicated resource holds about 26 million tonnes of copper, but a resource is not a reserve, and USGS counts only reserves. For how porphyry copper deposits like Pebble form and are found, read our guide to porphyry copper deposits and the overview of copper deposit types and top countries.
▶ Follows the money from the ground up: exports, jobs, revenue and energy-transition minerals. · 5:03
Compare Pebble’s in-ground metal with its market value
The calculator sets the gross value of the measured and indicated copper and gold against the company’s market cap. The gap is large because in-ground metal is not a mine. Cost, recovery, tax, time and permits all sit between the two numbers. Enter your own prices and market cap.
Calculator
How does Pebble’s in-ground metal compare with the market cap?
Enter your own prices and market cap.
- Copper part (US$ billion): 370
- Gold part (US$ billion): 295
- Market cap as % of in-ground value: 0.08
Example values only. The 57 billion lb of copper and 71 million oz of gold are the company’s measured and indicated contained metal (Northern Dynasty website, 16 October 2026). The market cap default is about US$540 million: MarketBeat’s US$616 million for 12 October 2026 scaled to a US$0.95 close. Prices are inputs: example, use today’s price. Gross in-ground value ignores recovery, costs, tax, time, silver and molybdenum, and the permit; it is not a mine value or a share valuation. Money is in US dollars.
How to research this stock yourself in 6 steps
- Read the company’s news page for releases, and note the date of the last one. Anything older than a few weeks may be out of date.
- Open the Form 40-F (the annual report form a Canadian company files in the US) and the financial statements on SEC EDGAR, or the same documents on SEDAR+ for Canada. Read the cash balance, the going concern note and the risk factors.
- Read the EPA’s Bristol Bay page and the court filings summarised by the Harvard tracker, so you see the legal arguments from the government side as well as the company side.
- Check a dated price for NAK and NDM and note which currency each is quoted in. Compare two or more data providers if the numbers matter to you.
- Check copper and gold prices with a dated source, and ask whether the move in the stock tracks metals or tracks the case.
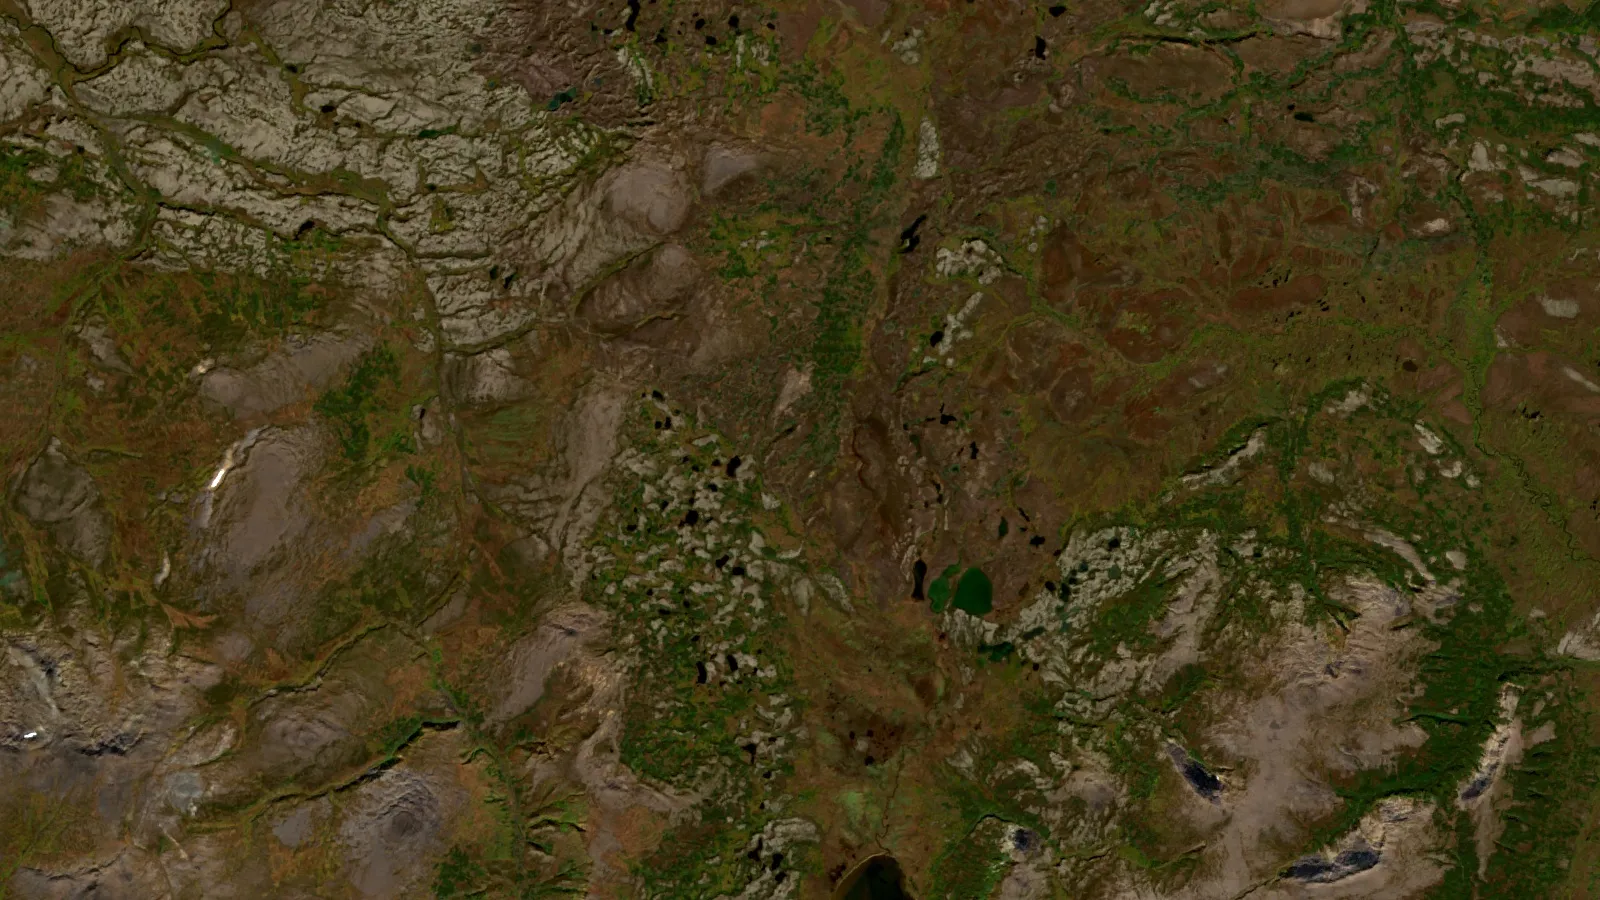
- Look at the ground. The Sentinel-2 image at the top of this page is a summer composite centred on the Pebble area. Satellite images show terrain, lakes and surface cover. They cannot show grade, and they do not show whether a project can be permitted.
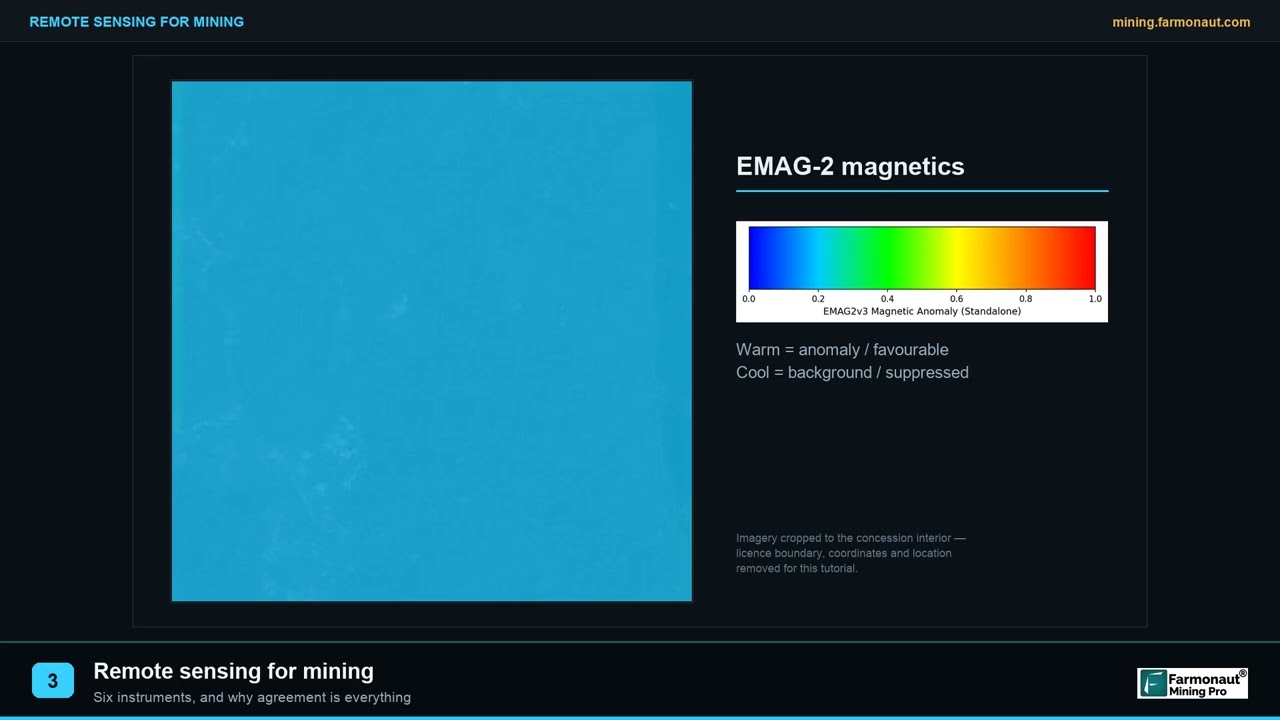
▶ Explains remote sensing for mining in three minutes, and why agreement between instruments matters. · 2:01
For readers who work on projects of their own, Farmonaut produces satellite-derived exploration targets from a licence boundary, as a step ahead of drilling and ahead of any resource estimate. That is a different job from reading a court docket, but the same discipline applies: check every number against its source and its date. For exploration spending across Canada, see mineral exploration spending in Canada.
If this topic matters to you, read Diamond Mines in the Northern Cape: Kareevlei, Finsch next.
Frequently asked questions
What is the Northern Dynasty ticker symbol?
The company trades as NDM on the Toronto Stock Exchange and as NAK on NYSE American, according to its June 2026 release.
Where does Northern Dynasty stock trade, and in which currency?
NDM trades on the TSX in Canadian dollars. NAK trades on NYSE American in US dollars. The two lines represent the same company, so their prices move together apart from exchange-rate differences.
What does Northern Dynasty own?
Its main asset is a 100% interest in 1,840 mineral claims in southwest Alaska, including the Pebble deposit, held through its subsidiary Pebble Limited Partnership. The company does not operate a producing mine.
Why did Northern Dynasty stock fall in February?
On 17 February 2026 the Department of Justice filed a brief defending the EPA veto of the project. NAK closed down about 39% the next day, from US$2.03 to US$1.23. The chief executive said he found the DOJ position surprising, given statements by the administration in support of Alaskan development and critical minerals (company release, 18 February 2026).
Has the EPA veto on the Pebble project been overturned?
No. The EPA issued its Final Determination on 30 January 2023, and the court challenge is pending after oral arguments on 25 June 2026. Even if the veto were set aside, the Army Corps’ denial of the project’s federal permit would still need to be resolved.
When will the court rule on the Pebble case?
No date has been announced. The company said after the hearing that the matter was ready for decision, and a judge can rule at any time. Watch the company’s news page and the court docket for No. 3:24-cv-00059.
How much copper and gold is in the Pebble deposit?
The company reports 57 billion lb of copper and 71 million oz of gold in the measured and indicated category, plus 25 billion lb of copper and 36 million oz of gold in the inferred category, at a 0.3% copper-equivalent cut-off. These are resources, not reserves.
Does Northern Dynasty earn revenue?
The company is an exploration and development company with no producing mine, so it does not sell metal. Its audit report for 2025 includes a going concern emphasis of matter. Details are in its annual filings.
Is Northern Dynasty the same company as Northern Star?
No. Northern Star Resources (ASX: NST) is an Australian gold producer with the Kalgoorlie, Yandal and Pogo operations. Northern Dynasty Minerals (TSX: NDM, NYSE American: NAK) is a Canadian developer whose asset is the Pebble Project.
Can satellites show whether Pebble is worth mining?
No. Satellites can map terrain, water and surface minerals, and they help plan exploration. Grade, tonnage and economics come from drilling and engineering studies, and the permit decision is a legal matter.
Where can I find the official filings?
Canadian filings are on SEDAR+ and US filings are on SEC EDGAR. The company also lists its releases and presentations on its own website, and the EPA keeps a Bristol Bay page with its Final Determination.
Is this page investment advice?
No. It reports dated facts from public sources. Share prices can fall as well as rise, and a stock that depends on one court ruling can move sharply in either direction.
This page is for information only. It is not investment or legal advice. Share prices can fall as well as rise, and a stock that depends on one court ruling can move sharply in either direction.
Farmonaut mining
Screen a project area from space
Investors and consultants can send a licence boundary as KML, KMZ or a polygon and receive satellite-derived exploration targets, ahead of any resource estimate.

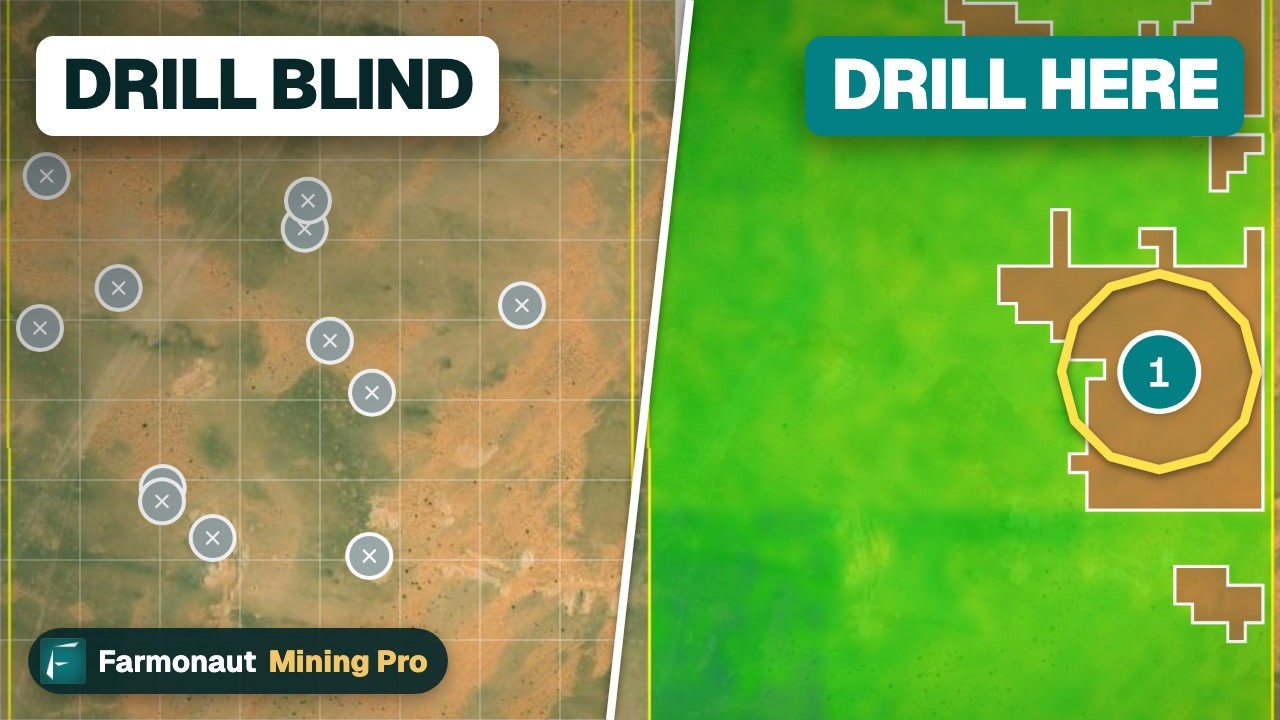
Mining Pro sample view, synthetic data
Keep reading

Sources
- Northern Dynasty Minerals, 2026 news releases: northerndynastyminerals.com
- Northern Dynasty, Reports Oral Arguments Held (26 June 2026): northerndynastyminerals.com
- Northern Dynasty, Response to DOJ Brief (19 February 2026): northerndynastyminerals.com
- Northern Dynasty, Update on Summary Judgement Case (18 February 2026): northerndynastyminerals.com
- Northern Dynasty, Makes Annual Filings (1 April 2026): northerndynastyminerals.com
- Northern Dynasty, Change to Board of Directors (31 August 2026): northerndynastyminerals.com
- Northern Dynasty, Economic Benefits (2023 PEA summary): northerndynastyminerals.com
- Northern Dynasty, Permitting: northerndynastyminerals.com
- US EPA, Bristol Bay: epa.gov
- Harvard Environmental and Energy Law Program, Bristol Bay and the Pebble Mine tracker: eelp.law.harvard.edu
- Alaska Public Media, Army Corps denies permit for Pebble Mine (25 November 2020): alaskapublic.org
- MINING.COM, Northern Dynasty tumbles on DOJ brief backing Pebble veto (18 February 2026): mining.com
- StockAnalysis, NAK price history: stockanalysis.com
- Yahoo Finance, NAK historical data: finance.yahoo.com
- MarketBeat, NAK sets new 1-year low (12 October 2026): marketbeat.com
- MINING.COM, Copper price falls for third day (15 October 2026): mining.com
- S&P Global, Copper in the Age of AI press release (8 January 2026): press.spglobal.com
- USGS, Mineral Commodity Summaries 2026: Copper: pubs.usgs.gov
- Northern Star Resources, ASX production update (2 July 2026): announcements.asx.com.au
- Alaska DGGS, Alaska’s Mineral Industry: dggs.alaska.gov
- SEC EDGAR: sec.gov
- SEDAR+: sedarplus.ca
Discussion
Questions, corrections or field experience? Share them below. First-time comments are reviewed before they appear, and your email is never published.
No comments yet. Be the first to add a question or your experience.

 Almosi SARL
 SRK Consulting
 Berks Gold Limited
 Mwerezi Minerals Company Limited
 Mining SARL
 SenGold Invest SAS
 Sean Mining Limited
 NTS Group (Pty) Ltd
 Mine4Africa
 Lithspo Minerals Limited
 Tintina Mining Group
 Dalgety Minerals Pty Ltd
 Vortex Minerals Pty Ltd
 Faith At Work (Pty) Ltd
 Geotech Mining Solutions plc

 Licence holder · Nigeria · Gold + lithium










