

Ore reserve estimation · Methods guide
Ore Reserve Estimation: Polygon, Triangle, Section Methods
This guide turns drill intercepts into tonnes and grade with polygon, triangle and cross-section formulas. A reserve also needs dilution, recovery and a feasibility-level study.
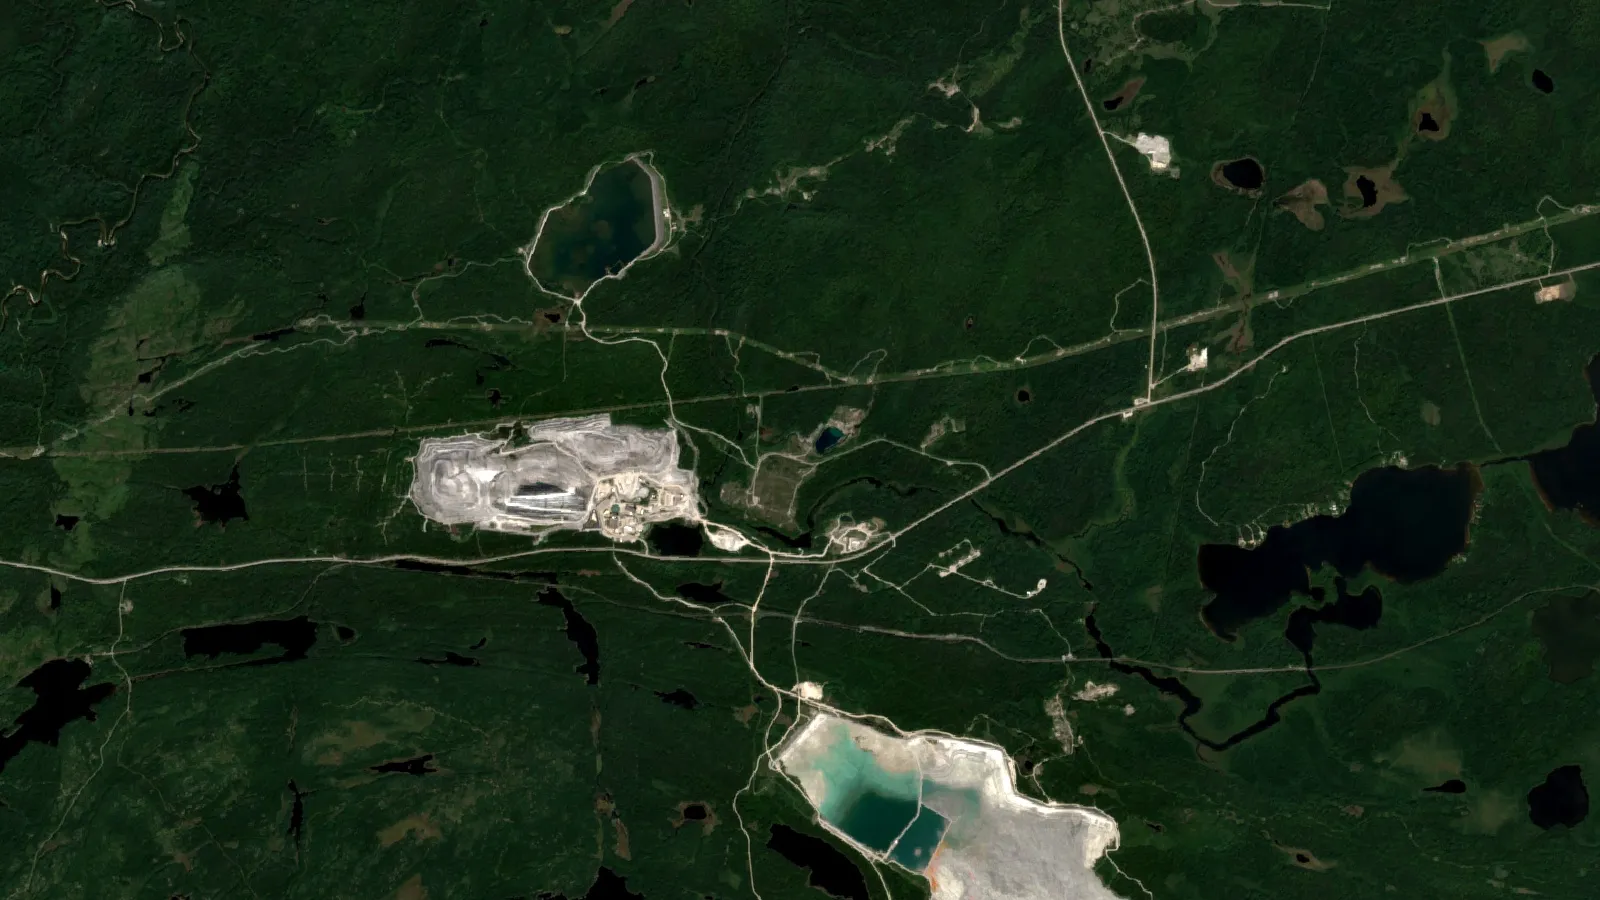
Key takeaways
- Under the JORC Code 2012, an Ore Reserve is the economically mineable part of a Measured and/or Indicated Mineral Resource (JORC, 2012).
- The polygon, triangle and cross-section methods estimate a resource; reserves need Modifying Factors, dilution and recovery (JORC, 2012).
- Simple geometric methods remain acceptable for early-stage work and for deposits such as coal and potash (CIM, 2019).
- Outlier treatment, declustering and bulk density can move tonnes and grade more than the choice of method (CIM, 2019).
- At Australian operating mines, gold Ore Reserves were 3,369 t against 7,256 t of Measured and Indicated resources at 31 December 2024 (Geoscience Australia, AIMR 2025).
In this article
- What "ore reserve" means under the reporting codes
- The ore reserve calculation formula every method shares
- Cross section method of ore reserve estimation
- Polygon method of ore reserve estimation
- Triangular method of ore reserve estimation
- Ore reserve estimation techniques in software
- From mineral resource to ore reserve: how much converts
- Before the first section: choosing where to drill
- Frequently asked questions
The classical hand methods still taught in every mining geology course, how each one turns drill intercepts into tonnes and grade, where each goes wrong, and what has to happen before any of those tonnes can honestly be called an ore reserve.
Modern inverse distance · kriging
Codes JORC · CIM
Checked September 2026
An ore reserve is the part of a mineral deposit that a study has shown can be mined at a profit, after allowing for dilution, losses and every other practical constraint. The phrase “ore reserve estimation” is older than that definition, though. In most textbooks it means the geometric job of turning drill holes into a tonnage and a grade, using methods such as polygons, triangles and cross-sections. Both meanings matter, and confusing them is how projects end up quoting reserves they do not have.
This article works through the classical ore reserve estimation methods with their formulas and a worked example for each. It then explains where the modern codes draw the line between a resource estimate and an ore reserve, using the definitions in the JORC Code (explained in our guide to JORC reports and Competent Persons) and the CIM Definition Standards, and published national figures that show how much of a resource usually converts.
“At Australia’s operating copper mines, reserves were 24% of measured and indicated resources.”
What “ore reserve” means under the reporting codes
The JORC Code, 2012 edition defines an Ore Reserve (Clause 29) as “the economically mineable part of a Measured and/or Indicated Mineral Resource.” It includes diluting material and allowances for losses, and it must be defined by studies at pre-feasibility or feasibility level that apply the Modifying Factors: mining, processing, metallurgical, infrastructure, economic, marketing, legal, environmental, social and government factors. The Code also says an Ore Reserve must not be reported on the basis of a scoping study.
There are two categories. A Probable Ore Reserve comes from an Indicated (and in some circumstances a Measured) Mineral Resource. A Proved Ore Reserve comes only from a Measured Mineral Resource and implies a high degree of confidence in the Modifying Factors. Canada’s CIM Definition Standards (May 10, 2014) use the same structure under the names Mineral Reserve, Probable and Proven. Our guide to NI 43-101 rules and Qualified Persons covers how Canada applies them.
Why the textbook “ore reserve calculation” is really a resource step
The polygon, triangle and cross-section methods estimate the tonnage and grade of mineralised material in the ground. Under the current codes, that is mineral resource estimation. JORC Clause 28 is direct about it: the words “ore” and “reserves” must not be used to describe Mineral Resource estimates, because they imply technical feasibility and economic viability. The geometry you are about to learn is the first half of the job. Turning its answer into an ore reserve takes a mine plan, a cut-off grade backed by costs and prices, and a study.
If someone shows you an “ore reserve” worked out with polygons on a drill plan and no mine plan behind it, you are looking at an in-situ tonnage estimate. It may be a good one. It is not an ore reserve under JORC or CIM definitions.
The ore reserve calculation formula every method shares
Every classical method reduces to the same three lines. What changes between methods is how the volume is split into blocks and which grade each block receives.
Tonnes = Volume (m³) × Bulk density (t/m³)
Contained metal = Tonnes × Grade
gold: grams = tonnes × g/t, ounces = grams ÷ 31.1035
base metal: tonnes of metal = tonnes × (% ÷ 100)
Older texts divide volume by a “tonnage factor” (cubic metres or cubic feet per tonne) instead of multiplying by density. It is the same calculation written upside down. The CIM Estimation of Mineral Resources and Mineral Reserves Best Practice Guidelines (November 29, 2019) call bulk density “as important a part of the MRMR estimation as determination of the volume or grade,” and prefer a direct density measurement for each sample assayed. A density guessed from a textbook table can move the tonnes by more than any choice of method.
Grade weighting
Where a block is informed by several intercepts, grades are weighted, never simply averaged. For intercepts of different thickness, the weighted grade is Σ(grade × thickness) ÷ Σ(thickness). For blocks of different size, weight by tonnes. A thin, rich intercept averaged equally with a thick, lean one overstates the grade of the whole.
Ask for bulk density to be measured on the same core intervals that go for assay, and in every rock type, including waste. Density varies between rock types and weathering states, so a single deposit-wide value hides real differences in tonnes.
What reserve estimation in geology needs before any method
Whatever the method, the inputs are the same, and weak inputs cannot be rescued by clever geometry. You need collar surveys and downhole surveys so each intercept sits in the right place. You need logged geology, so ore boundaries follow rock rather than numbers. You need assays with QA/QC, density measurements, and a reasoned cut-off to decide which intercepts count as mineralised. CIM’s 2019 guidelines deal with the database, bulk density, QA/QC and the geological interpretation before they reach estimation at all, and that order is a good guide to where the errors usually start.
Rounding the answer
JORC Clause 25 says estimates should be reported to appropriate significant figures, usually two. Its own example is that 10,863,000 tonnes at 8.23 per cent should be stated as 11 million tonnes at 8.2 per cent. Inferred material may need rounding to one significant figure. The calculator below rounds the same way.
The statistics behind a defensible estimate
Searches such as statistical ore reserve valuation and mathematics for mineral resource management point to the part of the work that sits between the drill log and the geometry. The CIM guidelines name four checks that a geometric method does not do for you.
- Outliers. A few very high assays can inflate local and global grades. The guidelines list domaining, grade capping (top cutting), limiting the reach of high grades, indicator kriging and simulation as ways to compensate, and ask the estimator to document the choice.
- Compositing. Samples of unequal length are combined to a common support, so a short rich sample does not count the same as a long lean one.
- Declustering. Holes drilled close together in rich areas bias the average upwards. Declustering gives a fairer estimate of the global mean grade.
- Spatial continuity. Variograms or correlograms measure how fast grade changes with distance and direction, and set how far the estimator may look for samples.
All four are described in sections 6.3 to 6.8 of the CIM Estimation of Mineral Resources and Mineral Reserves Best Practice Guidelines (2019). The same document prefers to choose an outlier treatment by reconciling the block model against production when production data exist.
Cross section method of ore reserve estimation
The cross-section method is the one most people picture. Drill holes are drilled on section lines, geology and grade are plotted on each vertical section, and the geologist draws the mineralised outline. Each section gives an area. The volume between two sections comes from those two areas and the distance between them.
Frustum rule: V = L × (A₁ + A₂ + √(A₁ × A₂)) ÷ 3
Prismoidal rule: V = L × (A₁ + 4Aₘ + A₂) ÷ 6, where Aₘ is the area midway
End block beyond the last section (wedge): V ≈ A × L ÷ 2
The end-area rule is simple and works well when neighbouring sections look alike. It overstates the volume when one section is much smaller than the next, because it assumes the body changes linearly in area when it actually tapers. The overstatement depends only on the ratio of the two areas, so it can be plotted once for every deposit:
Section spacing is the other lever. Wide spacing saves drilling but forces the geologist to assume continuity between sections, and the interpretation on each section is itself an estimate. That is why the cross-section method works best on regular, tabular or lens-shaped bodies drilled on a consistent grid.
A common error in cross-section work is to stop the volume at the last drilled section, or to project it a full section spacing beyond. Close the end blocks deliberately, usually with a wedge or half-spacing rule, and state which one you used.
Calculator
Cross-section tonnage, metal and reserve-style adjustment
Enter your own section areas, spacing, density, grade, dilution and recovery.
- End-area overstatement vs frustum (%): 7.1
- Contained gold in situ (oz): 6,076
- Tonnes after recovery and dilution: 98,753
- Diluted grade (g/t): 1.82
- Recovered gold after dilution (oz): 5,773
Example values only, not a benchmark. Frustum volume = L x (A1 + A2 + sqrt(A1 x A2)) / 3 and end-area volume = L x (A1 + A2) / 2; tonnes = volume x bulk density; grams per troy ounce 31.1035. Dilution and recovery are your own inputs from a mining study. The result is a block-level arithmetic check, not an Ore Reserve (JORC Code, 2012 and CIM, 2019).
Polygon method of ore reserve estimation
The polygon method, also called the included-area or area-of-influence method, suits flat-lying or gently dipping bodies drilled from surface, such as coal seams, laterites, placers and bedded deposits. Penn State’s introductory mining engineering course sets out the construction in five steps:
- Connect each drill hole to its neighbours with straight lines.
- Draw the perpendicular bisector of each line.
- Extend the bisectors until they meet; the intersections are the polygon corners.
- Measure the area of each polygon, by hand or in software.
- Multiply the area by the ore thickness in the hole to get the volume of influence.
In the course’s words, the whole volume beneath the polygon “is assigned the same values as the drill hole from which we constructed the polygon.” Each hole’s thickness and grade apply to all of its polygon. The mathematical name for this tiling is a Voronoi diagram, and nearest-neighbour estimation in software is the same idea applied to blocks.
Polygon area 2,500 m² × intercept 4 m = 10,000 m³
10,000 m³ × 2.6 t/m³ = 26,000 t
26,000 t × 1.8 g/t = 46,800 g ÷ 31.1035 = about 1,500 oz
Repeat for every polygon; total grade = Σ(t × g/t) ÷ Σ(t)
Where the polygon method goes wrong
- ⚠ No averaging at all. A single high-grade hole passes its full grade to a large polygon, and a single low hole condemns one. Grade estimates are only as smooth as the drilling.
- Edge polygons are open. Holes on the outside of the drill pattern have no neighbour to close their polygon, so you have to choose a boundary rule and apply it the same way everywhere.
- Irregular drilling gives irregular weights. A hole in a sparse part of the grid controls a far bigger area than one in a tight cluster, whatever its reliability.
- ✔ It is transparent. Anyone can recheck a polygon estimate with a ruler, which is why it survives as a quick check on computer models.
“A Proved Ore Reserve can come only from a Measured Mineral Resource.”
Use true thickness in the polygon and triangle methods
Grade-thickness maps built from drill holes should use true thickness, not the apparent thickness along the hole, to avoid significant bias (CIM, 2019). A hole that cuts a dipping vein at a low angle logs a longer intercept than the vein is thick. Convert each intercept using the hole and vein orientations before it becomes a polygon or triangle thickness.
Triangular method of ore reserve estimation
The triangular method joins neighbouring drill holes into a network of triangles, so every hole sits at the corner of several triangles. Penn State’s course describes the key difference from polygons: the included area of each triangle is assigned “the weighted average of the three holes forming the triangle,” with the weighting based on the length of the intercepts. Each block is informed by three holes instead of one, which smooths the estimate.
Mean thickness t̄ = (t₁ + t₂ + t₃) ÷ 3
Weighted grade ḡ = (g₁t₁ + g₂t₂ + g₃t₃) ÷ (t₁ + t₂ + t₃)
Tonnes = Area × t̄ × bulk density; contained metal = tonnes × ḡ
Worked example (illustrative): area 3,000 m²; intercepts 3 m @ 1.2 g/t, 5 m @ 2.4 g/t, 4 m @ 0.9 g/t
t̄ = 4 m; ḡ = (3.6 + 12 + 3.6) ÷ 12 = 1.6 g/t
3,000 × 4 × 2.6 = 31,200 t → 49,920 g → about 1,600 oz
The same three holes in the polygon method would have given three separate blocks at 1.2, 2.4 and 0.9 g/t. The triangle blends them. Whether that is better depends on the geology: blending is right when grade changes gradually between holes and wrong across a fault or a sharp ore boundary. Triangles should never be drawn across a mapped structure.
The table below puts the five common ore reserve estimation techniques side by side.
| Method | How each block gets its grade | Best suited to | Main weakness |
|---|---|---|---|
| Cross-section | Interpreted outline on each section; volume between sections | Tabular or lens-shaped bodies drilled on section lines | Relies on interpretation between sections; end-area error on tapering bodies |
| Polygon (included area) | One hole, full value, over its area of influence | Flat-lying seams, laterites, placers on regular grids | No smoothing; open edge polygons |
| Triangular | Thickness-weighted average of three holes | Gently dipping bodies with gradual grade change | Blends across boundaries if drawn carelessly |
| Inverse distance | Nearby samples weighted by 1 ÷ distance to a power | General block models with reasonable data | Weights ignore how grade actually varies in space |
| Kriging | Weights from a variogram model of spatial continuity | Most modern resource models | Needs enough data to model the variogram; smooths grades |
Ore reserve estimation techniques in software
Almost every estimate filed today is a computer block model. The deposit is divided into regular blocks, each block’s grade is interpolated from nearby composites, and the tonnage and grade are reported above a cut-off. The CIM 2019 guidelines list the options: “polygonal, nearest neighbour, inverse distance to a power, various kriging approaches (e.g. ordinary kriging, simple kriging, and multiple indicator kriging), conditional simulation, and other non-linear estimation methods.”
The same guidelines are clear that the old methods have not been banned. “Simple geometric methods can be acceptable in some cases (e.g. early stage deposit definition) or for some deposit types (e.g. potash and coal),” they say, while three-dimensional methods suit more spatially complex deposits. Choice should follow the geology, the variable being modelled, the amount and spread of data, how erratic the grades are, and what the model will be used for.
How estimators check a block model
- ✔ Volume check of the block model against the 3D wireframes it was built from.
- Visual check of block grades against drill holes on plans and sections.
- Global bias check against nearest-neighbour or declustered composite statistics.
- Swath plots to catch local bias along strike, across strike and down dip.
- Reconciliation with production once mining starts, the only test that uses reality as the answer key.
One practical habit is worth keeping from the hand-calculation era: run a quick polygon or section estimate beside the block model. If the two disagree by a large margin, find out why before anyone signs anything.

▶ Shows how a mineral management system puts maps, samples and targets in one place. · 3:21
From mineral resource to ore reserve: how much converts
Mineral resource and ore reserve estimation are separate steps with separate tests. Geology and sampling carry you to a Measured or Indicated resource. The Modifying Factors, applied in a pre-feasibility or feasibility study, decide how much of it is economically mineable. National statistics show how large that gap is in practice.
Mineral resource and ore reserve estimation: what changes between the two
Resource work and reserve work use the same drill data but answer different questions. The resource asks what is in the ground and has reasonable prospects for eventual economic extraction. The reserve asks what a mine plan can deliver to the plant. Two adjustments usually move the numbers most. Mining dilution is waste or low-grade rock mined along with ore, which adds tonnes and lowers grade. Mining recovery is the share of ore that is actually extracted, which cuts tonnes and metal. Pillars in an underground mine and ore outside the pit limit may never convert at all.
The JORC Code says an Ore Reserve may include dilution that was not part of the original resource, so the two numbers cannot be compared like for like (JORC Code, 2012 edition). It also says reserve figures must not be added to resource figures in tables or graphs, because the total is misleading and can give a false impression of a company’s prospects. Table 1 of the Code asks a reporter to state the mining dilution factors, mining recovery factors, minimum mining widths and cut-off grade basis used. A reserve statement that gives none of these has not shown how the resource was turned into a reserve.
The calculator above has two extra lines for this step. Enter your own dilution and recovery percentages to see how the in-situ tonnes from your sections change. They are inputs for you to set from a mining study, not benchmarks.
Geoscience Australia’s AIMR 2025 reports Ore Reserves and Measured and Indicated Mineral Resources at Australian operating mines as at 31 December 2024, with the resources stated inclusive of the reserves. For gold, 141 operating mines held 3,369 t of gold in Ore Reserves against 7,256 t in Measured and Indicated resources. For copper, 19.11 Mt against 79.07 Mt. Dividing one by the other gives a rough conversion ratio:
The same report expresses inventories as years of 2024 production, which shows the gap another way. At operating mines, gold Ore Reserves represented 12 years of production against 26 years for Measured and Indicated resources.
These figures are refreshed every year, with data as at 31 December. Check Geoscience Australia’s AIMR pages for the newest edition before quoting them. For the economics that decide conversion, our mining feasibility study guide walks through the study stages the codes require.
JORC says reported Ore Reserve estimates must not be aggregated with Mineral Resource estimates, because the total is misleading. If a presentation adds them into one big number, treat the whole slide with caution. This is general information, not investment advice.
Before the first section: choosing where to drill
Every method in this article needs drill holes, and drill holes need targets. The cheapest place to make that decision is before the rig arrives. Our satellite-based mineral detection analyses multispectral and hyperspectral imagery to flag likely mineralised target zones, alteration halos and structures across a licence, with no ground disturbance.
Match the method to the deposit style
The right geometry follows the shape of the orebody. Sheet-like seams and bedded deposits suit polygons and triangles. Veins and lenses on a regular drilling grid suit sections. Disseminated or irregular bodies usually go to a block model. Our types of ore deposits guide shows typical shapes, and the core sample logging and assay guide covers the sampling that feeds each of these estimates.
- ✔ Input: coordinates, KML/KMZ or a polygon of the area, plus the target mineral.
- Output: prospectivity heatmaps, high-potential zones with estimated location and depth ranges, indicative quantity, geological interpretation, and PDF plus georeferenced GIS files.
- Premium+: TargetMax™ drilling intelligence with drilling-angle recommendations and 3D subsurface models of vein structures, aimed at a higher chance of intersecting ore.
- Time and cost: 5 to 20 business days; up to 80 to 85% lower early-exploration cost and timelines cut from months to days, compared with starting on the ground.
- ⚠ What it is not: our reports describe exploration targets. They are not Mineral Resources or Ore Reserves under JORC, CIM or NI 43-101, and they are not signed by a Competent Person or Qualified Person. Drilling, assays and a qualified estimator take a target to a resource.
Start by drawing your licence on mining.farmonaut.com (Map Your Mining Site), or request a quote through the mining query form. The mineral exploration guide shows where targeting, drilling and estimation sit in a full program, and the satellite-driven 3D mineral prospectivity mapping overview shows a sample deliverable.
Every drill pad means cleared ground, access tracks and water. Screening from space first, then drilling the ranked targets, is the lower-impact order as well as the cheaper one.
Get drill targets worth estimating
Send your licence boundary and target mineral. We return ranked satellite target zones, structure and alteration maps, and GIS files your geologists can drill from.
Key terms
- Area of influence
- The ground a single drill hole is taken to represent in the polygon method, bounded by perpendicular bisectors to its neighbours.
- Bulk density
- Mass per unit volume of the rock in place, in t/m³; converts volume to tonnes.
- Tonnage factor
- Volume per tonne, the inverse of bulk density, used in older texts.
- Modifying Factors
- The mining, processing, metallurgical, infrastructure, economic, marketing, legal, environmental, social and government considerations that turn a resource into a reserve.
- Cut-off grade
- The grade below which material is not counted as ore for a given mining method, cost and price.
- Kriging
- An interpolation method that sets sample weights from a variogram model of how grade varies with distance and direction.

▶ Explains how thirteen satellite targets get ranked into a drill order you can defend. · 2:19
Frequently asked questions
What is an ore reserve?
Under the JORC Code, an Ore Reserve is the economically mineable part of a Measured and/or Indicated Mineral Resource, including dilution and allowances for losses, defined by a pre-feasibility or feasibility study that applies the Modifying Factors. It is split into Probable and Proved categories. Canada’s CIM standards use Mineral Reserve, Probable and Proven.
What are the main ore reserve estimation methods?
The classical hand methods are the cross-section method, the polygon (included-area) method and the triangular method. Modern estimates use block models with nearest-neighbour, inverse distance or kriging interpolation. The CIM 2019 guidelines accept simple geometric methods for early-stage work and some deposit types such as coal and potash.
What is the ore reserve calculation formula?
Volume = area × thickness; tonnes = volume × bulk density; contained metal = tonnes × grade. For gold, grams = tonnes × g/t and ounces = grams ÷ 31.1035. For base metals, metal tonnes = tonnes × grade % ÷ 100. Grades from several intercepts are weighted by thickness or tonnes.
How does the triangular method of ore reserve estimation work?
Neighbouring holes are joined into triangles. Each triangle’s volume is its area times the mean thickness of the three holes, and its grade is the thickness-weighted average of the three. It smooths grades compared with the polygon method, but triangles must not cross faults or sharp ore boundaries.
What is the difference between resource and reserve estimation in mining?
Resource estimation works out the tonnage and grade of mineralisation with reasonable prospects for eventual economic extraction. Reserve estimation applies a mine plan, dilution, losses, costs, prices and the other Modifying Factors in a pre-feasibility or feasibility study to find the part that can be mined at a profit. JORC forbids calling a resource “ore” or “reserves”.
Can a satellite survey give me an ore reserve?
No. A satellite survey, including ours, produces exploration targets: ranked zones worth sampling and drilling. Reserves need drilling, assays, a resource estimate by a qualified person and a feasibility-level study. Satellite screening helps you choose where that drilling should start.
Worked examples use illustrative numbers to show the arithmetic; they describe no real deposit. National figures are Geoscience Australia’s as at 31 December 2024 and are updated annually. Satellite targets are exploration targets, not mineral resources or ore reserves. This article is general technical information, not investment advice.
What is the difference between mineral resource and reserve estimation?
A resource estimate fixes the tonnage and grade of mineralisation that has reasonable prospects for eventual economic extraction, using drilling, geology and geostatistics. A reserve estimate takes the Measured and Indicated part of it and applies dilution, mining recovery, processing, cost, price, legal and environmental factors in a pre-feasibility or feasibility study. Resources are reported inclusive or exclusive of reserves, and the two must not be added together.
Which method is best for ore reserve estimation?
None is best everywhere. Polygons and triangles suit seams, laterites and other flat bodies, cross-sections suit lenses and veins drilled on lines, and modern resource models use block models with inverse distance or kriging. The CIM 2019 guidelines say the choice should follow the geology, the data and the purpose of the model.
How do dilution and mining recovery change ore reserve tonnes?
Dilution adds waste tonnes at a lower grade, so tonnes rise and grade falls. Mining recovery removes ore that is left behind, so tonnes and metal fall. A reserve can therefore have more or fewer tonnes than the resource blocks it came from, which is why the two are compared with care.
Do I need a Competent Person to estimate reserves?
To publish a resource or reserve under JORC, the report must be based on work by a Competent Person, and under CIM and NI 43-101 by a Qualified Person. Hand calculations are fine for early checks and teaching, but they do not replace that sign-off.
This page is for information only. It is not investment advice. Worked examples use illustrative numbers and describe no real deposit. Satellite targets are exploration targets, not Mineral Resources or Ore Reserves.
Farmonaut mining
Pick drill targets before you estimate
Request a quote to rank satellite exploration targets across your licence before you fund drilling.

Mining Pro sample view, synthetic data
Keep reading
Sources
- JORC, The JORC Code 2012 Edition: jorc.org
- CIM, Estimation of Mineral Resources and Mineral Reserves Best Practice Guidelines (2019): mrmr.cim.org
- CIM, Definition Standards for Mineral Resources and Mineral Reserves (2014): mrmr.cim.org
- Geoscience Australia, AIMR 2025: Australia’s estimated Ore Reserves: ga.gov.au
- Geoscience Australia, AIMR 2025: summary of reserve and resource life: ga.gov.au
- Penn State, MNG 230 reserve estimation methods: courses.ems.psu.edu
Discussion
Questions, corrections or field experience? Share them below. First-time comments are reviewed before they appear, and your email is never published.
No comments yet. Be the first to add a question or your experience.

 SMA Investments Ltd
 NTS Group (Pty) Ltd
 Mine4Africa
 Lithspo Minerals Limited
 Tintina Mining Group
 Dalgety Minerals Pty Ltd
 Vortex Minerals Pty Ltd
 Faith At Work (Pty) Ltd
 Geotech Mining Solutions plc
 Vulcan International Limited
 Kidepo Associates
 GKY Mining
 Alkimy SARL
 Double A Trading
 GemSprout Metals Limited
 Qader Group
 Ileys General Trading
 SG Gold Mining LLC
 VRV Global Pte Ltd
 Omsri International FZE
 G.I.T.T.
 Jaunita Erss Ltd
 Almosi SARL
 SRK Consulting
 Berks Gold Limited











