

Scandium, indium, europium · Price data
Scandium Price: Chart, Drivers, Indium and Europium
Scandium oxide averaged about US$640 per kg in 2025, indium about US$370 and europium oxide about US$27 (USGS). Here are the dated quotes since, the drivers, and the dates to watch.
Key takeaways
- USGS 2025 averages: scandium oxide US$640 per kg, indium US$370 per kg (US warehouse), europium oxide US$27 per kg (USGS, 2026).
- Scandium was made only as a by-product in 2025, about 80 tonnes of oxide worldwide, with China the leading producer (USGS, 2026).
- China refined about 760 of 1,100 tonnes of indium in 2025, and unwrought indium exports fell 72% year on year by September 2025 (USGS, 2026).
- China’s rare earth measures covering europium are suspended until 10 November 2026 (Pillsbury); Argus reported europium oxide at US$32 to US$42 per kg on 1 September 2026.
- Quotes for the same metal differ by source, so record purity, delivery point, tax and date with every price.
In this article
- Scandium, indium and europium prices at a glance
- Scandium price: what moves it
- Indium price: what drove the rise
- Europium price: cheap, but exposed to export controls
- What to watch before the end of the year
- Check what a price change does to your bill
- How to track these prices yourself
- Where new supply would come from
- Frequently asked questions
Scandium, indium and europium prices at a glance
Scandium oxide averaged about US$640 per kg in 2025, indium metal about US$370 per kg and europium oxide about US$27 per kg, according to the U.S. Geological Survey (USGS Mineral Commodity Summaries, 2026). That is a spread of more than twenty times between the three, and each metal has a different reason for its price. Scandium is scarce and made as a by-product. Indium follows the zinc industry and the display and chip trade. Europium is cheap today, but it sits on a list of rare earths that China has put under export licensing.
This page gives the dated numbers, the events that move each price, and the dates to watch before the end of the year. It does not give a price target. These are small markets, and a single figure would be a guess. Instead you get the drivers, a chart for each metal, and a calculator for what a price move does to your own purchasing bill.
| Metal and form | USGS average, 2025 | Recent quote | Who sets the price |
|---|---|---|---|
| Scandium oxide, 99.99% | US$640 per kg | US$801 per kg, ex-works China, 21 September 2026 (ScrapMonster) | China leads output; about 80 tonnes of oxide made worldwide in 2025 |
| Indium ingot | US$370 per kg (99.99% min, US warehouse) | US$975 per kg (99.995%), ex-works China, 21 September 2026 (ScrapMonster) | China refines about 69% of world output (USGS table) |
| Europium oxide, 99.99% | US$27 per kg | US$32 to US$42 per kg, 1 September 2026 (Argus Media via MMTA) | China leads rare-earth output (270,000 of 390,000 tonnes of oxide equivalent in 2025) |
Read the table with care. The USGS column is a yearly average for a stated purity and lot size. The quote column comes from a price aggregator or a trade publication on one day, for a stated market and delivery point. Quotes for the same metal can differ between sources because of purity, tax, packing and where the metal is delivered. Compare like with like before you decide that a price has moved.
Scandium price: what moves it
Scandium is the most supply-limited of the three. The USGS says it was produced only as a by-product in 2025, mainly from nickel and titanium process streams and from old tailings, with global oxide capacity above 90 tonnes a year and production of about 80 tonnes. It estimates that world use of oxide was 60 tonnes in 2025, mainly in aerospace alloys, other alloys and solid oxide fuel cells (USGS, 2026). Because the market is so small, one large buyer or one new plant can shift the price.
Chart
Scandium prices by form: 2025 average and a 2026 quote
US$ per kg; USGS 2025 average (ex-works China) against a ScrapMonster ex-works China quote on 21 September 2026
Why the official price fell while quotes rose
The USGS average for 99.99% oxide fell every year from a range of US$890 to US$1,000 per kg in 2021 to US$640 per kg in 2025. The average for 2025 is the lowest in the series. Yet the quote above for 21 September 2026 is US$801 per kg, about 25% higher than the 2025 average. Two things explain the gap. First, the USGS figure is an annual average for lots of 5 to 100 kg, while the quote is a single day. Second, China added licensing on scandium metal, alloys, oxides and compounds in April 2025, and the USGS notes those controls were still in force in December 2025, although China began issuing general export licences to selected exporters.
The price outside China is higher still
Western buyers do not always pay the Chinese price. The Modern War Institute at West Point reports that the US Defense Logistics Agency made a sole-source award to Rio Tinto for 6,384 kg of Quebec-sourced scandium oxide at 99.8% purity, worth up to US$40 million (USGS says the contract runs over five years with a minimum commitment of US$2 million) (MWI). Dividing the maximum value by the volume gives roughly US$6,270 per kg (MWI says US$6,250). That is a ceiling for a government security-of-supply contract, not a market price, but it shows how far a secured Western source can sit above the Chinese benchmark. For a buyer comparison of producers, see our guide to scandium suppliers.
New supply that could change the picture
- Rio Tinto, Sorel-Tracy, Quebec: produces scandium oxide from titanium dioxide waste streams, and calls itself the first and only North American producer (Rio Tinto). The Canada Growth Fund plans to invest about C$25 million to lift nameplate capacity to 9 tonnes a year (Canada Growth Fund and Rio Tinto, 31 October 2025 release).
- Sunrise Energy Metals, Syerston, New South Wales: on 10 August 2026 the company said the US Office of Strategic Capital had conditionally committed up to US$400 million of 25-year debt. It targets a final investment decision recommendation in the second half of 2026 and first production in the second half of 2028 (Sunrise ASX release).
- NioCorp, Elk Creek, Nebraska: plans to produce niobium, scandium, titanium and rare earth products and is still seeking project financing (NioCorp, August 2026 presentation).
Until a project like these ships oxide in volume, supply stays near the 80 tonnes the USGS reports. When one does, a new source with a stated production of tens of tonnes a year would be a large share of today’s market, which is why scandium buyers watch project milestones rather than monthly demand data.
Indium price: what drove the rise
Indium is a by-product of zinc. The USGS says it is most often recovered from sphalerite, a zinc sulfide mineral, and that zinc ores carry anywhere from under 1 to 100 parts per million of it. Most indium goes into indium tin oxide (ITO), the clear conductive coating on flat-panel displays. The USGS also names indium phosphide substrates used in 5G fibre-optic networks and data centres, and indium solder (USGS, 2026).
Chart
Indium price, US warehouse and Rotterdam
US$ per kg, annual average
World refinery output was about 1,100 tonnes in 2025, and China made 760 tonnes of it. The USGS table lists the US warehouse price rising from US$223 per kg in 2021 to US$370 per kg in 2025, and the Rotterdam price from US$217 to US$380. The USGS text cites an Argus average of US$390 per kg for 2025, with a peak of US$408 per kg in June. The two USGS figures differ because they come from different series, so quote the one you use.
Export controls changed the trade
In February 2025 China’s Ministry of Commerce put several critical minerals, indium among them, under new export restrictions. Asian Metal reported that exports of unwrought indium fell 72% year on year from September 2024 to September 2025 (USGS, 2026). In June 2026 Mexico Business News reported that the price of a 6-inch indium phosphide wafer had risen 250% to US$5,000 since the curbs began. That is a wafer price, not a metal price, but it shows the pressure where indium meets AI hardware.
The metal itself is now quoted far above the USGS 2025 average. ScrapMonster listed 99.995% ingot at US$975 per kg ex-works China and US$1,104 per kg delivered in the United States on 21 September 2026. That is about 2.6 times the USGS US warehouse average for 2025, though the two differ in purity, market and date. The figure is one day’s quote from one aggregator, so check the date and the delivery point before you use it.
What could pull the price back
Demand for ITO is tied to flat panels, and the market is shifting. On 15 October 2026 the Shanghai Metals Market news feed carried a flash that TOP Nanometal had stopped making ITO film and converted its equipment to sputtered copper (SMM). One plant does not make a trend, but it is the kind of demand loss that can ease the price. Recycling matters too: the USGS says indium is mainly recovered from ITO scrap in Japan and South Korea. Because indium rides on zinc smelting, a new indium supply needs zinc ore that carries it, so mine planning for zinc is where new tonnes would start.
Europium price: cheap, but exposed to export controls
Europium is a rare earth. In the USGS table its 99.99% oxide averaged US$31 per kg in 2021, US$30 in 2022 and US$27 in each of 2023, 2024 and 2025. That is flat and low, about one twenty-fourth of the scandium oxide price. For the whole rare earth group, the USGS reports 390,000 tonnes of mine production in 2025, of which China made 270,000 tonnes and the United States 51,000 tonnes (USGS, 2026).
Chart
Europium oxide price, 99.99%
US$ per kg, annual average
The November date that matters
On 9 October 2025 China announced licensing for medium and heavy rare earths that included europium, holmium, erbium, thulium and ytterbium. On 7 November 2025 it suspended those measures until 10 November 2026, according to the law firm Pillsbury. The USGS confirms the October controls were suspended for one year. Argus says the suspension expires in November and that the expectation is already shaping spot prices outside China. It reports europium oxide up 35% since the start of the second quarter to US$32 to US$42 per kg (cif Europe) on 1 September 2026 (Argus Media via MMTA).
The same Argus report shows how large the effect can be for a heavier rare earth. Dysprosium oxide in Europe stood at US$2,500 to US$3,000 per kg, up 882% since the controls were introduced. Europium has not moved like that, but it is on the same list. For the heavier end of the group, see our guide to terbium price trends.
What to watch before the end of the year
A price outlook needs events with dates. These are the ones we can source.
- 10 November 2026: end of China’s suspension of the October 2025 rare earth measures, which cover europium (Pillsbury). If the pause is extended, expect the ex-China premium to ease. If it lapses, expect the reverse.
- 27 November 2026: end of the suspension of the Article 2 dual-use restrictions on gallium, germanium and antimony (Pillsbury). It does not cover indium or scandium directly, but it shows how a single date can move related minor-metal markets.
- Second half of 2026: Sunrise says a final investment decision recommendation is due to its board in the second half of 2026, and it keeps a first-production target of the second half of 2028.
- Chinese export data for indium: a recovery from the 72% fall reported by the USGS would loosen the market.
Three scenarios follow from those dates. They are reasoning aids, not predictions. If licensing eases, Western premiums over Chinese quotes narrow. If it tightens, the premiums widen first for the metals with the fewest suppliers, which are scandium and indium. If demand falls, as in the ITO film example, indium would be the first to feel it.
Check what a price change does to your bill
The calculator below takes your yearly volume, today’s price, a new price and the share of your needs already fixed by contract. It shows the extra cost you would carry. Use quotes from your own supplier or from a dated assessment such as SMM, Argus or Fastmarkets.
Calculator
What does a price move add to your yearly metal bill?
Enter your own yearly volume, prices and the share already fixed by contract.
- Bill at the old price: $185,000
- Bill after the move: $314,000
- Change in the bill: 69.7%
Example values only, not benchmarks or forecasts. Prices are inputs: use today’s price from your supplier or a dated assessment. The defaults use the USGS 2025 indium average (US$370 per kg) and an example new price. Money is in US$.
How to track these prices yourself
- Annual averages: the USGS Mineral Commodity Summaries, published each January or February, give a consistent annual series with stated purity and lot size.
- Daily quotes: Shanghai Metals Market (SMM) publishes China, US and Europe series for indium and rare earth oxides; most history sits behind a login. ScrapMonster lists daily quotes for scandium, indium and others with origin and date.
- Trade assessments: Argus and Fastmarkets publish ex-China prices, usually behind subscription.
- Always record: metal form, purity, quantity, delivery point, tax treatment and date. A quote without those is not a price.
Two cautions apply. Use a dated quote from a named assessor for any purchasing plan, not a shop price for small bars or a table with no named source.
Where new supply would come from
All three metals are by-products or small-volume products, so new supply starts with ground that holds them. The USGS says scandium comes from nickel and titanium process streams and old tailings, indium mainly from zinc sulfide ore, and rare earths from minerals such as bastnaesite and monazite. Finding that ground is an exploration job before it is a pricing job.
▶ Explains that remote sensing means measuring the ground from a distance, and why agreement between instruments is the core of the argument. · 2:01
Chart
World indium refinery production by country
Tonnes, 2025 estimate (world total 1,100)
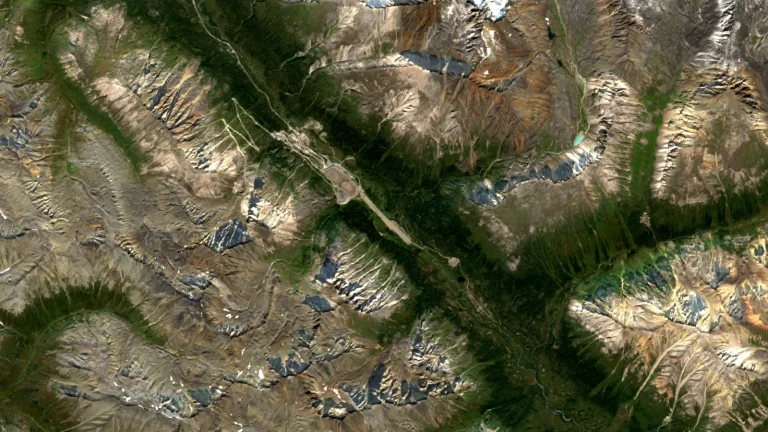
Satellite data can help screen large areas for the alteration, iron-oxide and clay signatures that guide field work, ahead of any resource estimate. Farmonaut offers satellite mineral detection from a KML, KMZ or polygon boundary; it is a screening step, not a resource estimate. Our satellite mineral detection page explains what it covers, or you can send a mining enquiry or contact the team with your area.
▶ Covers what satellite exploration cannot do, the limits that matter in due diligence. · 2:08
Frequently asked questions
What is the scandium price per kg?
The USGS lists 99.99% scandium oxide at an average of US$640 per kg for 2025. A daily quote on 21 September 2026 was US$801 per kg ex-works China. Prices outside China can be far higher; a US defence contract with a ceiling of US$40 million for 6,384 kg implies up to roughly US$6,270 per kg.
Will scandium prices go up?
This page gives no price target, because these markets are small and a single figure would be a guess. The factors that would raise the price are continued Chinese licensing and slow new supply; the factors that would lower it are new output from Rio Tinto’s expansion or the Syerston mine, which targets first production in the second half of 2028.
Why is scandium so expensive?
It is rarely mined for itself. The USGS says it is made only as a by-product of other metals, with about 80 tonnes of oxide made worldwide in 2025, so supply cannot respond quickly to demand.
What is the indium price per kg?
The USGS table gives a US warehouse average of US$370 per kg for 2025. ScrapMonster listed 99.995% ingot at US$975 per kg ex-works China on 21 September 2026. Check the date and delivery point before you use the figure, as it comes from one aggregator on one day.
Why did the indium price rise?
China, which refines about 69% of world indium, put new export restrictions on it in February 2025, and unwrought indium exports fell 72% year on year by September 2025. Demand from indium phosphide for fibre networks and data centres also grew.
What is indium used for?
Most of it goes into indium tin oxide, a clear conductive coating on flat-panel displays. The USGS also lists solders, semiconductors and indium phosphide for fibre-optic networks.
What is the europium oxide price?
The USGS lists 99.99% europium oxide at US$27 per kg for 2025. Argus reported US$32 to US$42 per kg on 1 September 2026, up 35% since the start of the second quarter.
Is europium covered by Chinese export controls?
Yes. China’s October 2025 announcement added europium, holmium, erbium, thulium and ytterbium to its licensing. The measures are suspended until 10 November 2026.
Where can I find a current price chart?
Use dated assessments from SMM, Argus or Fastmarkets for trading, and the USGS Mineral Commodity Summaries for yearly averages. Our charts on this page use USGS data and say where each point comes from.
Are these metals a good investment?
This page does not give investment advice. These are thin markets with a few producers, large price gaps between sources and policy risk, which makes any single price hard to rely on. Read the company filings and take professional advice before you commit money.
Who produces scandium outside China?
Rio Tinto in Quebec produces it from titanium waste streams, and Japan refines scandium oxide for other producers. Our scandium supplier guide lists the producers and development projects with their stated capacity.
This page is for information only. It is not investment or legal advice, and export-control rules change. Prices are quotes on the dates shown and differ by source, purity and delivery point.
Farmonaut mining
Screen your own ground from space
Investors can ask for satellite screening of a licence area, delivered as exploration targets ahead of any resource estimate.

Mining Pro sample view, synthetic data
Keep reading
Sources
- USGS, Mineral Commodity Summaries 2026: Scandium: pubs.usgs.gov
- USGS, Mineral Commodity Summaries 2026: Indium: pubs.usgs.gov
- USGS, Mineral Commodity Summaries 2026: Rare earths: pubs.usgs.gov
- ScrapMonster, Scandium prices (21 September 2026): scrapmonster.com
- ScrapMonster, Indium prices (21 September 2026): scrapmonster.com
- Argus Media via MMTA, Export controls fracture ex-China rare earth market: mmta.co.uk
- Pillsbury, China suspends export controls on certain critical minerals: pillsburylaw.com
- Modern War Institute, The Sixty-Ton Problem (scandium): mwi.westpoint.edu
- Rio Tinto, Scandium: riotinto.com
- Canada Growth Fund and Rio Tinto release, 31 October 2025 (scandium, Sorel-Tracy): newswire.ca
- Sunrise Energy Metals, ASX announcement 10 August 2026: announcements.asx.com.au
- ABC News, Pentagon loan to Syerston scandium mine (8 August 2026; reports first production in 1H 2028): abc.net.au
- NioCorp, Elk Creek feasibility results presentation (August 2026): niocorp.com
- Mexico Business News, China’s indium phosphide curbs (12 June 2026): mexicobusiness.news
- Shanghai Metals Market, Europium oxide page (15 October 2026): metal.com
Discussion
Questions, corrections or field experience? Share them below. First-time comments are reviewed before they appear, and your email is never published.
No comments yet. Be the first to add a question or your experience.

 SenGold Invest SAS
 Sania Corporation
 Sean Mining Limited
 NTS Group (Pty) Ltd
 Mine4Africa
 Lithspo Minerals Limited
 Tintina Mining Group
 Dalgety Minerals Pty Ltd
 Vortex Minerals Pty Ltd
 Faith At Work (Pty) Ltd
 Geotech Mining Solutions plc
 Vulcan International Limited
 Kidepo Associates
 GKY Mining
 Alkimy SARL
 Double A Trading
 GemSprout Metals Limited
 Qader Group
 Ileys General Trading
 SG Gold Mining LLC
 VRV Global Pte Ltd
 Omsri International FZE
 G.I.T.T.
 Jaunita Erss Ltd











