

Gold Anomaly Detection Zambia: 10 Ranked Drill Targets
No trenches. No sampling grid. No boots on the ground. Twenty-one orbital and geophysical data layers, fused into a single prospectivity surface, turned a quiet stretch of Zambian bush into a ranked, costed drill queue — and told the client, honestly, which of those targets the evidence does not yet support.
Region Zambia
Surveyed 283.2 ha
Targets 10 zones
Exploration target ~11,450–14,900 oz
Confidence All pending validation
This case study is published with our client’s site identity removed. The licence holder, licence
designation, district, coordinate reference and survey grid have all been stripped from the text,
tables, captions and image pixels. Satellite figures have had their coordinate axes and true-colour
basemap removed and carry a burned-in redaction banner. Every geological and economic figure below is
reproduced unaltered from the delivered report — only the where and the who are gone.
Early-stage gold exploration has an uncomfortable arithmetic problem. To find out whether a licence
block is worth drilling, the classical answer is to walk it, map it, cut trenches, run soil and rock-chip
geochemistry, and then drill — a sequence that consumes months of field season and a large fraction of a
junior’s treasury before anybody knows whether the ground deserved the attention. Gold anomaly
detection in Zambia from orbit inverts that order. It asks the satellite record first, narrows the
ground that merits a rig, and leaves the expensive, invasive work for targets that have already survived a
multi-sensor screening.
This case study walks through exactly that exercise on a real Zambian gold licence. We screened a
283.2-hectare block (699.8 acres), fused twenty-one orbital and geophysical data layers into a single
composite prospectivity surface at 10-metre ground resolution, extracted ten discrete economic anomaly
zones covering 64.2 hectares, and modelled a satellite-derived exploration target of roughly
11,450 to 14,900 troy ounces of contained gold at a tonnage-weighted head grade of
0.51 g/t Au. Then we did the part that matters more than the headline: we published which evidence layers
agreed with that signal, which ones disagreed, and what it would cost — to the metre and to the rig-day —
to find out who was right.
Want this run on your own ground? Get a
quote for a satellite mineral scan, or draw your area of interest directly on the map at
mining.farmonaut.com — our mineral-detection mapping
workspace.
“One zone in ten holds 30% of the gold — 4,482 ounces of the 14,896 ounces detected.”
A 283-hectare Zambian licence block, and the question it posed
Zambia is far better known for copper than for gold. That is precisely what makes its gold ground
interesting: large tracts of prospective terrain sit inside licences held for other reasons, or held
speculatively, with no modern exploration dataset behind them. The block in this study is one of those.
It is a working licence within a larger Zambian concession, held by a private mining company that came to
us with a straightforward commercial question — is there anything here worth a drill program, and if
so, where exactly do we put the first hole?
The physical setting is unusually cooperative. Mean elevation across the block is approximately
1,333 metres above sea level, and mean slope is 4.66° — comfortably below the 25° threshold at which
open-pit geotechnics start to get complicated, and well within the range where a rig can be moved and
levelled without earthworks. Terrain accessibility was rated High across the whole block. Minimum distance
to the nearest building is 74 metres, and drainage, while well organised, does not cross a single anomaly
polygon. In exploration terms this is easy ground: nothing about the site itself is going to be the reason
a program fails.
What the site does have is cover. The dominant surface context across the licence is dense
vegetation — miombo-style woodland over a laterite-influenced regolith. That matters enormously, because
cover is the single biggest enemy of optical mineral detection. A bare, arid outcrop broadcasts its
mineralogy to a satellite sensor. A vegetated, weathered surface muffles it. Any honest account of
gold anomaly detection in Zambia has to start by conceding that the country’s vegetated
interior is a harder detection environment than, say, the Arabian Shield or the Atacama — and then explain
what you do about it.
What you do about cover is stop relying on any single sensor. Optical alteration mapping is weak under
canopy — so the screen leans on layers that see through or around vegetation: radar surface
roughness, day–night thermal contrast, magnetic basement structure, and geobotanical stress in the canopy
itself. On this block, that decision is exactly why there is a signal to discuss at all: the optical
alteration layer came back Marginal on all ten zones, while the thermal layer came back Strong on all ten.
The commercial problem in one paragraph
A junior or private licence holder with a 283-hectare block faces a capital-allocation decision, not a
geological one. Walking and geochemically sampling that area to a standard that would justify drilling is a
multi-month, multi-crew exercise; at typical African field-cost rates it consumes a meaningful share of an
early-stage budget before a single metre is drilled. And the classical sequence gives you no way to
rank what you find until quite late. Satellite screening is attractive not because it replaces
drilling — it cannot and does not — but because it reorders the spend: cheap, fast, non-invasive
prioritisation first, expensive confirmation second, and only on ground that earned it.
How gold anomaly detection in Zambia actually works
Every mineral and every alteration assemblage interacts with electromagnetic energy in its own way.
Iron oxides absorb and reflect differently from clay minerals; silicified rock stores and releases heat
differently from vegetated soil; a fault-controlled quartz corridor scatters radar differently from
undisturbed regolith. A satellite gold exploration screen is, at bottom, the systematic exploitation of
those differences — reading many independent physical properties of the same patch of ground, then looking
for the places where several of them line up in a pattern consistent with gold mineralisation.
The sensor stack
This screen drew on twenty-one orbital and geophysical layers. The table below lists the primary data
sources and what each one contributes geologically. Figures in parentheses are each sensor’s horizontal
ground sample distance — the on-ground footprint of one pixel — not a depth.
| Sensor / data layer | Geological role in the screen |
|---|---|
| Sentinel-2 (10 m) | Visible and near-infrared reflectance — vegetation indices, hydrothermal alteration composites, iron-oxide ratios. |
| ASTER SWIR (30 m) | Short-wave infrared mineral mapping — AlOH–sericite, argillic and carbonate–chlorite ratios for proximal alteration mineralogy. |
| Sentinel-1 SAR | Dual-orbit lineament density and surface roughness — structural fabric and fault networks, independent of cloud and canopy colour. |
| PALSAR-2 L-band | HH/HV backscatter and temporal stability — vein-controlled relief and bedrock exposure beneath light cover. |
| MODIS / ASTER thermal | Diurnal land-surface temperature anomalies — flags silicification and sulphide oxidation by their thermal inertia. |
| EMAG-2 magnetics | World Digital Magnetic Anomaly grid — basement structure and intrusive footprints that drive hydrothermal systems. |
| Copernicus DEM (30 m) | Slope, aspect, hillshade, flow accumulation, knickpoint and meander proxies — geomorphological host criteria. |
| Sentinel-2 time series | Bare-ground persistence, dry-season geobotanical stress, laterite-cover penalty — separates persistent surface expression from seasonal noise. |
Each layer is normalised and combined into a single per-pixel composite prospectivity score — a
weighted composite of multiple normalised sub-scores spanning alteration mineralogy, structural density,
surface evidence, thermal signature and geomorphological host criteria. Contiguous high-scoring pixels are
then grouped into discrete anomaly polygons by thresholded connected-component analysis, each fitted with
an oriented minimum-area bounding box so that strike, width and elongation can be measured. Every polygon
carries a coherence score that combines its elongation with its boundary smoothness, because real
vein-controlled targets are elongate and smooth-edged, while noise is blobby and ragged.
Spatial coherence is a free credibility check. Look at the shape of an anomaly before you
look at its score. Real hydrothermal systems produce smooth, contiguous, spatially coherent anomalies that
survive multi-sensor fusion. Salt-and-pepper speckle that changes shape every time you add a layer is
processing noise wearing a geological costume.
From anomaly polygon to tonnes and ounces
Turning a mapped polygon into a tonnage and a contained-metal figure is deliberately conservative
arithmetic, and it uses industry-standard parameters throughout so that any competent person can reproduce
or challenge it:
Contained gold (kg) = Tonnage (t) × Grade (g/t) ÷ 1000
Diluted tonnage = Undiluted × (1 + 18% dilution)
Reference rock density = 2.4 t/m³ | Cut-off grade = 0.25 g/t Au
Prism geometry factor = 0.7 | Blended recovery = 81% (90% mining × 90% metallurgical)
The prism factor of 0.7 is the deliberate haircut: it assumes a mapped polygon does not fill its own
bounding volume, and it is the single most important reason these numbers land where they do rather than an
order of magnitude higher. The 18% dilution allowance adds waste rock at the mapped grade to reflect what a
mining operation would actually move. Recovery is a blended 81% — conservative for an oxidised, near-surface
gold system, where heap-leach response typically runs 75–90% and conventional carbon-in-leach 88–94%.
Read more about the method behind these screens on our
satellite-based mineral detection
page — it explains how orbital spectral data becomes a ranked target list for your licence.
What gold anomaly detection found: 10 zones, ~11,450–14,900 oz
Ten discrete economic anomaly zones were extracted from the composite surface, together covering
64.24 hectares (158.74 acres) — 22.7% of the 283.2-hectare surveyed block. Every zone sits
above the 0.25 g/t Au economic cut-off. All ten were classified as gossan-zone mineralisation: an
iron-oxide-rich, oxidised surface cap over a sulphide-bearing system, which is exactly the style you would
hope to detect from orbit, because the oxidation cap is what the sensors can actually see.
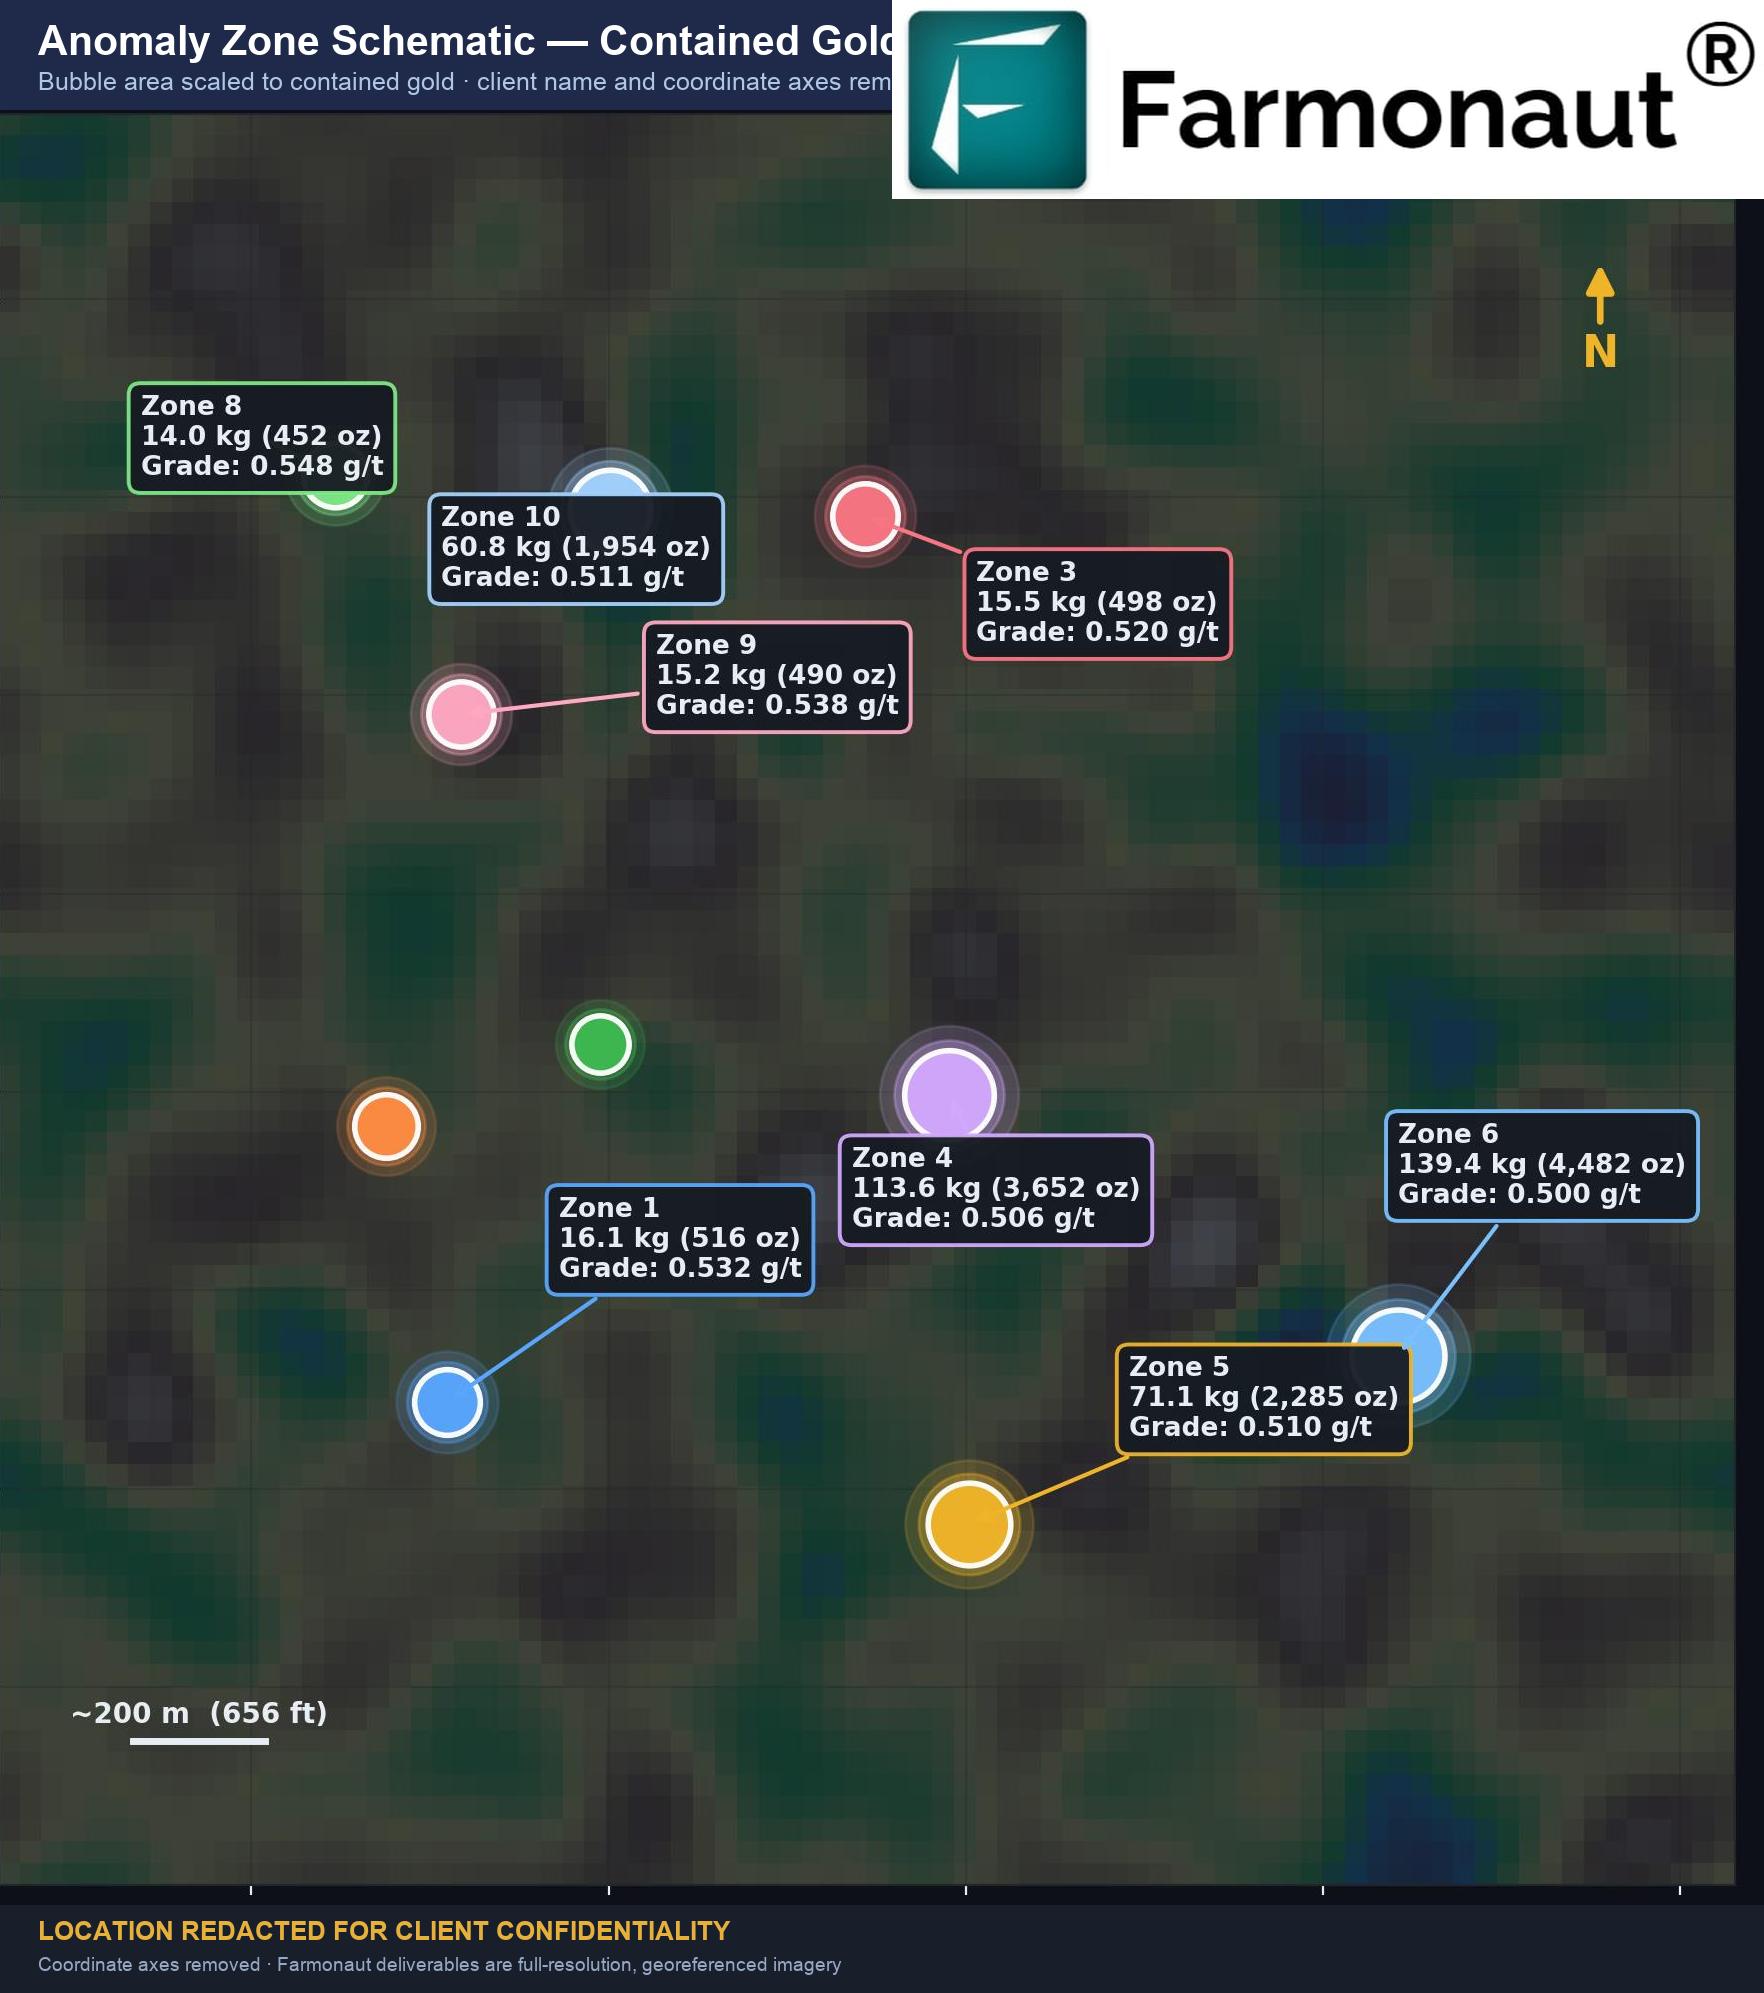
The distribution of that metal is heavily skewed, and that skew is the single most commercially useful
finding in the dataset. Two zones out of ten carry 54.6% of the contained gold. The largest
single zone alone accounts for 30.1% of gross in-situ value — 139.4 kg, or 4,482 troy ounces, at a modelled
0.500 g/t across an 858-metre strike length. For a licence holder deciding where to spend a first drill
budget, that concentration is worth more than any headline total: it means a two-target program can test the
majority of the block’s modelled value.
The master comparison table — all ten zones
This is the full inventory. Grade is the modelled diluted grade that the contained-metal totals are
built on; the adjacent column shows the pixel-level P10–P90 grade spread, which is what sets the honest
uncertainty band on the portfolio. Tonnage, strike, strip ratio and value all reconcile to the portfolio
totals in the final row.
| Zone | Drill rank | Grade (g/t Au) | Grade spread P10–P90 | Contained Au | Ore tonnage (t) | Strike (m) | Strip ratio | Gross value | Signal | Confidence |
|---|---|---|---|---|---|---|---|---|---|---|
| Zone 6 | 3 | 0.500 | 0.379–0.489 | 139.4 kg / 4,482 oz | 278,940 | 858 | 2.74 | USD 18.2M | Moderate | Low |
| Zone 4 | 7 | 0.506 | 0.389–0.494 | 113.6 kg / 3,652 oz | 224,646 | 704 | 2.74 | USD 14.8M | Moderate | Low |
| Zone 5 | 8 | 0.510 | 0.403–0.539 | 71.1 kg / 2,285 oz | 139,441 | 759 | 2.69 | USD 9.3M | Moderate | Low |
| Zone 10 | 2 | 0.511 | 0.375–0.491 | 60.8 kg / 1,954 oz | 118,915 | 438 | 2.80 | USD 7.9M | Moderate | Low |
| Zone 1 | 9 | 0.532 | 0.412–0.541 | 16.1 kg / 516 oz | 30,153 | 288 | 2.77 | USD 2.1M | Moderate | Low |
| Zone 3 | 6 | 0.520 | 0.393–0.540 | 15.5 kg / 498 oz | 29,778 | 435 | 2.71 | USD 2.0M | Moderate | Low |
| Zone 9 | 1 | 0.538 | 0.443–0.483 | 15.2 kg / 490 oz | 28,318 | 239 | 2.74 | USD 2.0M | Moderate | Low |
| Zone 8 | 5 | 0.548 | 0.453–0.510 | 14.0 kg / 452 oz | 25,633 | 311 | 2.80 | USD 1.8M | Moderate | Low |
| Zone 7 | 10 | 0.501 | 0.407–0.448 | 12.4 kg / 400 oz | 24,794 | 359 | 2.60 | USD 1.6M | Moderate | Low |
| Zone 2 | 4 | 0.607 | 0.445–0.667 | 5.2 kg / 168 oz | 8,604 | 89 | 2.86 | USD 0.7M | Moderate | Low |
| PORTFOLIO | — | 0.510 wtd avg | 0.38–0.67 | ~11,450–14,900 oz | 909,224 | — | 2.74 wtd avg | ~USD 46–60M | Moderate | Low |
Total diluted ore tonnage across the ten zones is 909,224 tonnes (1,002,246 US short tons). Per-zone
strike lengths run from 89 metres up to 858 metres, and strip ratios sit in a tight band from 2.60 to 2.86,
weighted average 2.74 — comfortably inside the 3.0–4.0 range that surface-amenable gold operations routinely
accept. The uniformity of those strip ratios is itself informative: it says the ten zones share a single
depth architecture rather than representing ten unrelated geological situations.
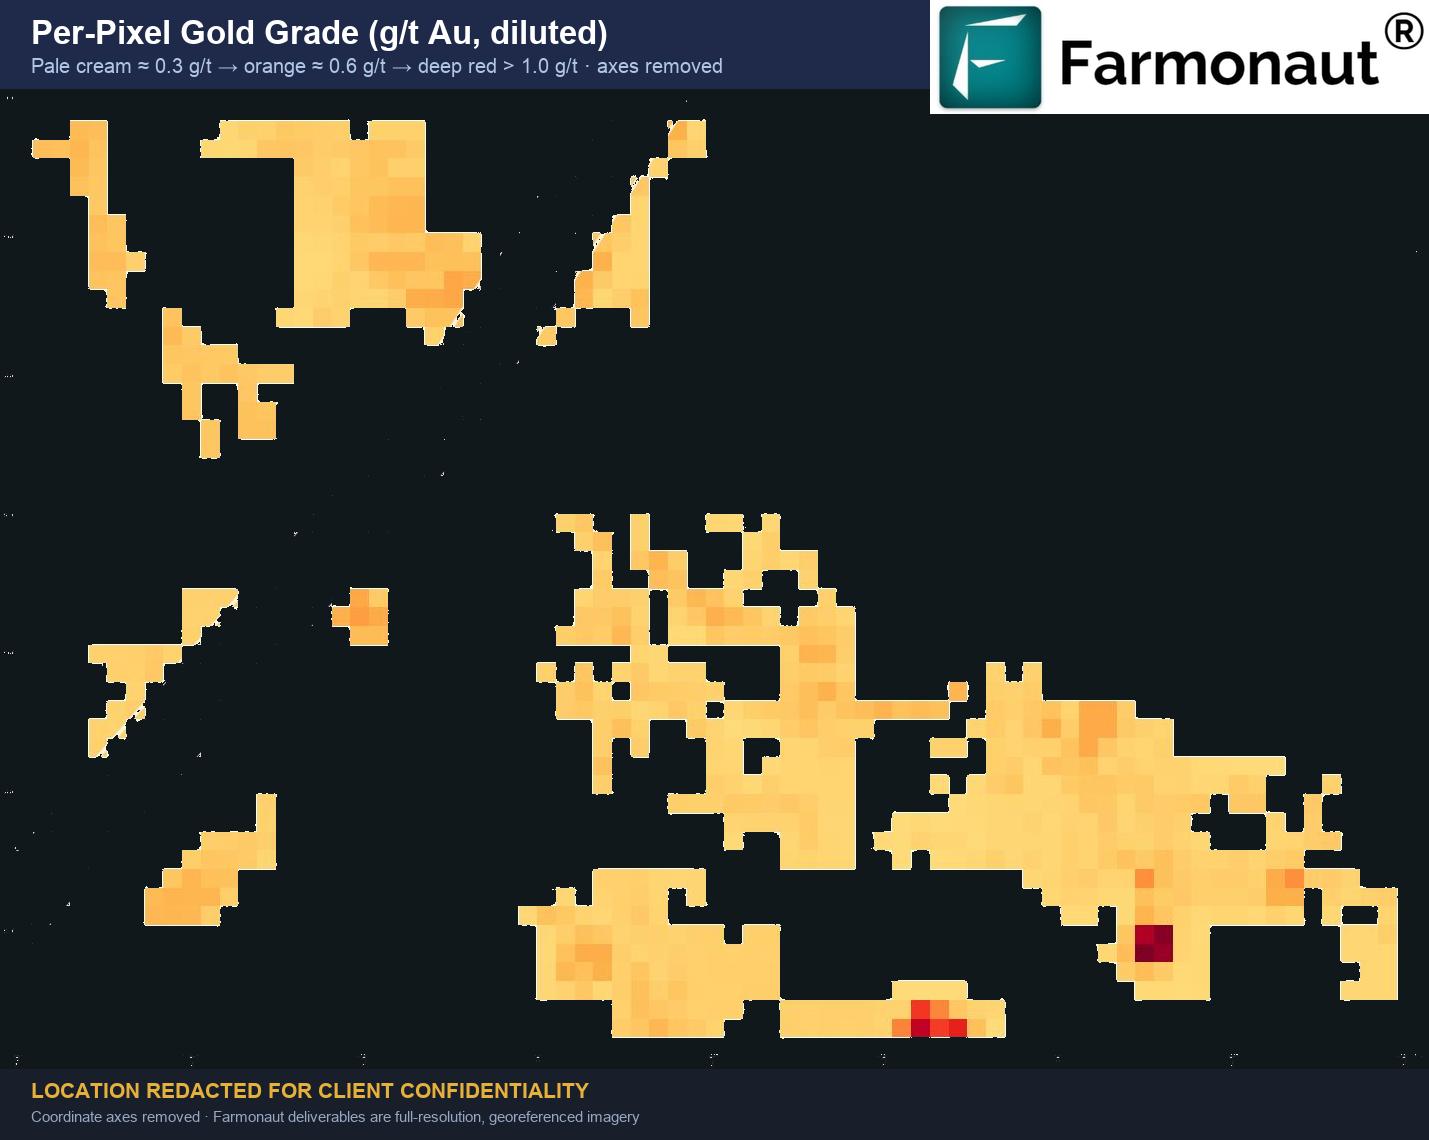
That per-pixel view is worth dwelling on, because it is where the honest uncertainty lives. A single
grade figure per zone is a convenience for a table; the underlying model produces a distribution. Peak
modelled grade anywhere in the block reaches 0.609 g/t at polygon level, with individual pixels running
above 1.0 g/t, while the P10 of several zones sits below 0.40 g/t. Publishing a single point value for a
satellite-derived estimate implies a precision the method does not have — which is why every resource and
economic figure in this case study is quoted as a band.
Treating a satellite exploration target as a resource. These are not Mineral Resources or
Mineral Reserves under JORC, NI 43-101, SK-1300 or SAMREC, and they must not be used for public disclosure
or investment decisions. No drilling, trenching, sampling or assaying sits behind any number on this page.
A satellite screen tells you where to spend your drilling budget; only the drill tells you what is there.
Where the value sits
Reading the evidence: which signals agreed, and which didn’t
This is the section most satellite exploration marketing leaves out, and it is the section that
determines whether a report is useful. A composite prospectivity score is a rollup of independent evidence
layers. If you only publish the rollup, you hide the disagreement. So the delivered report opens the
composite back up: each anomaly carries eight independent signal families, and each family is scored Strong,
Moderate, Weak or Marginal — both per zone and across the whole block. Credible gold anomaly detection lives
or dies on this table, not on the headline ounce count.
The pattern is unambiguous, and it is not entirely flattering. Thermal anomaly fired Strong on
all ten zones. Vegetation biogeochemistry fired Strong on five and Moderate on three. Radar surface
roughness fired Strong on four and Moderate on six. Those three families are the load-bearing evidence here,
and they are precisely the families that work under vegetation cover.
But hydrothermal alteration returned Marginal on all ten zones, and magnetic signature returned
Marginal on all ten. Block-wide mean ASTER alteration composite is effectively zero. That is two of
eight independent evidence layers declining to corroborate the signal. The report does not bury that; it
publishes it as a formal risk flag against every polygon, with a named mitigation.
“Thermal sensors fired Strong on all ten zones. Magnetics fired Marginal on all ten.”
The three detection-risk flags, and what resolves each one
| Risk flag | Zones affected | Share of gold | What it means | Mitigation |
|---|---|---|---|---|
| Low SWIR agreement | 10 of 10 | 100% | Short-wave infrared mineral mapping shows minimal alteration support for the anomaly. | Ground hyperspectral survey or a portable XRF traverse to confirm mineralogy directly. |
| No magnetic anomaly | 10 of 10 | 100% | No magnetic response coincident with the anomaly polygons. | Drone or ground magnetic survey at 50–100 m line spacing. |
| Near block edge | 1 of 10 | 29.0% | One polygon’s centroid sits within 200 m of the survey boundary — possible clipping of the true footprint. | Extend the area of interest by 500 m and re-run to recover the full polygon. |
Not one of the ten polygons raised zero flags. Combine that with the composite signal class — every zone
came back Moderate, none Strong — and the classification rule produces an unambiguous
verdict: zero high-confidence zones, zero medium-confidence zones, ten low-confidence zones.
All 14,896 modelled ounces and all USD 60.4M of headline in-situ value sit in the low-confidence tier.
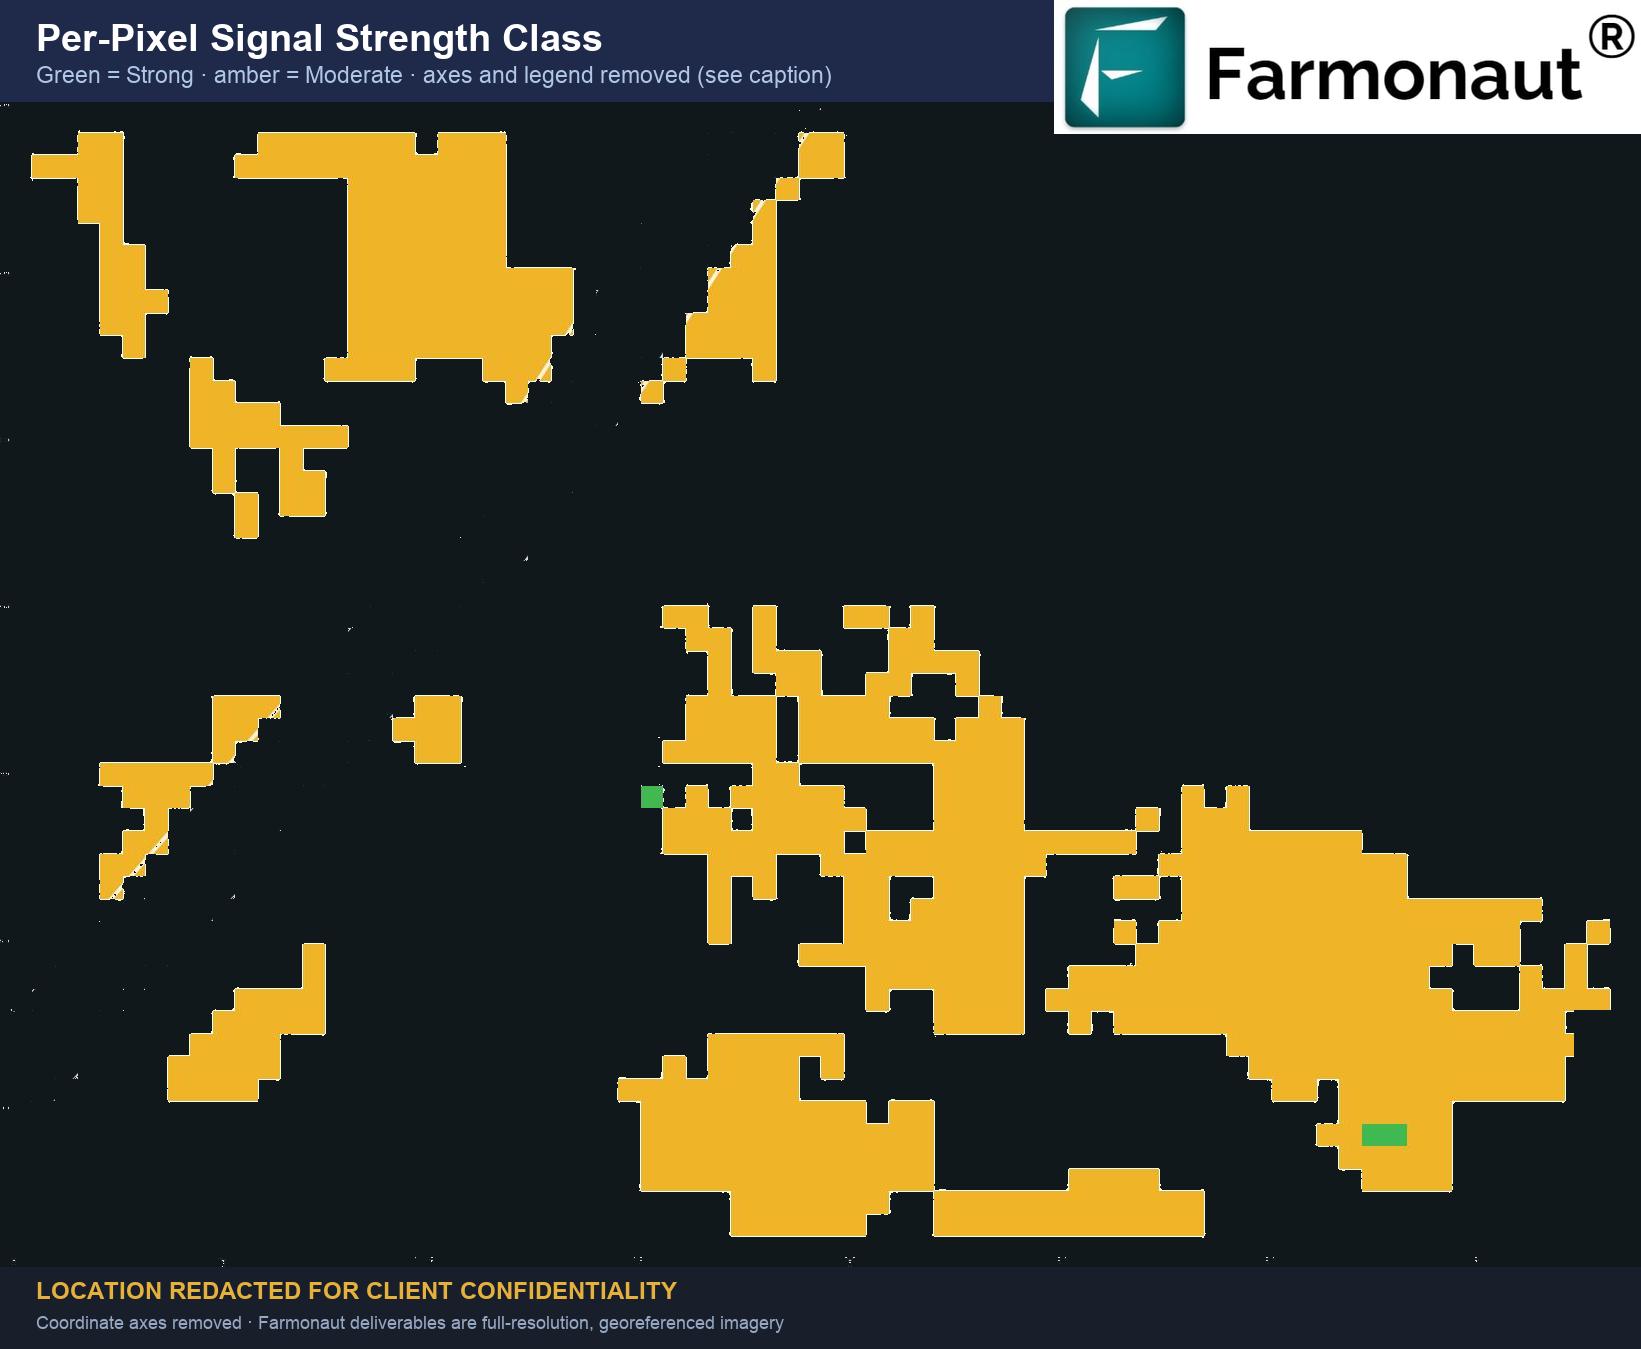
It is worth being precise about what “low confidence” does and does not mean here. It does not mean the
anomalies are false. It means the surface evidence is partial, and that ground-truthing must precede any
drill commitment. The tier label governs the order in which zones are validated and how much capital
is committed at each phase — it does not gate whether validation happens. All ten zones enter the Phase-1
validation sequence. A further safeguard also ran and came back clean: a pixel-consensus check that demotes
any zone whose polygon-average strength class overstates its in-pixel evidence found no drift on any polygon,
so the class labels in the table reconcile with the underlying pixel distributions.
A satellite report that returns zero high-confidence zones is doing its job, not failing at
it. The commercial value of this deliverable is not the USD 60.4M headline — it is the USD 289,000 to
481,000 decision cost that stands between a licence holder and knowing whether that headline is real. Be
more suspicious of a remote-sensing report where everything is high confidence than of one that tells you
two of eight evidence layers disagreed.
The screening funnel — from licence to lead targets
From anomaly to drill collar: depth, geometry and a costed program
A prioritised target list is only actionable if it comes with geometry. Every zone in this dataset
carries a modelled depth profile, a recommended drill azimuth and inclination, a hole length and a hole
count — the parameters a drilling contractor needs in order to quote. This is where gold anomaly detection
stops being a map and starts being a budget line.
The depth architecture across the block is remarkably consistent. Top of ore sits at
91 metres below surface across all zones, with the deepest modelled base at
135 metres (298 to 442 feet). Both figures are vertical distances measured downward from
local ground surface, and both sit well inside the practical depth limit for open-pit extraction of an
oxidised gold system, which typically runs to around 200 metres. Combined with the tight 2.74 weighted
strip ratio, that makes every one of these zones nominally open-pit amenable.
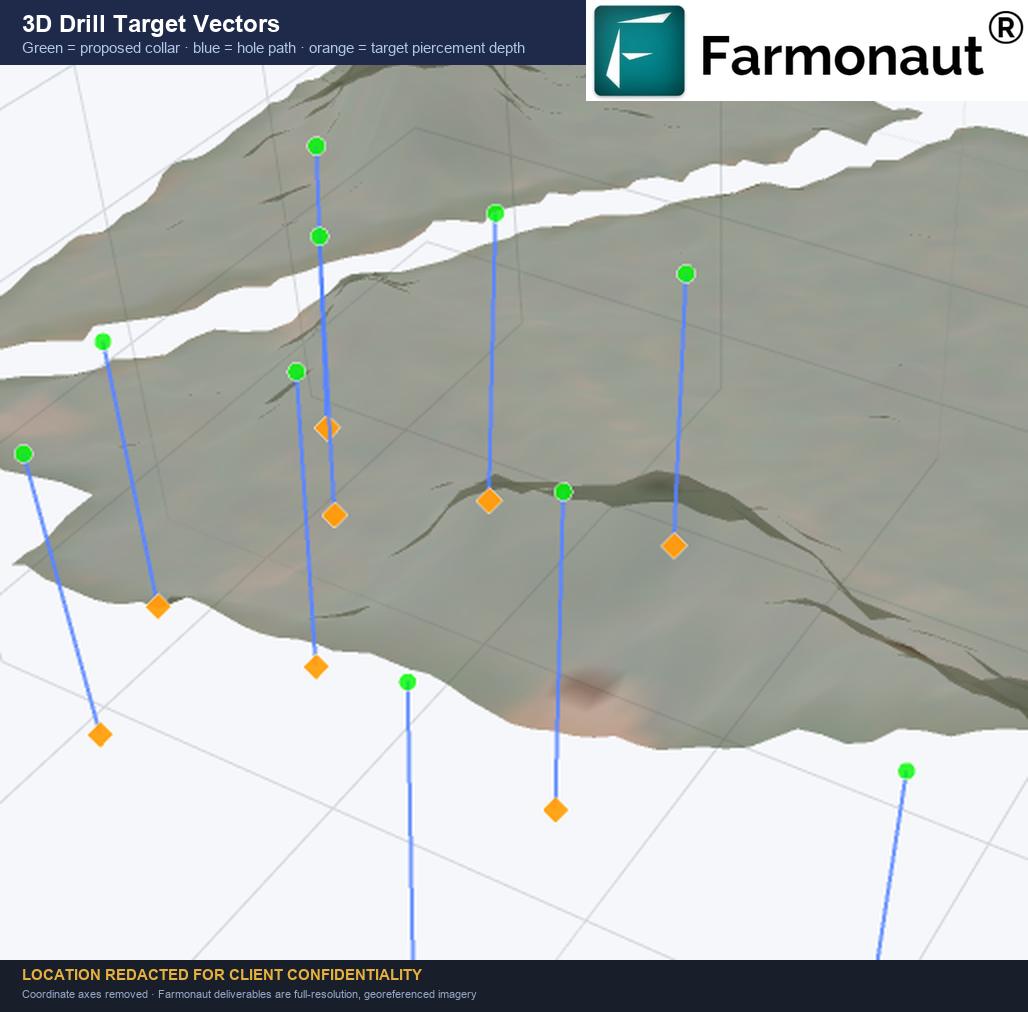
The Phase-1 drill program, costed
The recommended full program is 76 HQ diamond core holes distributed across the ten zones, weighted
towards the two lead targets — 15 holes on the largest zone and 12 on the second — with hole lengths of 161
to 172 metres and inclinations of −70° throughout. Azimuths range from 130° to 250°, each set perpendicular
to its polygon’s dominant strike so that a hole intersects the modelled vein at maximum apparent thickness.
The Phase-1 confirmation subset is the number that matters commercially: one hole per zone, ten
holes, 1,925 metres of drilling, roughly 64 rig-days on a single rig. At an all-in diamond-core cost
band of USD 150 to 250 per metre — covering drilling, logging, assay and supervision — that is
USD 289,000 to USD 481,000 to put ground truth under every one of the ten satellite
anomalies. Per zone, the spread is narrow: 185 to 198 metres and roughly USD 28,000 to 49,500 each.
| Phase-1 parameter | Value | Note |
|---|---|---|
| Holes | 10 (one per zone) | HQ diamond core, −70° inclination |
| Total metres | 1,925 m | recommended length per zone plus 15% contingency |
| Cost band | USD 289k – 481k | at USD 150–250/m all-in |
| Rig-days | ~64 days | single rig, ~30 m/day, excludes mobilisation |
| Metallurgical work | 200 lb composite | bottle-roll cyanide test plus column-leach |
| Mapping | 1:1,000 grid | structural measurements at all bedrock outcrops |
Notice that the two Marginal evidence families both have a cheaper mitigation than drilling.
A drone or ground magnetic survey at 50–100 m line spacing, and a portable XRF or ground hyperspectral
traverse, together cost a fraction of USD 289,000 — and either could promote or kill several targets before a
rig is mobilised. Sequencing the cheap disagreement-resolvers ahead of the drill is almost always the
right call.
Need the same drill-ready geometry for your licence?
Request a project quote — or explore our
satellite-driven 3D mineral
prospectivity mapping, which delivers the interactive subsurface model and drilling-angle guidance behind
figures like the one above.
The economics — and the honest negative the model returned
At a reference gold price of USD 4,054 per troy ounce, the ten zones carry a gross in-situ value of
approximately USD 46 to 60 million. Applying the blended 81% recovery factor gives a
recoverable-metal figure of roughly 9,300 to 13,000 ounces, worth about
USD 34 to 53 million. The report’s own base case — headline metal at 81% recovery — lands at
USD 48.9 million; the wider band reflects grade uncertainty at the low end and the optimistic recovery
scenario at the high end.
The sensitivity picture is undramatic in a useful way. Across the full USD 2,850 to 5,250 band, gross
in-situ value moves from USD 42.5M to USD 78.2M and recoverable value from USD 34.4M to USD 63.3M. Every
point on that curve is positive. Gold price is not the risk on this project — grade confirmation is.
Three recovery scenarios
| Scenario | Mining recovery | Metallurgical recovery | Blended | Recoverable gold | Recoverable value |
|---|---|---|---|---|---|
| Conservative | 85% | 85% | 72.25% | 334.7 kg / 10,762 oz | USD 43.6M |
| Base case | 90% | 90% | 81.00% | 375.3 kg / 12,066 oz | USD 48.9M |
| Optimistic | 93% | 94% | 87.42% | 405.0 kg / 13,022 oz | USD 52.8M |
The honest negative: no economic pit at scoping assumptions
The delivered report also ran the detection results through the same sequence a mine-planning team would
execute in Datamine Studio, Maptek Vulcan or GEOVIA Surpac — block model, pit optimisation, grade-tonnage
curve, production schedule — explicitly labelled as a synthetic, exploration-target-grade exercise with no
drill data behind it. And the pit optimiser returned a negative result: no shell with positive value
at the registered scoping assumptions. The floating-cone optimiser found no combination of blocks
that pays for its own waste stripping.
We publish that because it is the truth, and because it reframes the project correctly. At the modelled
grades, costs and price, these mineralised envelopes do not support open-pit extraction as they stand. Any
development concept would need higher grades confirmed by drilling, a selective or smaller-scale mining
method, or materially different cost assumptions. There is a second number that makes the same point from a
different angle: the mineralised envelopes hold roughly 56.8 million tonnes of material at or above cut-off,
of which the detection model expects only about 909,000 tonnes — around 1.6% — to be recoverable
ore. Satellite anomalies outline where mineralisation sits; they do not tell you how
completely it fills the outlined volume.
This block is a drill-targeting story, not yet a mining story. That is the correct reading
of a satellite screen at this stage, and it is the reading the report itself gives. We deliberately do not
publish the wider “envelope-basis” tonnage or value figures that a raw block model would reproduce — they
overshoot the detection headline by orders of magnitude and mislead even when caveated.
Other risks on the register
- ⚠ Vein continuity at depth — MEDIUM. The continuity index averages 70.1 across the block. Phase-1 core drilling on the top-priority zones is the resolver.
- ✔ Grade variability — LOW. Polygon-level grades span a narrow 0.500 to 0.609 g/t band. A bulk metallurgical test is recommended.
- 📊 Recovery factor — LOW to MEDIUM. The 81% blended assumption is conservative for oxide gold; heap-leach response typically runs 75–90% and carbon-in-leach 88–94%.
- 📊 Gold price — LOW to MEDIUM. The sensitivity model stays positive well below USD 3,000 per ounce.
- ✔ Permitting and environment — LOW. No anomaly polygon is crossed by drainage, and the nearest building sits 74 metres from the nearest zone boundary.
Impact: months to days, and 80–85% off early-stage cost
Set the deliverable against the classical alternative. To reach the same position by conventional
means — a ranked, geometrically-specified, individually-costed target list across 283 hectares — a licence
holder would be looking at a field campaign of geological mapping, trenching and geochemical sampling
measured in months, with crews, camps, access and logistics attached. The satellite route compresses that
front end from months to days, and cuts early-exploration cost by
up to 80–85%. That is the practical case for gold anomaly detection in Zambia and across
comparably vegetated African terrain: not that it is more accurate than a drill, but that it tells you which
ten hectares of a 283-hectare block deserve one.
The turnaround on a screen like this is 5 to 20 business days from receipt of the area of interest,
depending on block size and mineral complexity. The client supplies coordinates, a KML or KMZ file, or a
drawn polygon, plus the country or region and the target minerals. We select the data source — multispectral
or hyperspectral — acquire it, run the analysis, and deliver. This is the second Zambian gold block we have
published in this form; the companion study on a smaller licence area is here:
satellite gold
exploration in Zambia — three drill-ready zones.
Zero ground disturbance during the exploration phase. Nothing in this study touched the
site. No trenches were cut, no vegetation cleared, no access tracks bulldozed, no water used, no drill pads
built. For a densely vegetated Zambian block with a community 74 metres from the nearest target, that is not
a marketing line — it is the difference between screening ten targets and negotiating ten site accesses. When
drilling does begin, it begins on ten pre-ranked targets rather than on speculative ground, which is itself a
material reduction in total footprint per ounce discovered.
The phased roadmap the report recommends
- Phase 1 (months 0–6) — confirmatory drilling. Fifteen HQ diamond core holes on the largest zone at 250° / −70°, 167 m each, plus twelve on the second zone at the same geometry. A 200 lb composite sample for bottle-roll cyanide and column-leach metallurgy. Geological mapping on a 1:1,000 grid with structural measurements at every bedrock outcrop.
- Phase 2 (months 7–12) — expansion and resource definition. Two confirmation holes each on the next three zones. Ground magnetic and induced-polarisation survey across the whole 159-acre anomaly footprint — which is also the direct mitigation for the magnetic risk flag. Then a compliant resource estimate on a kriged block model.
- Phase 3 (months 13–24) — pre-feasibility and permitting. Infill drilling on a 25 m × 25 m grid to reach measured-and-indicated category. Geotechnical and hydrogeological drilling, environmental baseline studies, plan-of-operations engagement with the regulator, and a pre-feasibility study with a capital estimate to ±25% accuracy.
Glossary
- Gossan zone
- An iron-oxide-rich, weathered surface cap formed by oxidation of an underlying sulphide body. Because it sits at surface and is spectrally distinctive, it is one of the most satellite-detectable expressions of a gold system.
- Exploration target
- A conceptual, range-based statement of the potential quantity and grade of mineralisation, based on indirect evidence. It is explicitly not a Mineral Resource and cannot be used for public disclosure.
- Cut-off grade
- The lowest grade at which material is treated as ore rather than waste. Here, 0.25 g/t Au — every zone in the study sits above it.
- Strip ratio
- Tonnes of waste that must be moved per tonne of ore recovered. The block averages 2.74 : 1 weighted by tonnage; surface gold operations commonly accept up to 3.0–4.0.
- Dilution
- Waste rock unavoidably mined with the ore, which lowers the delivered grade. An 18% allowance is applied throughout this study.
- P10 / P50 / P90
- Percentiles of a modelled distribution. P50 is the median; P10 and P90 bracket the central 80% of outcomes. Quoting P10–P90 rather than a single number is what makes a satellite estimate honest.
- Blended recovery
- Mining recovery multiplied by metallurgical recovery. The 81% base case here is 90% × 90%.
- Continuity index
- A measure of how coherently a mineralised structure persists along strike and at depth. The block averages 70.1, which is why depth continuity is flagged as a medium risk.
How to run gold anomaly detection on your own licence
The workflow is deliberately simple, and it does not require you to have any prior geoscience dataset.
- ✔ Send your area of interest. Coordinates, a KML or KMZ file, or a polygon drawn on a map — plus the country or region and your target mineral or minerals.
- 📊 We select and acquire the data. Multispectral or hyperspectral, chosen to suit your terrain, cover and commodity.
- ✔ You receive a premium mineral-intelligence report. High-potential zones, prospectivity heatmaps, estimated location and depth ranges, indicative quantities, geological interpretation of faults, alteration and host rock, and seasonal anomaly validation — as a PDF plus georeferenced GIS files.
- 📊 Or go Premium+ for TargetMax™ Drilling Intelligence. Optimal drilling-angle recommendations, higher ore-intersection probability, reduced drilling risk, interactive 3D subsurface models of vein structures and mineral distribution, plus commercial conclusions and next-step guidance.
- ⚠ Expect 5 to 20 business days, depending on block size and mineral complexity.
Farmonaut has applied this approach across 100,000+ hectares, 20+ mineral
types and 25+ countries spanning Africa, South America, North America, Asia and
Australia — precious metals, base metals, energy and battery minerals, industrial minerals, specialty
high-value materials and rare earth elements.
Map your mining site from orbit
Draw your licence boundary, pick your target mineral, and see what twenty-one orbital data layers say
about your ground — before you commit a single field day.
Frequently asked questions
How accurate is gold anomaly detection in Zambia compared with ground sampling?
They answer different questions, so accuracy is the wrong comparison. A satellite screen is a prioritisation tool: it tells you which parts of a licence carry a coherent multi-sensor signature consistent with gold mineralisation, and it does so across the whole block at once. Ground sampling and drilling are confirmation tools: they measure grade at a point. This study is a good illustration — it produced a defensible exploration-target range of roughly 11,450 to 14,900 ounces and a ranked drill order, while simultaneously classifying all ten zones as low confidence and specifying the USD 289,000 to 481,000 drill program needed to test them. Neither number replaces the other.
Why were all ten zones rated low confidence if the model found nearly 15,000 ounces?
Because confidence is scored on evidence agreement, not on tonnage. Each anomaly carries eight independent signal families. On this block, thermal anomaly returned Strong on all ten zones and vegetation biogeochemistry on five — but hydrothermal alteration and magnetic signature both returned Marginal on all ten, and every polygon raised at least two detection-risk flags. Under the published classification rule, a Moderate composite signal class with that flag load resolves to Low. The tier governs the order of validation and the depth of capital commitment per phase; it does not mean the anomalies are false, and it does not exclude any zone from the Phase-1 validation sequence.
Does dense vegetation stop satellite mineral detection working in Zambia?
It degrades the optical layers substantially, which is exactly what happened here — the short-wave infrared alteration mapping came back with minimal support on every zone. It does not stop the method, because the screen does not depend on optical data alone. Radar surface roughness, day–night thermal contrast, magnetic basement structure and geobotanical stress in the canopy all carry geological information through or around cover, and on this block the thermal and vegetation-biogeochemistry layers did the heavy lifting. The honest consequence is that a vegetated Zambian block produces a lower-confidence result than a bare arid one, and the report says so rather than hiding it.
What does the “no economic pit” result mean for the project?
It means the block is a drill-targeting opportunity rather than a mine plan. The conceptual pit optimiser, run as a clearly labelled synthetic exercise on satellite-derived grades with no drill data behind it, found no shell that pays for its own waste stripping at the registered scoping assumptions. Getting to a development concept would require higher grades confirmed by drilling, a selective or smaller-scale mining method, or materially different cost assumptions. A related figure makes the same point: the mineralised envelopes hold about 56.8 million tonnes above cut-off, of which the model expects only around 1.6% — roughly 909,000 tonnes — to be recoverable ore.
Can these numbers be used in a public disclosure or an investor prospectus?
No. Every resource and economic figure here is a satellite-derived exploration target only. No drilling, trenching, sampling or assaying sits behind any of it, and the confidence classes used are deliberately not a mineral-resource classification. These are not Mineral Resources or Mineral Reserves under JORC, NI 43-101, SK-1300 or SAMREC and must not be used for public disclosure or investment decisions. The recommended path to a disclosure-grade estimate runs through Phase 2 of the roadmap above: real assays, a kriged block model, and a competent person’s sign-off.
How long does a satellite mineral detection scan take, and what do I need to supply?
Five to twenty business days from receipt of your area of interest, depending on block size and mineral complexity. You supply the area of interest — coordinates, a KML or KMZ file, or a polygon drawn on a map — plus the country or region and your target mineral or minerals. We choose the data source, acquire it, run the analysis and deliver the report with georeferenced GIS files. You can start by drawing your boundary at mining.farmonaut.com or by sending details through the mining query form.
Which minerals besides gold can be detected this way?
The same multi-sensor approach has been applied across 20+ mineral types: precious metals including gold and silver; base metals such as copper, cobalt, nickel, zinc, iron and manganese; energy and battery minerals including lithium and uranium; industrial minerals such as gypsum, dolomite and quartz; specialty and high-value materials including tantalum, niobium, beryllium, diamonds and star garnets; and rare earth elements. Each commodity gets its own discrimination logic, because the spectral, thermal and structural signature you are hunting differs completely between, say, a gossan-capped gold system and a lithium-bearing pegmatite.
All resource, grade and economic figures in this case study are satellite-derived exploration-target estimates reproduced from a client report, presented as ranges to reflect the underlying modelled distributions. They are not Mineral Resources or Mineral Reserves under JORC, NI 43-101, SK-1300 or SAMREC, no drilling or assaying underlies them, and they must not be relied upon for public disclosure or investment decisions. The conceptual mining study referenced is explicitly synthetic and exploration-target grade. The client’s identity, licence designation, coordinates, district and survey grid have been redacted throughout, and satellite figures have been processed to remove coordinate axes, basemap and boundary detail; delivered client imagery is full-resolution and georeferenced. Reference gold price USD 4,054 per troy ounce as stated in the source report.
Discussion
Questions, corrections or field experience? Share them below. First-time comments are reviewed before they appear, and your email is never published.
No comments yet. Be the first to add a question or your experience.

 Huckleberry Garnet LLC
 Dalgety Minerals Pty Ltd
 Vortex Minerals Pty Ltd
 Faith At Work (Pty) Ltd
 Geotech Mining Solutions plc
 Vulcan International Limited
 Kidepo Associates
 GKY Mining
 Alkimy SARL
 Double A Trading
 GemSprout Metals Limited
 Qader Group
 Ileys General Trading
 SG Gold Mining LLC
 VRV Global Pte Ltd
 Omsri International FZE
 G.I.T.T.
 Jaunita Erss Ltd
 Almosi SARL
 SRK Consulting
 Berks Gold Limited
 Mwerezi Minerals Company Limited
 Exploration consultancy · South Africa · Gold










