

Satellite Gold Exploration Zambia: 3 Drill-Ready Zones
A concession holder needed to know which part of a ~50 ha block deserved a diamond drill rig. An orbital multi-sensor scan narrowed the answer to 15% of the ground, ranked three anomaly zones by drill priority, and handed back a costed first-pass drill program — with no field crew mobilised.
Region Zambia
Licence 49.66 ha
Zones detected 3
Style Gossan / epithermal
Confidence 3 × Medium
Early-stage exploration runs on a painful sequence: you must spend money to find out whether the ground is worth spending money on. Cut grid lines, sample soils, dig trenches, run geophysics — then, months later, learn that most of the block was barren. This case study follows how satellite gold exploration in Zambia reversed that order on a single gold licence, letting the holder rank drill targets and price a Phase-1 program before a single crew left town. Every figure below comes from the Farmonaut Satellite Geosciences deliverable; site-identifying detail has been removed at the client’s request.
This case study is published with the concession holder’s permission. The client name, concession name, licence number, province, district and every coordinate — decimal-degree and projected grid alike — have been removed. Each satellite figure below has been deliberately redacted: the true-colour basemap replaced with a neutral field, coordinate axes and the licence outline cropped away, the interior softened, and a notice burned into the pixels. Farmonaut’s own client deliverables are always full-resolution, fully georeferenced imagery and GIS files — the redaction here is a confidentiality measure, not a reflection of output quality.
Want the same screen run over your own ground? You can request a quote for a satellite mineral scan here, or go straight to mapping your licence boundary at mining.farmonaut.com.

The challenge: fifty hectares, one budget, and no idea where to drill
The holder controlled a 49.66-hectare (122.7-acre) gold licence in Zambia — a country whose mining reputation is built on the Copperbelt, but whose gold potential sits in far less densely explored ground. Surface indications pointed at oxidised, iron-stained rock: the weathered cap, or Gossan, that frequently sits above a buried sulphide-bearing vein system. Encouraging. But encouraging is not the same as drillable.
Fifty hectares sounds small until you have to drill it. A diamond core hole is a five-figure commitment before assay; a mis-sited program burns capital and, worse, produces a negative result on ground that was never the target. The question in front of the investment committee was narrow and expensive: which part of this block earns the rig, and at what angle should the holes go in?
The conventional route to that answer — line-cutting, soil geochemistry, trenching, a ground geophysical survey — takes months, disturbs the surface across the whole block including the parts that turn out barren, and consumes a large slice of an early-stage budget before anyone knows if the ground repays it. For a junior explorer, that is a lot of money spent buying down uncertainty the slow way.
Every mineral and every alteration zone reflects sunlight, infrared and radar with a distinctive spectral signature. So the first and coarsest exploration question — where is this ground even worth walking? — can be answered from orbit, before boots, rigs or road-building are committed.
That is exactly what satellite gold exploration is built for. Rather than starting on the ground, we start in space: reading reflected electromagnetic energy across many wavelengths, flagging mineralised target zones, alteration halos and the structures that control them, then handing field teams a ranked, drill-ordered target list. The ground work still happens — it simply happens second, and only on the pixels that survived the screen.
The approach: fusing 20+ satellite layers into one gold prospectivity surface
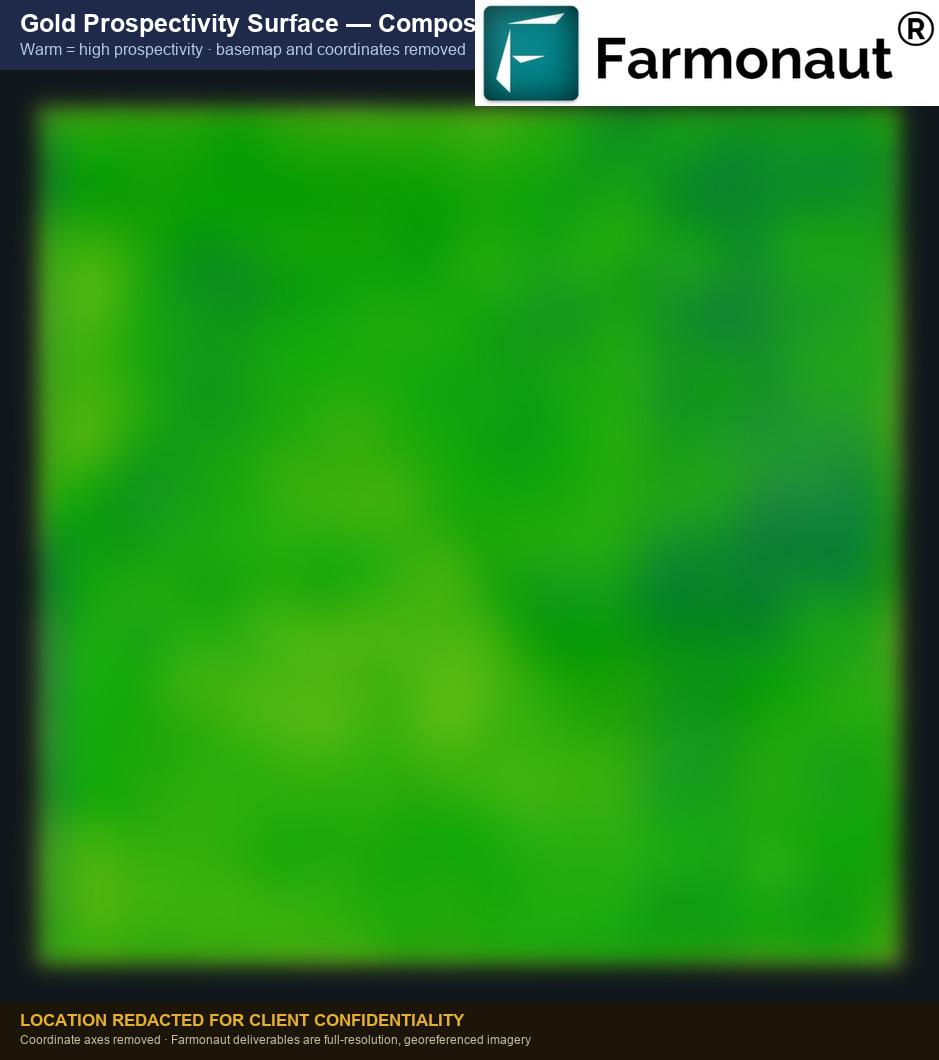
The method rests on data fusion. No single satellite tells you where gold is. But when more than twenty independent orbital and geophysical layers are co-registered and combined, the places where many of them agree become very hard to dismiss as noise. Our engine fuses those layers pixel by pixel at roughly a 10-metre ground sample into a single composite Gold Prospectivity Index (GPI) — a 0-to-1 favourability surface across the whole licence — and then cuts discrete anomaly polygons out of that surface wherever the score clears a favourability threshold.
| Sensor / data family | What it contributes to the gold model |
|---|---|
| Multispectral optical (visible / near-infrared, 10 m) | Vegetation indices, iron-oxide ratios and hydrothermal-alteration colour composites. |
| Short-wave infrared mineral mapping (30 m) | Clay–sericite, argillic and carbonate–chlorite alteration ratios — the fingerprints of a hydrothermal system. |
| C-band radar (Sentinel-1) | Dual-orbit lineament density, surface roughness and structural fabric — the faults and fractures that host veins. |
| L-band radar (PALSAR-2) | HH/HV backscatter and temporal stability — vein-controlled relief and bedrock exposure. |
| Thermal (MODIS land-surface temperature + ASTER emissivity) | Day–night temperature anomalies flagging silicification and sulphide oxidation. |
| Global magnetic-anomaly grid | Basement structure and buried intrusive footprints — the heat engines that drive epithermal gold systems. |
| Digital Elevation Model (30 m) | Slope, aspect, hillshade, flow accumulation and drainage geomorphology for terrain and placer context. |
| Optical time series | Bare-ground persistence, dry-season vegetation stress and laterite-cover penalties. |
Each layer is normalised and folded into a weighted composite of multiple sub-scores spanning alteration mineralogy, structural density, surface evidence, thermal response and geomorphological host criteria. Polygons are then extracted where favourable pixels form spatially coherent clusters — combining how elongated and how smooth each cluster is, consistent with real vein-controlled targets rather than scattered single-pixel noise. Industry-standard resource parameters convert those polygons into tonnage and contained metal:
Contained gold (kg) = Tonnage (t) × Grade (g/t) ÷ 1,000
Parameters used here: density 2.4 t/m³ | prism factor 0.7 | cut-off 0.25 g/t Au | dilution 18% | blended recovery 81%
A genuine hydrothermal system produces spatially coherent anomalies: smooth, contiguous warm zones that survive multi-sensor fusion. A speckled “salt-and-pepper” pattern usually means noise. On this licence the high-prospectivity ground formed clean, connected clusters — corroborating evidence, in itself, that the signal is geological.

A deliberately conservative funnel
Raw prospectivity is not a drill target. The candidate set passes through four successive refinement filters — a priority screen, an artisanal-and-placer filter, a cover-and-vegetation detectability penalty, and a final geological × economic filter. Fewer than 30% of the pixels in the first-stage footprint survive all four stages. That is a design choice: it trades some recall for a materially lower false-positive rate, which is the right trade when the output is going to inform a capital allocation.

The results of satellite gold exploration in Zambia: three gold zones
Out of the full 49.66-hectare block, the satellite gold exploration Zambia scan resolved a 7.45-hectare (18.42-acre) anomaly footprint — 15.0% of the surveyed area — split into three discrete economic anomaly zones. All three classify as Gossan Zone mineralisation: an oxidised iron cap over a vein-hosted system, which is both the most spectrally legible style from orbit and, at these depths, the most straightforward to drill.
Aggregated across the three zones, the scan estimates an exploration target of roughly 3,000–4,700 troy ounces of in-situ contained gold (≈94–146 kg on a P10–P90 basis; central estimate ~3,970 oz), hosted in on the order of 73,000–89,000 tonnes of mineralised rock — the lower figure in-situ, the upper after 18% mining dilution — at a tonnage-weighted head grade of 1.387 g/t Au, with individual zone grades running 1.277 to 1.565 g/t. At the reference gold price of USD 4,066 per troy ounce used in the deliverable, that is a gross in-situ value of roughly USD 12.3–19.1 million (central ~USD 16.1M). Applying an industry-standard blended recovery of 81% — 90% mining recovery × 90% metallurgical — the indicative recoverable metal is on the order of 2,450–3,810 oz worth roughly USD 9.9–15.5 million.
Just as important as the metal: all of it sits shallow. The modelled top of ore is 38 metres below surface and the deepest base is 77 metres, which puts the whole footprint firmly in open-pit-amenable territory — comfortably inside the ~200 m practical limit for grade-rich oxide systems. The tonnage-weighted strip ratio is 1.118, against the 3.0–4.0 that surface gold operations routinely accept.
These are satellite-derived estimates presented as ranges, not a Mineral Resource. Nothing here is reported under JORC, NI 43-101, SK-1300 or SAMREC, and no drilling has yet tested the model. The value of the numbers is relative: they rank targets, size the prize, and justify (or refuse) a drill budget. Only Phase-1 drilling and assay can convert any of it into a resource category.
Where the value sits: a concentrated three-zone portfolio
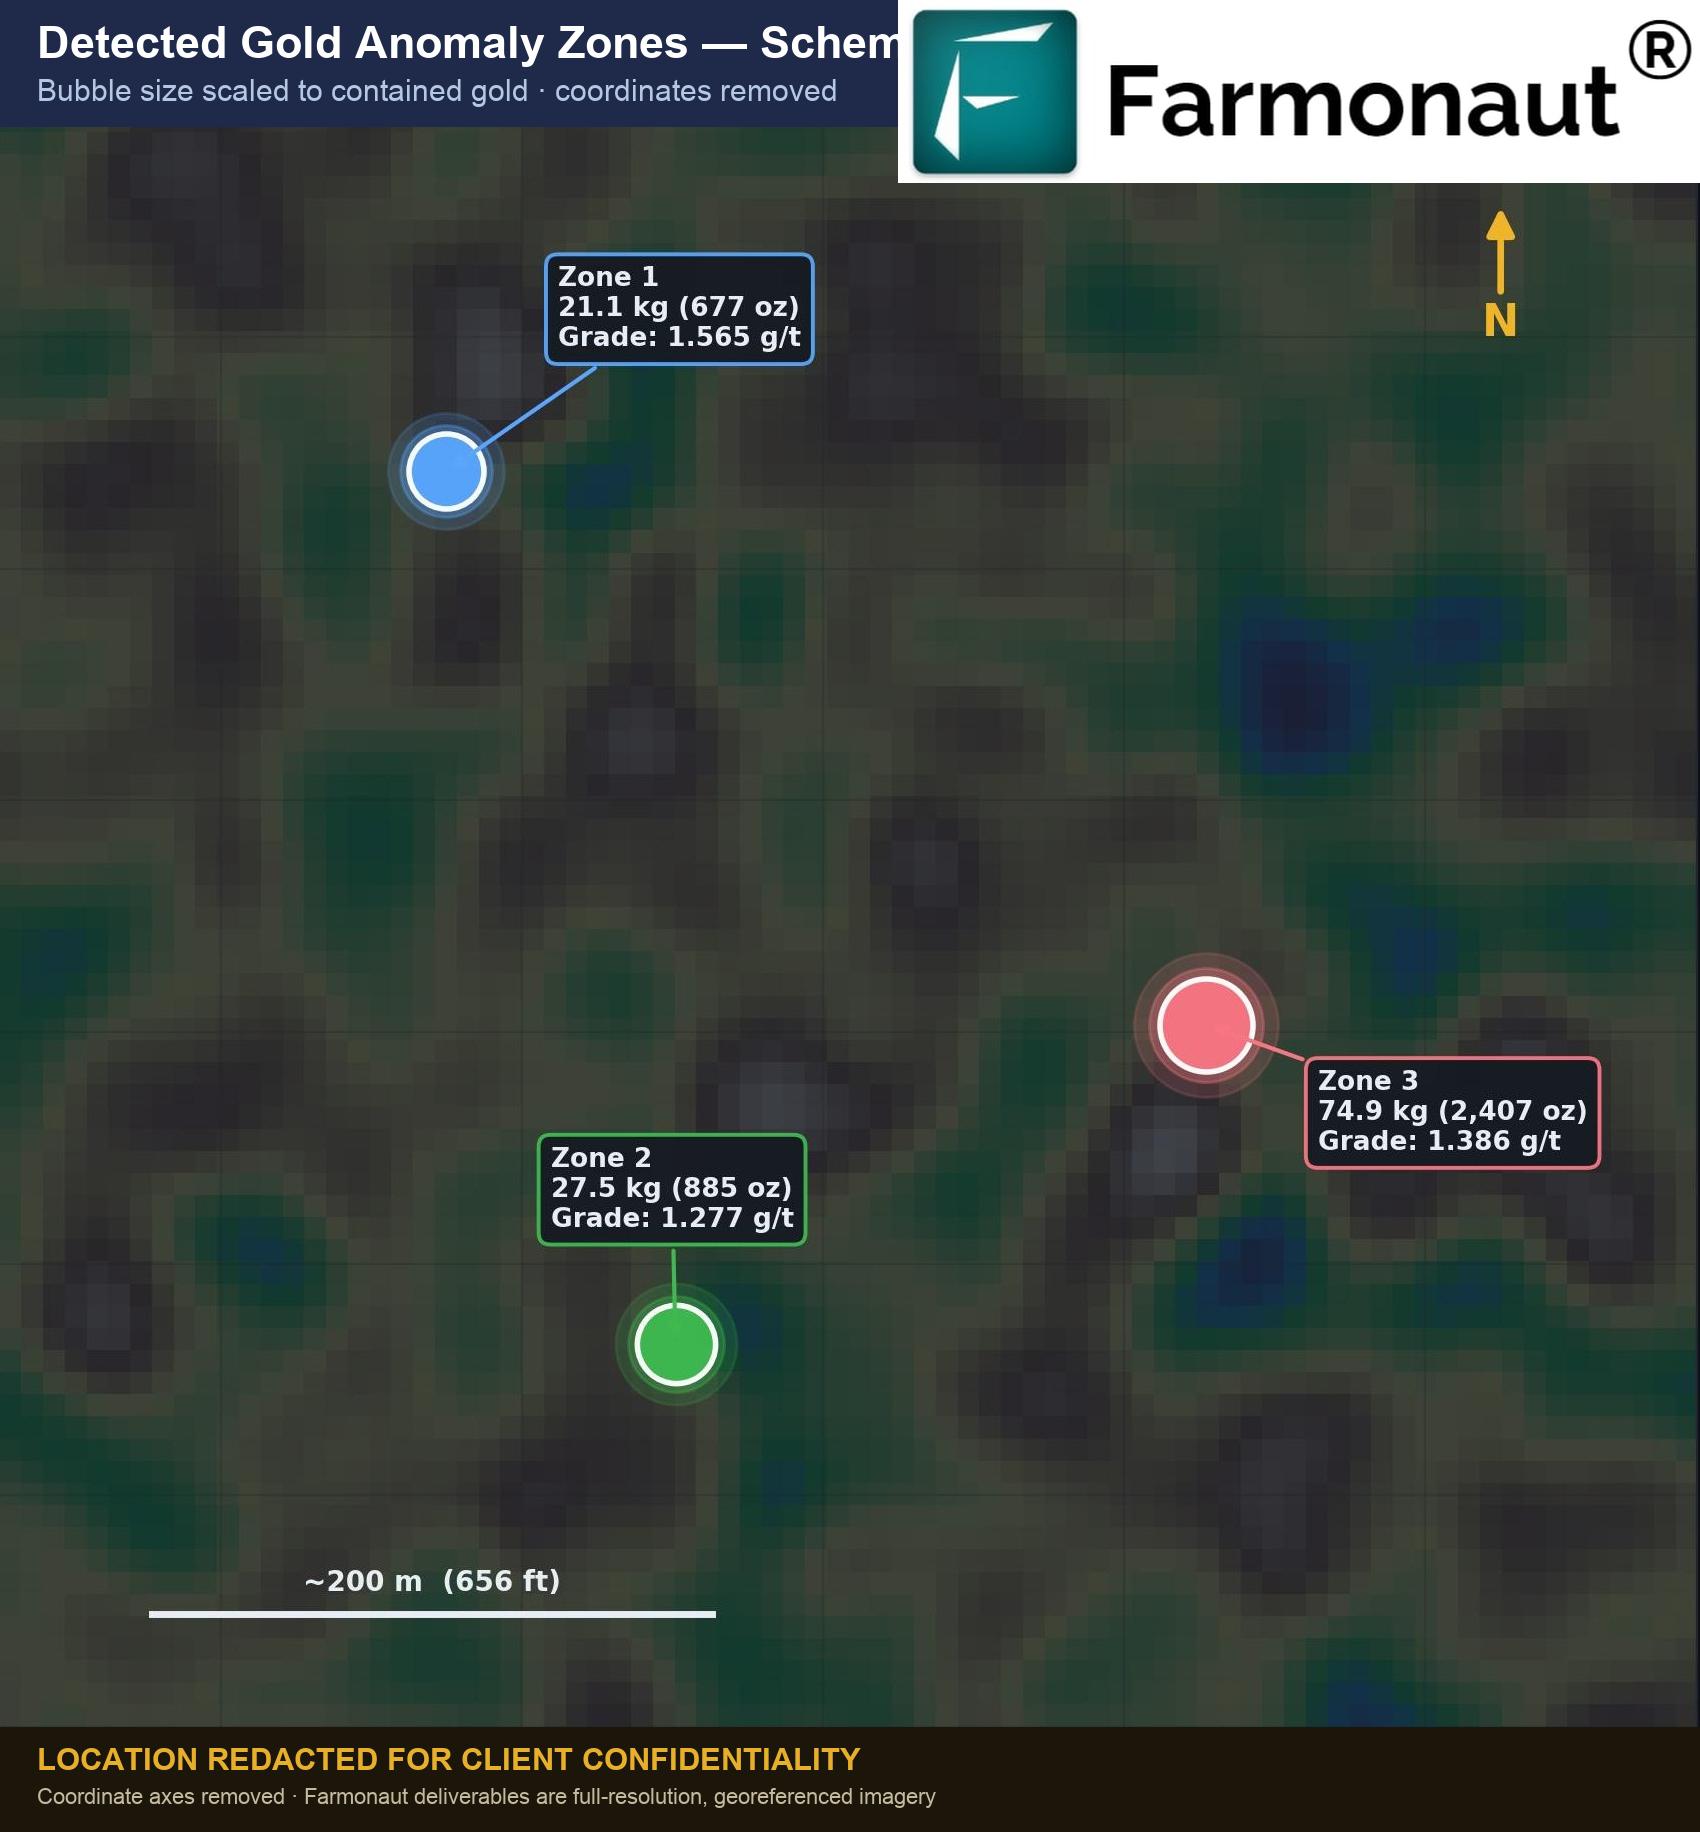
The portfolio is top-heavy, which is good news for drilling economics. Zone 3 alone hosts 60.7% of the contained gold; together with Zone 2 it accounts for 82.9%. Capital can concentrate on one dominant target and one secondary, with the third zone sequenced behind them.
Master comparison — all three zones side by side
| Parameter | Zone 3 | Zone 2 | Zone 1 | Portfolio |
|---|---|---|---|---|
| Drill priority tier | Tier 2 — High interest | Tier 3 — Follow-up | Tier 3 — Follow-up | — |
| Contained gold (oz) | 1,840–2,847 | 701–1,012 | 479–843 | ~3,000–4,700 (P10–P90) |
| Share of contained gold | 60.7% | 22.3% | 17.1% | 100% |
| Diluted head grade (g/t Au) | 1.386 | 1.277 | 1.565 | 1.387 (wt. avg) |
| Pixel grade range (g/t) | 1.06–1.64 | 1.01–1.46 | 1.11–1.95 | 1.01–1.95 |
| Ore tonnage, diluted (t) | 54,029 | 21,543 | 13,453 | 89,025 |
| Strike × width (m) | 402 × 272 | 261 × 149 | 209 × 58 | — |
| Surface area (ha) | 4.507 | 1.820 | 1.127 | 7.454 |
| Depth top → base (m) | 38 → 73 | 42 → 77 | 39 → 74 | 38 → 77 |
| Strip ratio | 1.086 | 1.200 | 1.114 | 1.118 (wt. avg) |
| In-situ value (USD) | ~$7.5–11.6M | ~$2.9–4.1M | ~$1.9–3.4M | ~$12.3–19.1M |
| Structural confidence | 83.4 | 80.6 | 82.5 | 82.2 (avg, vs 100 threshold) |
| Signal strength | Strong | Strong | Strong | 3 / 3 Strong |
| Confidence tier | Medium | Medium | Medium | 0 High · 3 Medium · 0 Low |

Zone deep-dives
Zone 3 — the anchor target
The largest and highest-priority zone: 4.5 hectares, a 402 m strike, and 60.7% of the portfolio’s contained gold at a grade almost exactly on the concession average. Thermal, radar and vegetation-biogeochemistry signals all register Strong here, and its radar/roughness response ranks in the top 1% of the whole licence. Top of ore is the shallowest of the three at 38 m, and its strip ratio of 1.086 is the most favourable.
Zone 2 — the cleanest pixel signal
Zone 2 holds 22.3% of the contained gold at the lowest grade of the three, but it has the most internally consistent signal: 95% of its pixels class as Strong, the highest proportion on the licence, and it fires Strong on four independent signal families. It also carries the only structural/lineament Strong rating in the portfolio. Its caveat is positional — the centroid sits within 200 m of the licence boundary, so part of the anomaly may be clipped by the survey edge.
Zone 1 — the highest-grade target
The smallest zone by area, but the richest by grade: 1.565 g/t, some 12.9% above the tonnage-weighted concession average, with pixel grades reaching 1.95 g/t. It also posts the licence’s best continuity index (59.3), suggesting a more coherent vein structure than the larger zones. Its vegetation-biogeochemistry response ranks in the top 1% of the block — a strong biogeochemical halo over the mineralisation.
Reading the confidence: what the satellites agreed on — and what they didn’t
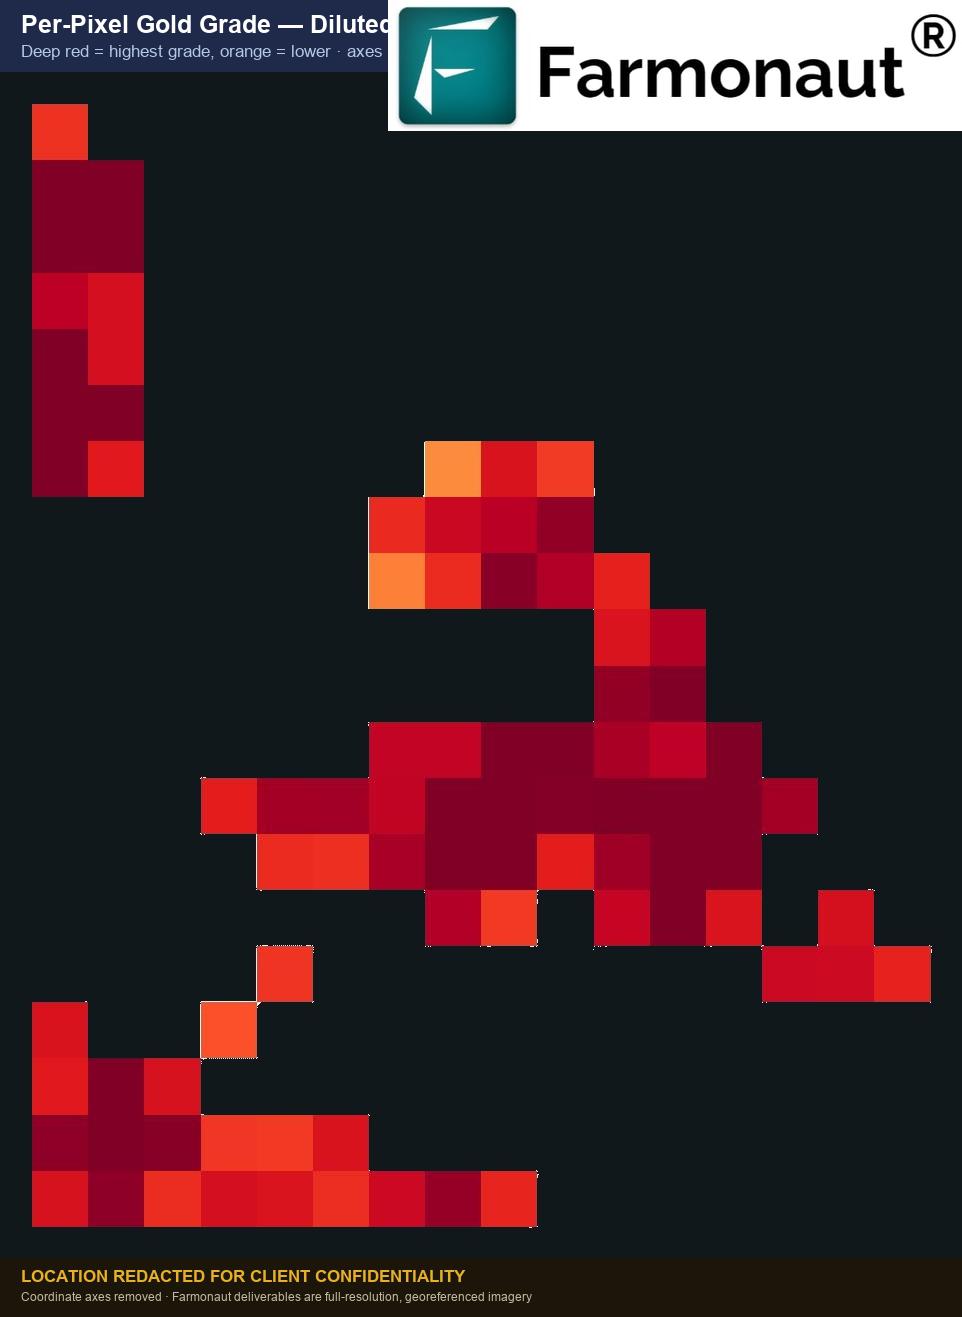
A prospectivity score is only as useful as the honesty attached to it. That is the part of satellite gold exploration in Zambia that most reports get wrong. Every anomaly here carries an explicit confidence label derived from two things: its multi-sensor signal-strength class, and the number of independent risk filters that disagreed with the headline signal. On this licence the result was uniform — zero High-confidence, three Medium-confidence, zero Low-confidence zones.
Medium means something specific: the signature is real, but at least one corroborating layer dissents. That is not a reason to walk away; it is a scoping instruction for Phase-1 fieldwork. Being explicit about it is the point — a scan that returns everything as “high confidence” is telling you about its own calibration, not about your ground.
Three specific risk flags were raised, each with a concrete field action attached. This is the part of a satellite report that actually shapes a work program:
| Risk flag | Severity | Affects | What it means | How Phase-1 resolves it |
|---|---|---|---|---|
| Alteration only | 2.0 | Zone 3 | Alteration signature present, but no coincident vein or breccia outcrop signature. | Outcrop traverses and rock-chip sampling to confirm mineralisation style. |
| No magnetic anomaly | 1.0 | Zone 3 | No magnetic response coincident with the polygon in the global grid. | Drone or ground magnetic survey at 50–100 m line spacing. |
| Near licence edge | 1.0 | Zone 2 | Centroid within 200 m of the survey boundary; the polygon may be clipped. | Extend the survey area by 500 m and re-run to recover the full footprint. |
A marginal magnetic reading does not mean there is no intrusive driver; the global magnetic grid is coarse relative to a 50-hectare block. It means this dataset cannot resolve the question at this scale. The correct response is a targeted ground survey, not a downgrade of the target — and that distinction is worth roughly a five-figure decision.

What satellite gold exploration in Zambia revealed about the geology
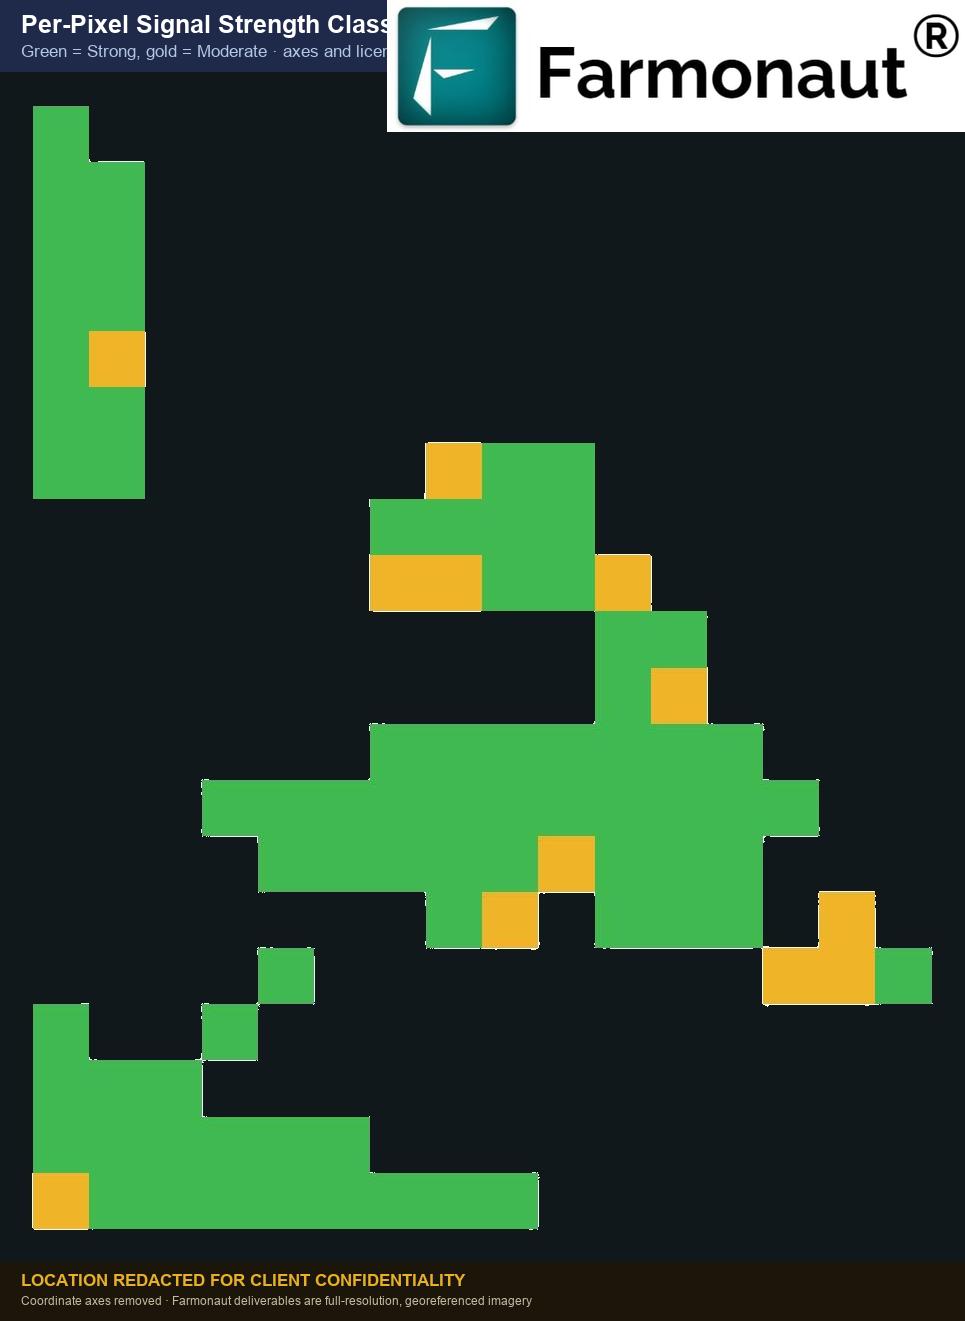
Read as one picture, the evidence stack from the satellite gold exploration Zambia scan describes a coherent system. Iron-oxide enrichment at surface marks the Gossan cap. Sericite-bearing alteration halos indicate phyllic alteration around a hydrothermal conduit. A felsic-to-intermediate host rock completes what is effectively the diagnostic triplet for low-sulphidation epithermal gold. Every anomaly polygon falls inside that favourable alteration footprint.
Structurally, radar picks out an average of 140 lineaments per zone — consistent with a fault-and-fracture network of the kind that emplaces veins. Terrain is benign: mean slopes of about 18°, well under the 25° at which open-pit geotechnics start to complicate. Drainage is well organised but crosses none of the anomaly polygons, and the low placer-geomorphology scores confirm these are bedrock-hosted vein targets, not reworked alluvial concentrations — the drillable, higher-value category.

From anomaly map to drill plan: a costed Phase-1 program
An exploration target that does not resolve into a drill plan is trivia. This is where satellite gold exploration in Zambia earns its keep. Each zone carries a recommended collar geometry — azimuth perpendicular to the modelled strike, a −70° incline, and a hole length sized to punch through the modelled ore interval with margin.
| Zone | Azimuth | Incline | Hole length | Holes recommended | Method |
|---|---|---|---|---|---|
| Zone 3 | 260.0° | −70° | 93 m | 7 | Diamond core (HQ) |
| Zone 2 | 163.2° | −70° | 98 m | 4 | Diamond core (HQ) |
| Zone 1 | 180.0° | −70° | 94 m | 3 | Diamond core (HQ) |
Before committing the full fourteen-hole program, a cheaper question comes first: does one hole per zone hit what the satellites predicted? That confirmation program — one hole per zone at the recommended length plus a 15% contingency — totals 329 metres. At an all-in diamond-core cost band of USD 150–250 per metre (drilling, logging, assay and supervision) that is USD 49,300 to USD 82,200, and at roughly 30 m/day single-rig advance it takes about 11 rig-days, excluding mobilisation.
| Zone | Planned metres | Cost @ $150/m | Cost @ $250/m | Rig-days |
|---|---|---|---|---|
| Zone 3 | 107 m | $16,076 | $26,793 | 3.6 |
| Zone 2 | 113 m | $16,956 | $28,261 | 3.8 |
| Zone 1 | 109 m | $16,296 | $27,160 | 3.6 |
| Total | 329 m | $49,328 | $82,213 | 11.0 |
Set that against the prize. A confirmation program costing well under USD 100,000 tests an exploration target with an indicative recoverable value in the USD 9.9–15.5 million range. That ratio — not the headline ounce count — is the actual decision the satellite scan enables.

How the economics move with the gold price
Because contained metal is fixed by geology and only the price varies, the economics scale linearly — which makes the downside easy to test. At USD 2,850/oz, roughly 30% below the reference price, the central gross in-situ value is still USD 11.3 million with USD 9.2 million recoverable. Positive economics persist down through USD 3,000/oz.
Recovery assumptions matter just as much. Bracketing the base case gives a conservative scenario at 72.25% blended recovery (2,867 oz, ~USD 11.7M), the base case at 81% (3,215 oz, ~USD 13.1M), and an optimistic case at 87.42% (3,469 oz, ~USD 14.1M) — all on central-estimate contained metal. For an oxide gold system, 81% is a conservative starting assumption: heap-leach response typically runs 75–90% and CIL 88–94%.
The impact: months compressed into days, ground left undisturbed
The commercial case for satellite gold exploration in Zambia — or anywhere else — is not that it replaces drilling. It is that it changes what you know before you drill, and how much you spend to get there.
- ⏱ Timeline compression. A screen that would take months of line-cutting, sampling and ground geophysics is delivered in days — our standard turnaround runs 5–20 business days depending on area and mineral complexity.
- 💰 Cost reduction. Early-exploration spend on a screened block drops by up to 80–85% versus a conventional full-area ground campaign, because the ground work only touches the fraction that survived the screen.
- 🎯 Capital concentration. Here, 85% of the licence was set aside as lower priority, and 82.9% of the contained gold sat in just two zones — so the drill budget could be sequenced rather than spread.
- 🌱 Zero ground disturbance. No trenching, no grid-cutting, no access tracks during the exploration phase. Nothing is disturbed on ground that later proves barren.
- 📐 Decision-grade geometry. Azimuths, inclines, hole lengths and depth intervals arrive with the target list — so the first hole is a test of a hypothesis, not a guess.
Because the entire screen happens from orbit, the exploration phase leaves no physical footprint at all — no cleared lines, no trenches, no access roads across ground that will not be developed. On this licence, that meant 42 of the 50 hectares were never touched. For operators facing community consultation or environmental baseline requirements, an orbital-first sequence materially narrows what has to be permitted and disturbed.
The scale behind that claim: we have now scanned 100,000+ hectares across 25+ countries for 20+ mineral types, from precious and base metals to battery and industrial minerals. Explore what a scan covers on the satellite-based mineral detection page, or see how the 3D prospectivity outputs work in this satellite-driven 3D mineral prospectivity mapping overview.
What comes next on this licence
- Phase 1 — confirmatory drilling (months 0–6). Seven HQ diamond core holes on Zone 3 and four on Zone 2; a composite sample for bottle-roll cyanide test work and column-leach metallurgy; detailed geological mapping on a 1:1,000 grid with structural measurements at every bedrock outcrop.
- Phase 2 — expansion and resource definition (months 7–12). Two confirmation holes on Zone 1; a ground-magnetic and IP survey across the licence to close the magnetic evidence gap; and a compliant resource estimate using a kriged block model.
- Phase 3 — pre-feasibility and permitting (months 13–24). Infill drilling at 25 m × 25 m on the top-priority zones for a measured-and-indicated category; geotechnical, hydrogeological and environmental baseline studies; and a Pre-Feasibility Study with a capital estimate to ±25% accuracy.
How to run this screen on your own ground
Commissioning satellite gold exploration in Zambia — or on any licence worldwide — is deliberately light on the client side. You provide the area of interest — coordinates, a KML/KMZ, or a drawn polygon — plus the country or region and the target mineral. We select the data source, acquire and process it, and deliver within 5–20 business days depending on area size and mineral complexity.
| What you get | Premium report | Premium+ report |
|---|---|---|
| High-potential zone identification & prospectivity heatmaps | Included | Included |
| Estimated location, depth range and indicative quantity | Included | Included |
| Geological interpretation — faults, alteration, host rock | Included | Included |
| Seasonal anomaly validation | Included | Included |
| PDF report + georeferenced GIS files | Included | Included |
| TargetMax™ drilling intelligence — optimal drilling angles | — | Included |
| Interactive 3D subsurface models of vein structures | — | Included |
| Commercial conclusions and next-step guidance | — | Included |
Find out what is under your licence — before you drill it
Send us your AOI and target mineral. We will tell you which fraction of the ground carries a coherent multi-sensor signal, how the targets rank, and where the first holes should go.
Glossary — the terms in this case study
- Gossan
- A weathered, iron-oxide-rich cap formed by the surface oxidation of a sulphide body. Highly visible to multispectral sensors and a classic pathfinder to buried mineralisation.
- Gold Prospectivity Index (GPI)
- A 0-to-1 composite favourability score, computed per pixel by fusing many independent satellite and geophysical layers into one surface.
- Diluted grade
- The head grade after mixing in waste rock that will unavoidably be mined with the ore — here an 18% dilution allowance. Lower and more realistic than the in-situ grade.
- Cut-off grade
- The minimum grade at which material is worth processing. All three zones here sit above the 0.25 g/t Au cut-off applied.
- Strip ratio
- Tonnes of waste that must be removed per tonne of ore. Below about 3.0–4.0 is generally favourable for a surface gold operation.
- P10 / P50 / P90
- Percentile estimates. P10 is the pessimistic case, P50 the central, P90 the optimistic. Reporting all three is the honest way to express a satellite-derived exploration target.
- Structural confidence
- A measure of how coherently the mapped structural fabric frames an anomaly. On this licence it averaged 82.2 against a high-confidence threshold of 100.
- Exploration target
- A conceptual estimate of the potential quantity and grade of a mineralised body, expressed as ranges. It is explicitly not a Mineral Resource.
Frequently asked questions about satellite gold exploration in Zambia
Can a satellite actually detect gold itself?
No — and any provider claiming otherwise should be treated with suspicion. Gold occurs in concentrations far too low to produce its own spectral signature from orbit. What satellites detect is everything that travels with gold: hydrothermal alteration mineralogy, iron-oxide caps, silicification, the fault and fracture networks that host veins, thermal contrasts from sulphide oxidation, and vegetation stress over metal-rich soils. When twenty-plus independent layers agree on the same pixels, that convergence is the signal. It still has to be tested by drilling.
How accurate are the tonnage and ounce figures?
They are exploration-target estimates presented as ranges, not resources. On this Zambian licence the contained-gold estimate spans roughly 3,000–4,700 oz on a P10–P90 basis around a ~3,970 oz central figure — that spread is the accuracy statement. Tonnage derives from modelled polygon geometry, an assumed 2.4 t/m³ density, an 18% dilution allowance and a conservative prism factor; grade derives from the fused spectral model. Drilling and assay are what convert any of it into a reportable resource under JORC, NI 43-101, SK-1300 or SAMREC.
Why did all three zones come back “Medium” confidence rather than “High”?
Because at least one corroborating evidence layer dissented on each. All three zones registered a Strong composite signal, but the global magnetic grid returned Marginal across the whole licence, Zone 3 showed alteration without a coincident vein or breccia outcrop signature, and Zone 2’s centroid sits close enough to the boundary that the polygon may be clipped. Medium is a scoping instruction, not a rejection — each flag comes with the specific fieldwork that resolves it, and all three zones enter the Phase-1 validation sequence.
What does satellite gold exploration in Zambia cost compared with ground survey?
Costs depend on area, mineral and report tier, so the right route is a direct quote. The relevant comparison, though, is against what it replaces: a conventional full-area ground campaign of line-cutting, soil geochemistry, trenching and geophysics. An orbital-first screen typically reduces early-exploration cost by up to 80–85%, because the ground work is only ever deployed on the fraction of the block that survived the screen — 15% of the licence in this case.
How long does a scan take?
Five to twenty business days from receipt of the area of interest, depending on the size of the block and the complexity of the target mineral. That is the whole point of the approach: a question that would otherwise take months of fieldwork to answer is answered in days, and the field programme that follows is aimed rather than exploratory.
Which minerals besides gold can be detected this way?
Precious metals (gold, silver); base metals including copper, cobalt, nickel, zinc, iron and manganese; energy and battery minerals such as lithium and uranium; industrial minerals like gypsum, dolomite and quartz; specialty and high-value materials including tantalum, niobium, beryllium, diamonds and star garnets; and rare earth elements. Each has its own spectral and geophysical model — the fusion approach is shared, the discriminators are not.
Do I get the raw data, or just a PDF?
Both. Every deliverable includes georeferenced GIS files alongside the report, so your geologists can load the prospectivity surface, the anomaly polygons and the per-pixel grade and signal rasters directly into their own software. The Premium+ tier adds TargetMax™ drilling intelligence — optimal drilling angles and interactive 3D subsurface models of the vein structures. The imagery in this article is deliberately degraded for confidentiality; client deliverables never are.
Figures in this case study are satellite-derived exploration-target estimates presented as ranges, based on a reference gold price of USD 4,066 per troy ounce. They do not constitute a Mineral Resource or Ore Reserve under JORC, NI 43-101, SK-1300 or SAMREC, and no drilling has yet tested the model described. Drill costs and rig-days are planning-grade parametric figures superseded by any contractor quote. Location, client identity and all coordinates have been redacted at the concession holder’s request; satellite figures have been deliberately degraded and labelled accordingly. Nothing here is investment advice.
Discussion
Questions, corrections or field experience? Share them below. First-time comments are reviewed before they appear, and your email is never published.
No comments yet. Be the first to add a question or your experience.

 Huckleberry Garnet LLC
 Dalgety Minerals Pty Ltd
 Vortex Minerals Pty Ltd
 Faith At Work (Pty) Ltd
 Geotech Mining Solutions plc
 Vulcan International Limited
 Kidepo Associates
 GKY Mining
 Alkimy SARL
 Double A Trading
 GemSprout Metals Limited
 Qader Group
 Ileys General Trading
 SG Gold Mining LLC
 VRV Global Pte Ltd
 Omsri International FZE
 G.I.T.T.
 Jaunita Erss Ltd
 Almosi SARL
 SRK Consulting
 Berks Gold Limited
 Mwerezi Minerals Company Limited
