

Satellite Gold Exploration in Ethiopia: A Case Study
How a multi-sensor satellite gold exploration scan in Ethiopia screened a full licence block from orbit — flagging an estimated 10,000–21,000 troy ounces of contained gold across two drill-ready zones in days, with zero ground disturbance.
Region Ethiopia
Method 20+ satellite layers
Confidence Medium · Phase-1 ready
Early-stage gold exploration has always faced the same brutal arithmetic: to find out whether ground is worth drilling, you first have to spend months and a fortune on ground surveys, trenching and geochemical sampling — much of it on rock that turns out to be barren. In this case study we walk through how satellite gold exploration flipped that sequence on a gold licence block in Ethiopia, letting the concession holder rank targets and design a first-pass drill program before a single field crew mobilised. Every number below is drawn from the Farmonaut Satellite Geosciences deliverable; site-identifying details have been redacted at the client’s request.
This case study is published with the concession holder’s permission. The client name, licence number, town, district and all coordinates have been removed. Any satellite figure shown below has been deliberately redacted — the surrounding basemap replaced with a neutral field, the interior blurred and a label burned in — so it carries no location signal; the data charts are re-drawn from the deliverable’s tables. Farmonaut’s own client deliverables are always full-resolution, fully georeferenced imagery and GIS files; the blurring here is a deliberate confidentiality measure, not a reflection of output quality.
Want this kind of screen on your own ground? You can get a quote for a satellite mineral scan here, or jump straight to mapping your licence at mining.farmonaut.com.

The challenge: proving ground before the drill rig moves
The concession holder controlled a 99.66-hectare (246-acre) licence in a known Ethiopian gold belt, with surface indications of oxidised iron-rich outcrop — the kind of weathered cap, or Gossan, that often sits above a buried sulphide-bearing vein system. The geology looked promising. The problem was scale and sequence: which parts of those 100 hectares actually warranted the six-figure cost of a diamond drill program, and where exactly should the holes go?
Traditional answers to that question are slow and invasive. Cutting grid lines, hand-sampling soils, digging trenches and running an initial geophysical survey across a full licence can take months and consume a large share of an early exploration budget — before anyone knows whether the ground repays it. Worse, it disturbs the surface across the whole area, including ground that later proves barren. For a junior explorer or an investment committee weighing the next capital call, that is a lot of money and time spent buying down uncertainty the hard way.
Every mineral and every alteration zone reflects sunlight and radar with a distinctive spectral signature. That means the first, coarsest question in exploration — where is the ground even worth walking? — can be answered from orbit, before boots and rigs are committed.
That is precisely the question satellite gold exploration is built to answer. Instead of starting on the ground, Farmonaut starts in space: reading reflected electromagnetic energy across many wavelengths, flagging mineralised target zones, alteration halos and structural controls, and handing field teams a ranked, drill-ordered target list. The ground work still happens — but it happens second, focused only on the pixels that survived the screen.
The Farmonaut approach: fusing 20+ satellite layers into one prospectivity surface
The core of the method is data fusion. No single satellite tells you where gold is. But when more than twenty independent orbital and geophysical layers are co-registered and combined, the places where many of them agree become very hard to explain as noise. Farmonaut’s engine fuses those layers, pixel by pixel at roughly a 10-metre ground sample, into a single composite Gold Prospectivity Index (GPI) — a 0-to-1 favourability surface across the whole licence. Discrete anomaly polygons are then cut out of that surface where the score crosses a favourability threshold.
| Sensor / data family | What it contributes to the gold model |
|---|---|
| Multispectral optical (visible / near-infrared) | Vegetation indices, iron-oxide ratios and hydrothermal-alteration colour composites. |
| Short-wave infrared (SWIR) mineral mapping | Clay–sericite, argillic and carbonate–chlorite alteration ratios — the fingerprints of a hydrothermal system. |
| C-band radar (Sentinel-1) | Lineament density, surface roughness and structural fabric — the faults and fractures that host veins. |
| L-band radar (PALSAR-2) | Backscatter and temporal stability — vein-controlled relief and bedrock exposure. |
| Thermal (MODIS + ASTER emissivity) | Day–night land-surface temperature anomalies flagging silicification and sulphide oxidation. |
| Magnetics (global magnetic-anomaly grid) | Basement structure and buried intrusive footprints — the heat engines for epithermal gold. |
| Digital Elevation Model (30 m) | Slope, hillshade, flow accumulation and drainage geomorphology for terrain and placer context. |
| Optical time series | Bare-ground persistence and dry-season vegetation stress over metal-rich soils. |
Each layer is normalised and folded into a weighted composite of multiple sub-scores spanning alteration mineralogy, structural density, surface evidence, thermal signatures and geomorphology. Polygons are extracted where the favourable pixels form spatially coherent clusters — combining how elongated and how smooth each cluster is, consistent with real vein-controlled targets rather than scattered single-pixel noise. Industry-standard resource parameters then convert those polygons into tonnage and contained metal:
Contained gold (kg) = Tonnage (t) × Grade (g/t) ÷ 1000
Parameters: reference density 2.4 t/m³ | cut-off 0.25 g/t Au | dilution 18% | blended recovery 81%
A real hydrothermal system produces spatially coherent anomalies — smooth, contiguous warm zones that survive multi-sensor fusion. A speckled “salt-and-pepper” pattern usually means noise. On this licence, the high-prospectivity ground formed clean, connected clusters, which is itself corroborating evidence that the signal is geological.

The results: a two-zone Ethiopian gold target of ~10,000–21,000 oz
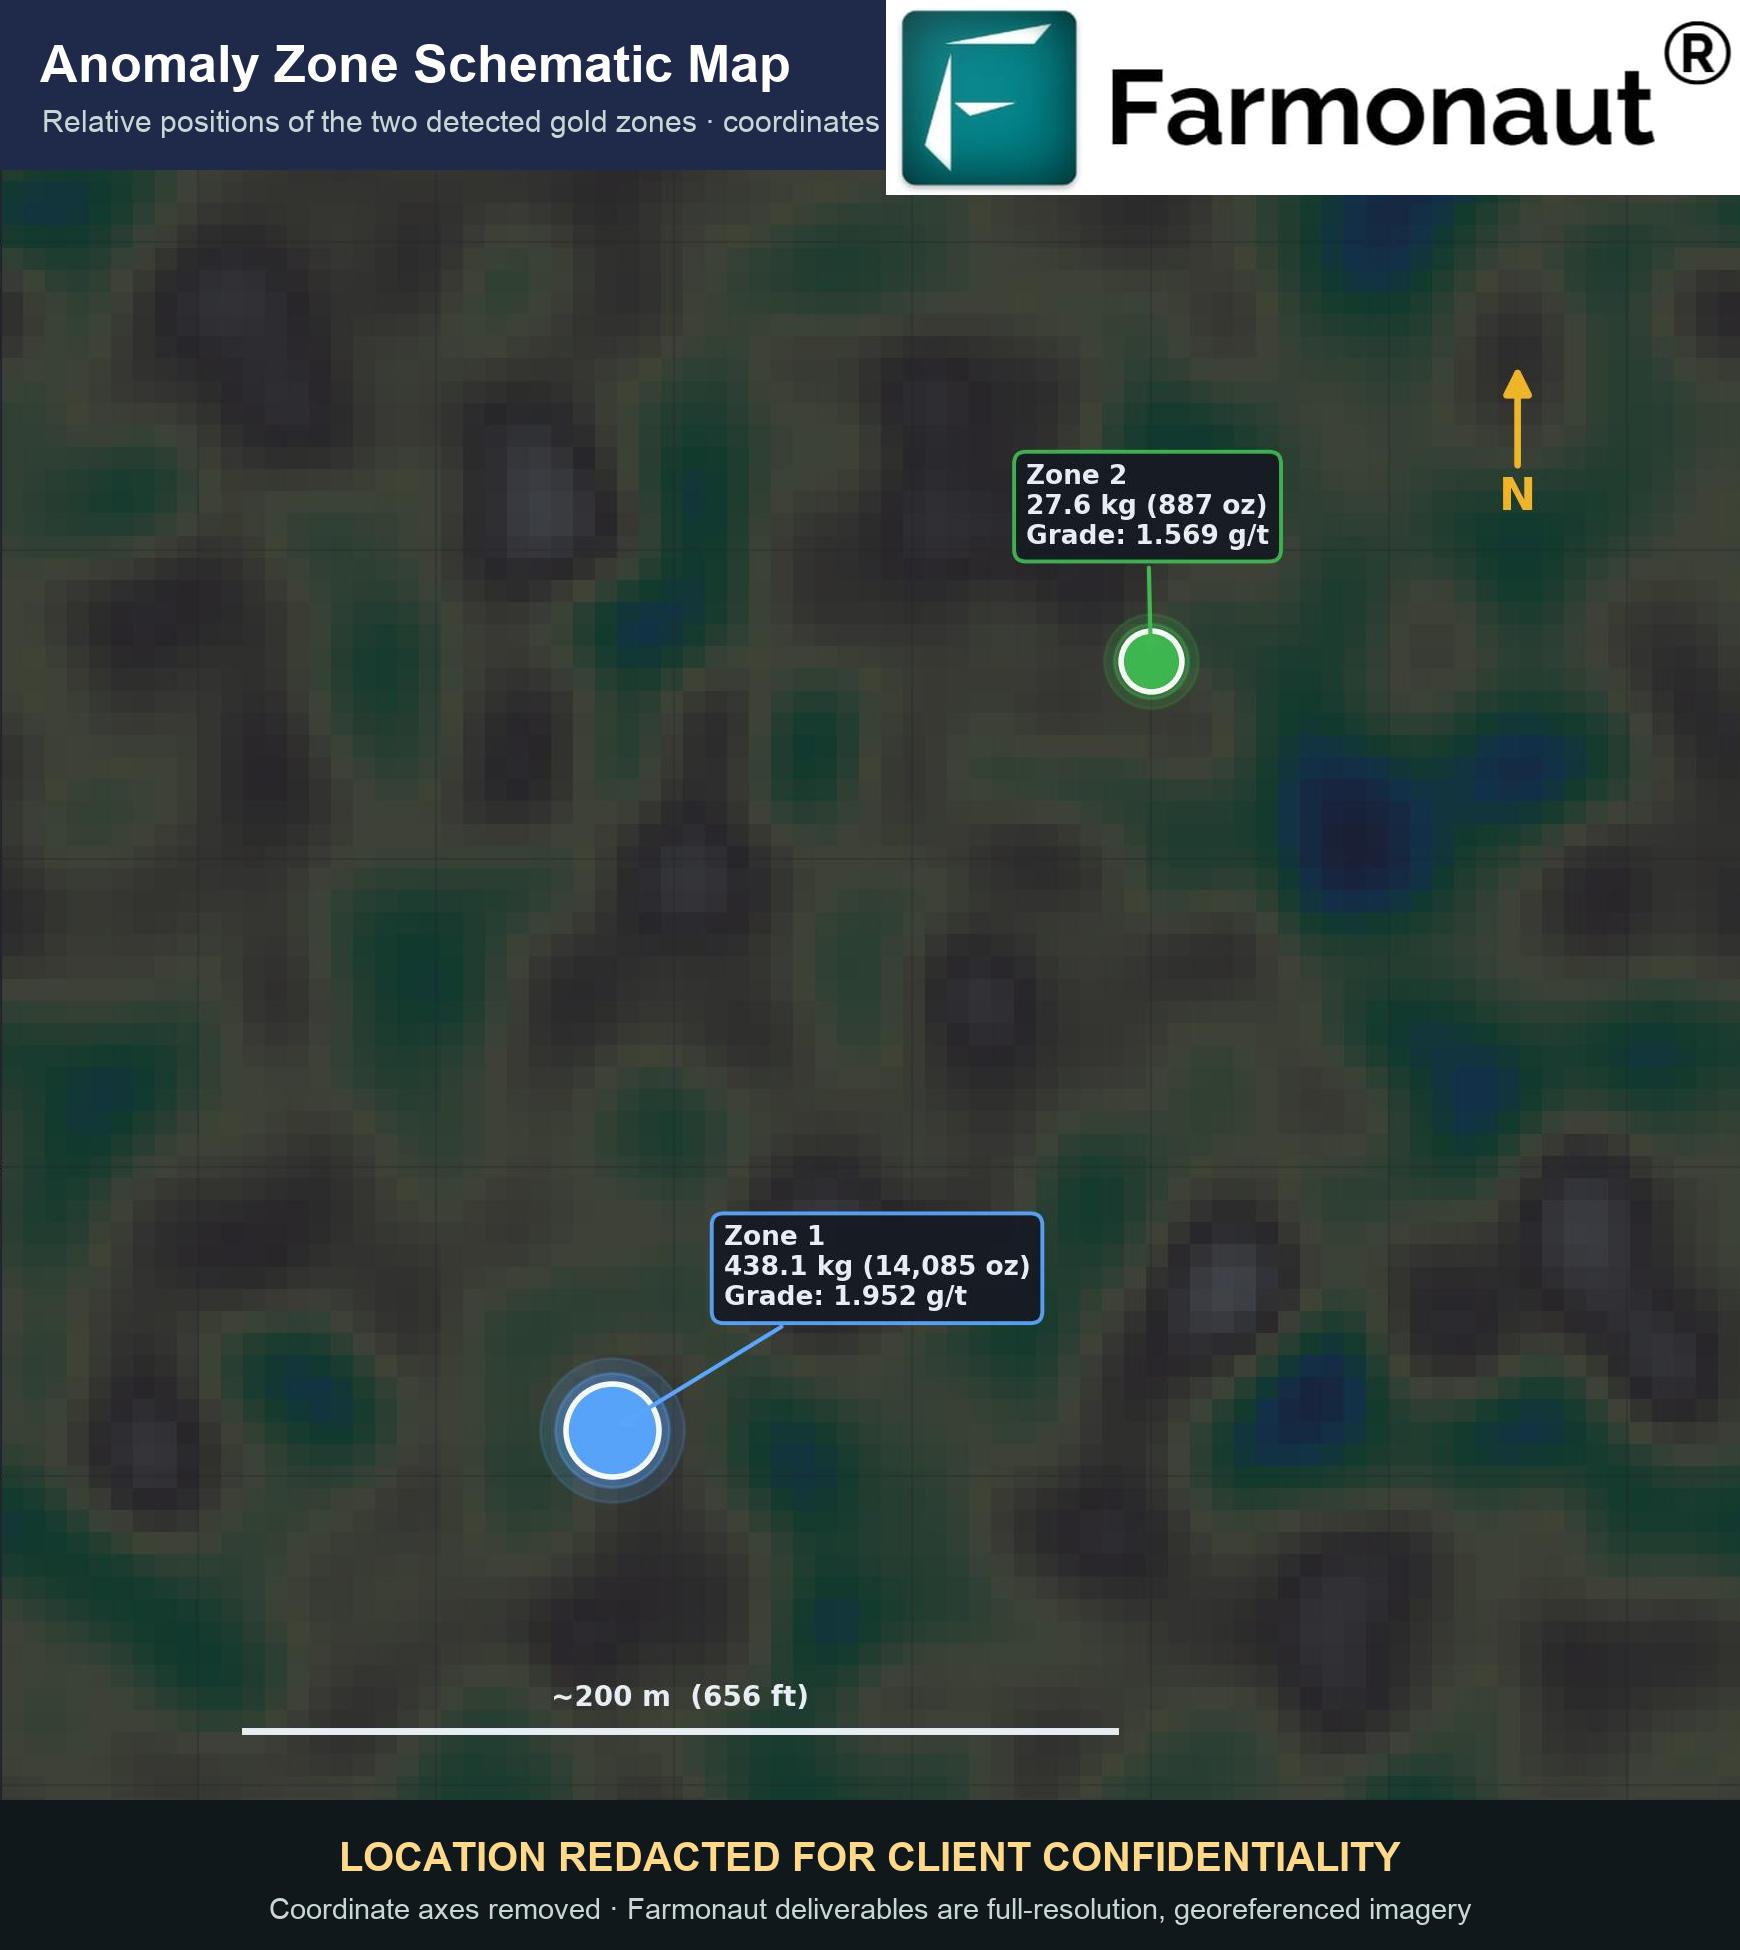
Of the full 99.66-hectare licence, the pipeline narrowed the target set to a ~17-hectare anomaly footprint — roughly 17% of the surveyed ground — resolved into two discrete economic anomaly zones. This is the whole point of an orbital screen: more than four-fifths of the block was set aside as lower priority, so the expensive ground work could concentrate on the fraction that matters.
Aggregated across both zones, the scan estimated an exploration target of roughly 9,800–20,800 troy ounces of in-situ contained gold (≈305–645 kg on a P10–P90 basis; central estimate ~15,000 oz) — hosted in on the order of 240,000 tonnes of mineralised rock at a tonnage-weighted head grade of ~1.9 g/t Au (1.57–1.95 g/t across the two zones). At the July 22, 2026 reference gold price of USD 4,090 per troy ounce, that is a gross in-situ value of roughly USD 40–85 million (central ~USD 61M). Applying an industry-standard blended recovery of 81% (90% mining recovery × 90% metallurgical), the indicative recoverable metal is on the order of ~12,000 oz worth ~USD 50 million at the central estimate — the recovery-scenario spread is detailed below.
Crucially, all of the mineralisation sits shallow — the modelled top of ore is 30 metres below surface and the deepest base is 66 metres — which classifies the whole footprint as open-pit amenable, with a favourable tonnage-weighted strip ratio of 0.86 (well under the 3.0–4.0 that surface gold operations routinely accept).
Where the value sits: a two-zone portfolio
The portfolio is heavily concentrated. Zone 1 alone hosts 94.1% of the contained gold — on the order of 9,100–19,900 ounces at ~1.95 g/t — while Zone 2 adds a smaller ~700–890-ounce satellite target. That concentration is good news for drilling economics: capital can focus on one dominant target first.

Master comparison — the two zones side by side
| Parameter | Zone 1 | Zone 2 | Portfolio |
|---|---|---|---|
| Priority tier | Tier 2 — High Interest | Tier 3 — Follow-up | — |
| Contained gold (oz) | ~9,100–19,900 | ~700–890 | ~9,800–20,800 (P10–P90) |
| Diluted grade (g/t Au) | ~1.95 | ~1.57 | ~1.9 (wt. avg) |
| Ore tonnage (t) | ~224,000 | ~17,600 | ~240,000 |
| Strike × width (m) | ~700 × 450 | ~270 × 90 | — |
| Depth top → base (m) | 30 → 65 | 31 → 66 | 30 → 66 |
| Strip ratio | ~0.86 | ~0.89 | ~0.86 |
| In-situ value (USD) | ~$37–81M | ~$2.9–3.6M | ~$40–85M |
| Structural confidence | 120.5 | 106.7 | 113.6 (avg) |
| Signal strength | Strong | Strong | — |
| Confidence tier | Medium | Medium | Medium |
Both zones scored a structural confidence above 100 — the internal high-confidence threshold — and both classify as Strong on pixel-level signal strength. They are labelled Medium confidence overall because at least one corroborating layer disagreed with the headline signal (see the risk section). That is a scoping item for Phase-1 fieldwork, not a disqualifier — and it is exactly the kind of honest, auditable caveat a capital committee should want to see.

The deposit model: a low-sulfidation epithermal gold system
The zones classify as Gossan-zone mineralisation — an oxidised, iron-rich surface cap over a hydrothermal vein system. Three independent alteration signatures line up to support a low-sulfidation epithermal gold interpretation: (i) iron-oxide enrichment at surface (the Gossan itself), (ii) clay–sericite alteration halos indicating phyllic alteration, and (iii) a felsic-to-intermediate host rock. That “alteration triplet” is a classic diagnostic combination, and every anomaly polygon falls inside the favourable alteration footprint — strong lithological corroboration of the geophysical signal. The magnetic grid pattern is consistent with buried intrusive cupolas, the plausible heat engine driving such a shallow epithermal system.

Depth, drilling and the Phase-1 program
Because the ore sits between 30 and 66 metres below surface, both zones fall comfortably within the practical depth limit for open-pit mining. The deliverable translated that geometry directly into a recommended first-pass drill program — not a full resource drill-out, but a focused confirmatory campaign to convert the satellite signal into physical assay data.
The recommended Phase-1 campaign is deliberately lean: 16 HQ diamond core holes in total — 12 on the dominant Zone 1 and 4 on Zone 2 — drilled perpendicular to strike at a −70° incline, roughly 83–84 m per hole. That is about 192 metres of drilling, a parametric cost of roughly USD 29,000–48,000 at a $150–250/m all-in core-drilling band, and only about 6 rig-days on a single rig. In other words: a few days and tens of thousands of dollars to physically test a target the satellite screen ranked in advance.
| Zone | Azimuth / incline | Hole length | # holes | Method |
|---|---|---|---|---|
| Zone 1 | 290° / −70° | 83 m | 12 | Diamond core (HQ) |
| Zone 2 | 206° / −70° | 84 m | 4 | Diamond core (HQ) |
| Total | — | ~192 m | 16 | ~6 rig-days |
Farmonaut’s Premium+ deliverable adds TargetMax™ Drilling Intelligence: recommended drill azimuths and inclines derived from the modelled vein orientation, plus interactive 3D subsurface models. Drilling perpendicular to strike maximises the length of mineralised core each hole intersects — improving the odds that a confirmatory program actually hits the vein.
Confidence, signal strength and honest risk
A satellite screen is only as useful as its honesty about uncertainty. This is where the deliverable is deliberately conservative. Each anomaly carries eight independent signal families — hydrothermal alteration, thermal, radar/roughness, magnetics, structural lineaments, vegetation biogeochemistry and surface exposure — and the headline confidence label is derived from how many of those agree, cross-checked against six independent false-positive risk filters.
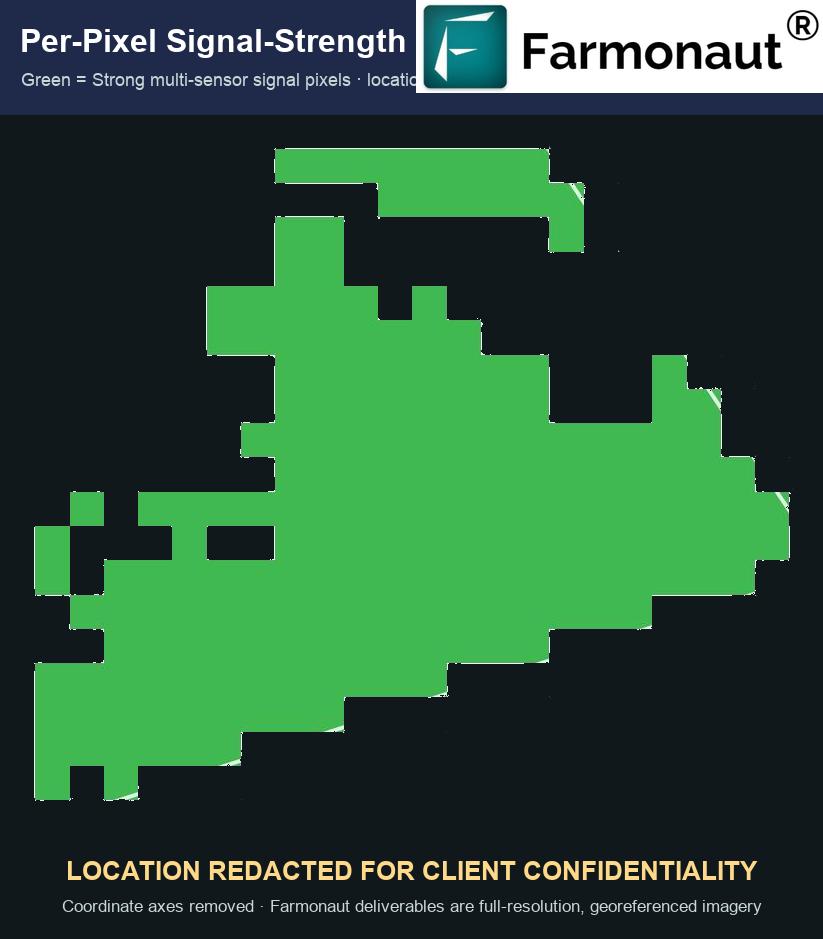
Two families — hydrothermal alteration and thermal — fired Strong on both zones, which is the backbone of the case. The weaker families point straight at what Phase-1 fieldwork should resolve. Three specific risk flags were raised and carried transparently into the report:
- ⚠ Alteration without a mapped vein outcrop — the chemical alteration signal is clear, but no vein/breccia outcrop was resolved from orbit. Mitigation: outcrop traverses and rock-chip sampling.
- ⚠ Centroids near the licence edge — both zones sit within 200 m of the surveyed boundary, a possible clipping artefact. Mitigation: extend the survey area and re-run to capture the full footprint.
- 📊 No coincident magnetic anomaly on Zone 2 — one corroborating layer disagreed. Mitigation: a drone or ground magnetic survey at tight line spacing.
These figures are a satellite-derived exploration target, generated from remote-sensing inference and industry-standard assumptions. They are not a Mineral Resource or Reserve under JORC, NI 43-101, SK-1300 or SAMREC, and no economic figure here should be read as a project valuation. The purpose is to rank and de-risk drill targets — physical drilling and assays are what convert a target into a resource.
How economics move with the gold price
Because the headline value scales with the gold price, the deliverable stress-tested it across a ±30% band around the July 22, 2026 spot of $4,090/oz. Even at $3,000/oz the target stays economically attractive — the shallow, low-strip geometry keeps costs down across the whole range.
The impact: time, cost and a cleaner exploration footprint
Set against the traditional first-pass workflow, the satellite screen changed three things at once — speed, cost and ground disturbance.
- ✔ Timeline compressed from months to days. A full-licence multi-sensor screen delivers ranked targets in a fraction of the time a ground-first campaign takes to reach the same decision point.
- ✔ Early-exploration cost cut by up to 80–85%. By concentrating fieldwork on 17% of the block instead of surveying all of it, the expensive ground spend is aimed only where the data justifies it.
- ✔ Zero ground disturbance in the screening phase. The entire orbital analysis happens without cutting a line, digging a trench or moving a rig — an ESG-aligned way to begin.
- 📊 A defensible, auditable target list. Every polygon traces back through the same pixel-to-priority cascade, giving an investment committee a transparent basis for the next capital call.
Because the screening phase is entirely remote, there is no surface disturbance until a target has already justified itself. That means no trenching or drilling on ground that later proves barren — the exploration footprint is smaller and better-targeted from day one, which matters increasingly to regulators, communities and capital providers alike.

What a full Farmonaut mineral-intelligence deliverable includes
The case study above is one output of Farmonaut’s satellite-based mineral detection service. A typical engagement provides:
- ✔ Premium mineral-intelligence report — high-potential zones, prospectivity heatmaps, estimated location and depth ranges, indicative quantity and a full geological interpretation of faults, alteration and host rock, delivered as a PDF plus georeferenced GIS files.
- ✔ Premium+ with TargetMax™ Drilling Intelligence — optimal drilling-angle recommendations, higher ore-intersection probability, and interactive 3D subsurface models of vein structures and mineral distribution.
- ✔ A simple client workflow — you provide the area of interest (coordinates, KML/KMZ or polygon), the country/region and the target mineral(s); Farmonaut selects the data source, runs the analysis and delivers in 5–20 business days.
- 📊 Detectable across 20+ mineral types — precious metals, base metals, battery and energy minerals, industrial and specialty minerals, and rare earths.
Map your own licence from orbit
Screen your ground before you drill it. Get a ranked, drill-ordered target list built from 20+ satellite and geophysical layers — in days, not months.
Frequently asked questions
What is satellite gold exploration, and can a satellite really “see” gold?
Satellite gold exploration does not image gold particles directly. It detects the geological fingerprints that accompany gold systems — hydrothermal alteration minerals, iron-oxide caps, structural lineaments, thermal and magnetic anomalies — by reading reflected and emitted energy across many wavelengths. Fusing 20+ such layers into one prospectivity surface flags where a gold-bearing system is most likely, so ground teams know where to drill. In this case study it narrowed a 100-hectare licence to a ~17-hectare footprint carrying an estimated 10,000–21,000 ounces.
How accurate are the tonnage and value estimates?
They are exploration-target estimates, not a Mineral Resource. Grade and tonnage are modelled from remote-sensing inference plus industry-standard parameters (reference density 2.4 t/m³, a 0.25 g/t cut-off, 18% dilution and 81% blended recovery). They are designed to rank and de-risk drill targets, and the deliverable is explicit that physical drilling and assays are required to convert a target into a resource under JORC, NI 43-101, SK-1300 or SAMREC.
Why is the confidence labelled “Medium” if both zones scored Strong?
Confidence combines pixel-level signal strength with a severity-weighted count of risk filters that disagreed with the headline signal. Both zones are Strong on signal strength, but each carried corroborating layers that disagreed — for example, clear alteration without a mapped vein outcrop, and centroids close to the licence boundary. That downgrades the label to Medium and defines exactly what Phase-1 fieldwork should confirm. Every zone still enters the validation sequence; the tier governs drill order, not whether it is pursued.
How long does a scan take, and what do I need to provide?
Turnaround is typically 5–20 business days depending on area size and mineral complexity. You provide your area of interest (coordinates, KML/KMZ or a polygon), the country or region, and the target mineral(s). Farmonaut selects the appropriate multispectral or hyperspectral data source, runs the analysis, and delivers a report plus georeferenced GIS files. You can start at the mining query form.
Does satellite exploration replace drilling and ground surveys?
No — it re-sequences them. The satellite screen comes first and ranks targets, so ground surveys, sampling and drilling are focused only on the highest-priority ground. In this case study the recommended follow-up was a lean 16-hole, ~192 m confirmatory drill program — physical validation of a target the orbital screen had already prioritised, rather than a blind campaign across the whole licence.
Which minerals besides gold can Farmonaut detect?
More than 20 mineral types across 25+ countries, including precious metals (gold, silver), base metals (copper, cobalt, nickel, zinc, iron, manganese), battery and energy minerals (lithium, uranium), industrial minerals (gypsum, dolomite, quartz), specialty and high-value materials (tantalum, niobium, beryllium, diamonds) and rare earth elements. See satellite-based mineral detection for the full picture.
Why is the satellite image blurred in this article?
This case study is published under a confidentiality agreement. The client’s identity, licence details and coordinates have been removed, and the satellite figures shown have been deliberately redacted — surrounding basemaps replaced with a neutral field, interiors blurred and coordinate axes cropped away — because a raw basemap or an axis tick could reveal the site. The data charts are re-drawn from the deliverable’s tables and carry no location signal. Farmonaut’s actual client deliverables are always full-resolution, fully georeferenced imagery and GIS files.
Glossary
- Gold Prospectivity Index (GPI)
- A 0-to-1 composite favourability score per pixel, built by fusing many satellite and geophysical layers; higher values mark more prospective ground.
- Gossan
- An iron-oxide-rich weathered surface cap over an oxidising sulphide body — a classic surface indicator of a buried mineralised system.
- Low-sulfidation epithermal
- A shallow, relatively low-temperature hydrothermal gold system, often associated with felsic-to-intermediate host rocks and a buried heat source.
- Head grade
- The average concentration of gold in the mineralised rock, here expressed in grams per tonne (g/t).
- Strip ratio
- The tonnes of waste that must be removed per tonne of ore; below 1.0 is very favourable for open-pit mining.
- Blended recovery
- The combined proportion of in-situ gold expected to be recovered, here 81% (90% mining × 90% metallurgical).
- Exploration target
- A statement of potential tonnage and grade that is conceptual — not yet a Mineral Resource — and requires drilling to advance.
This article is a redacted case study prepared for general information. All quantitative figures are satellite-derived exploration-target estimates based on remote-sensing inference and industry-standard assumptions; they do not constitute a Mineral Resource or Ore Reserve under JORC, NI 43-101, SK-1300 or SAMREC, and nothing here is investment advice or a project valuation. The reference gold price of USD 4,090/oz reflects the spot price cited in the source deliverable dated July 22, 2026. Client, location and coordinate details have been removed at the client’s request.
Discussion
Questions, corrections or field experience? Share them below. First-time comments are reviewed before they appear, and your email is never published.
No comments yet. Be the first to add a question or your experience.

 Mining SARL
 SenGold Invest SAS
 Sania Corporation
 Sean Mining Limited
 NTS Group (Pty) Ltd
 Mine4Africa
 Lithspo Minerals Limited
 Tintina Mining Group
 Dalgety Minerals Pty Ltd
 Vortex Minerals Pty Ltd
 Faith At Work (Pty) Ltd
 Geotech Mining Solutions plc
 Vulcan International Limited
 Kidepo Associates
 GKY Mining
 Alkimy SARL
 Double A Trading
 GemSprout Metals Limited
 Qader Group
 Ileys General Trading
 SG Gold Mining LLC
 VRV Global Pte Ltd
 Omsri International FZE
 G.I.T.T.
