

Small-Scale Gold Exploration in Zimbabwe by Satellite
Conventional wisdom says satellite screening is for big concessions. This Zimbabwean licence is the counter-case: on ground small enough to walk across in a morning, the operator reported saving six months or more and up to USD 25,000 — and not one hole has been drilled yet. The entire saving landed at the decision stage.
There is a stubborn assumption in small-scale gold exploration that remote sensing is a big-company tool — something you commission when you hold a thousand square kilometres and need to know which corner to look at first. This project, on a Zimbabwean gold licence smaller than a hundred hectares, is the clearest argument we have against that assumption. The operator reported saving six months or more of exploration time and up to USD 25,000 in cost. They have not drilled. Not one hole. The entire reported saving was banked at the planning table.
That asymmetry is the story, and it deserves to be stated plainly rather than dressed up. A small licence holder is not a scaled-down large one. They are a different animal facing a different arithmetic, and on that arithmetic a wasted first hole is not an inconvenience — it is frequently the whole programme. This article is about why a sub-100-hectare licence in a Zimbabwean greenstone belt is exactly the kind of ground where an orbital screen earns its fee, and why the money it saves is spent long before a rig is mobilised.
Everything reported here about the client’s project comes from their own answers to a fixed post-project feedback form. The client is not named, quoted or identified. What we can add freely — and what carries most of this article — is the public context: Zimbabwe’s craton geology, the legal shape of a small mining claim there, the economics of the small-scale sector, and what the alternative ground programme would have cost.
This client is not identified and did not provide a testimonial; no statement in this article is quoted from or attributed to them. The licence name and number, boundary, coordinates, district, exact area, exact report date and zone-level results are withheld. The country is published with permission of scope; everything narrower is not. All outcome figures are banded selections the client made on our structured post-project feedback form — they are not measurements we took and are not point estimates. Every image and every prospectivity figure discussed below is illustrative or drawn from separate, already-redacted projects, and does not depict or derive from this client’s licence.

Zimbabwe Is a Small-Licence Country, by Law and by Output
To understand why this project matters you first have to understand that in Zimbabwe, a small gold licence is not the exception. It is the norm, it is what the statute is built around, and it is where most of the country’s gold actually comes from.
The legal shape of a Zimbabwean gold claim
Zimbabwean mining title is granular by design. A claim is a pegged area not exceeding one hectare. A block is a claim or group of claims registrable under a single certificate of title. And under the framework carried forward into the Mines and Minerals Bill of 2025, a small-scale miner is defined as the holder of registered mining locations that in aggregate do not exceed forty hectares, employing fewer than fifty people and producing under 1,200 tonnes of ore a year.
Read that threshold next to this project’s ground and the picture sharpens immediately. A sub-100-hectare licence sits above the statutory small-scale ceiling — it is, in Zimbabwean regulatory terms, not a small-scale holding at all. And yet by the standards of the global exploration industry, where a single greenfields concession routinely runs to tens of thousands of hectares, it is minute. This operator occupies the awkward middle: too large to be waved through as a one-man claim, far too small to be treated as a regional exploration play.
That middle is where most of the interesting ground in Zimbabwe sits, and it is systematically under-served. The regional exploration industry is not built for it. Consultants price for large areas. Airborne geophysics carries a mobilisation cost that a double-digit-hectare property can never amortise. The default advice to a holder of ground this size has historically been to simply start digging and see what turns up.
The relevant question is never “is this licence big enough to justify a satellite screen?” It is “what fraction of this operator’s total exploration budget is about to be committed on the basis of a guess?” On a small licence that fraction is usually close to 100 percent — which is precisely why the screen matters more there, not less.
What the national delivery figures say about who is actually mining
Zimbabwe’s gold sector runs through a single legal channel: Fidelity Gold Refinery, the country’s sole authorised gold buyer and exporter. That makes the national picture unusually legible, because every legal ounce passes one counter.
In 2025 the country delivered a record 46,729 kg — roughly 46.7 tonnes — of gold, up 28.1 percent on 2024. The striking part is the split. Artisanal and small-scale mining accounted for 34,875 kg, or about 74.6 percent of the national total, growing 46.9 percent year on year. Large-scale mining delivered 11,854 kg and actually declined seven percent. Put differently: the small-scale sector alone in 2025 nearly matched the entire national output of 2024.
Three quarters of the gold in one of Africa’s most prospective Archaean terranes is coming off small holdings. Those holdings are worked, in the main, by operators without an in-house geology department, without a geophysics budget, and without the option of drilling their way to an answer. If exploration technique is going to improve outcomes anywhere in Zimbabwe, this is statistically where it has to happen.
“Three quarters of Zimbabwe’s gold comes off small holdings — and almost none of those holdings have ever been screened.”
The Geology Underneath: Why the Zimbabwe Craton Rewards Careful Targeting
The ground this operator holds sits on one of the oldest and most gold-endowed pieces of continental crust on the planet.
The Zimbabwe Craton contains rocks dating to the early Archaean, possibly as early as 3.46 billion years ago, and stabilised around 3.3 billion years ago in its southern Tokwe Segment. It is bounded to the southeast by the 250-kilometre-wide Limpopo Belt separating it from the Kaapvaal Craton, and to the north by the Zambezi Belt. Roughly sixty percent of Zimbabwe’s land surface is this Archaean basement — granitic and gneissic rocks enclosing preserved remnants of volcano-sedimentary sequences known as greenstone belts.
Those greenstone belts are the gold. Zimbabwe’s historic goldfields — Kadoma–Chakari, the Midlands, Bulawayo, Bindura–Shamva, Mutare — are all belt-hosted. And the craton is bisected by the Great Dyke, a 550-kilometre layered ultramafic intrusion dated at 2.575 billion years, which cuts the craton undeformed and therefore proves the craton had already stabilised by the time it intruded.
The structural fact that makes satellite targeting work here
Archaean orogenic gold in Zimbabwe is overwhelmingly structurally controlled. It sits in quartz veins filling fractures, and as impregnations along shear zones. Published structural work on the craton reports that fractures and shear zones running parallel to the regional fold axis host more than ninety percent of known gold occurrences, and that two thirds of deposits show significant lithological control — ore bodies preferentially exploiting the competency contrast between rigid xenoliths and enclosing granite.
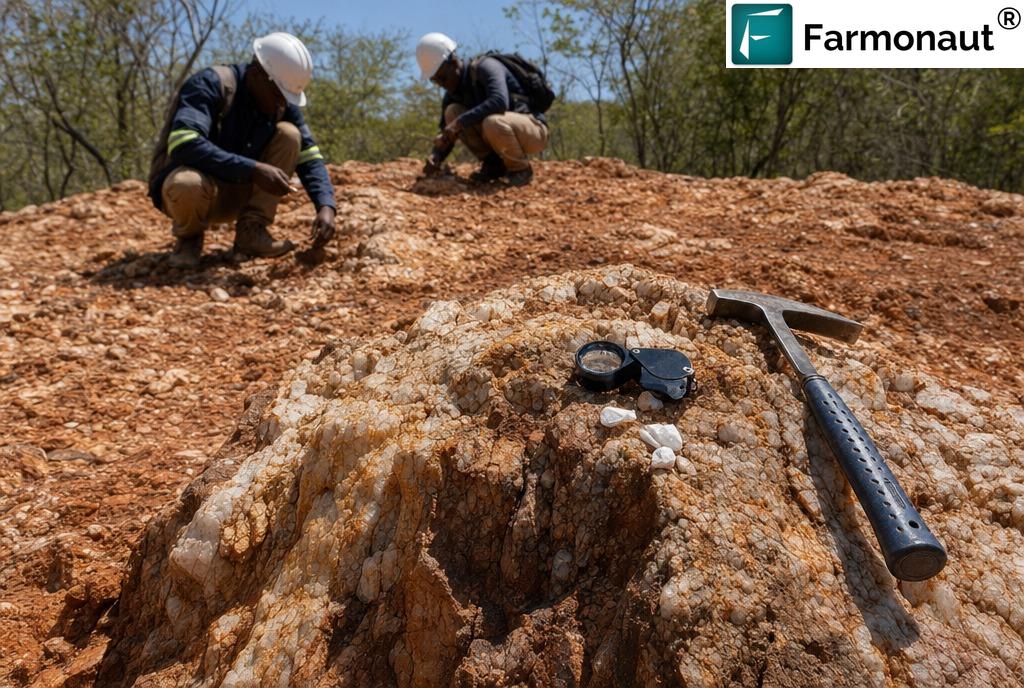
This matters enormously for what an orbital screen can and cannot contribute. Gold itself is invisible from space; there is no spectral band in which a gram per tonne announces itself. But the things that localise gold in a craton like this one are frequently expressed at surface:
- ✔ Structure. Shear corridors, fracture sets, fold-axis-parallel lineaments and their intersections express themselves in topography, drainage deflection, vegetation lineation and subtle tonal breaks — all mappable from multi-date imagery and elevation models.
- ✔ Iron-oxide staining. Weathering sulphides leave goethite and hematite haloes with strong, diagnostic absorption features in the visible and near-infrared.
- ✔ Hydrothermal clay and mica alteration. Sericite, illite and kaolinite carry characteristic short-wave infrared absorptions that map the footprint of the fluid system.
- ✔ Silicification and quartz-vein density. Resistant vein swarms and silicified caps commonly stand proud of the weathered profile and show up in both spectral response and micro-topography.
- ✔ Lithological contrast. The greenstone–granite contacts and banded ironstone horizons that concentrate deformation are among the most reliably separable units in a multispectral scene.
The alteration footprint of a mineralising system is typically far larger than the ore body inside it. That is the whole basis of the method: you are not looking for the target, you are looking for the very much larger halo the target sits in, and then narrowing.
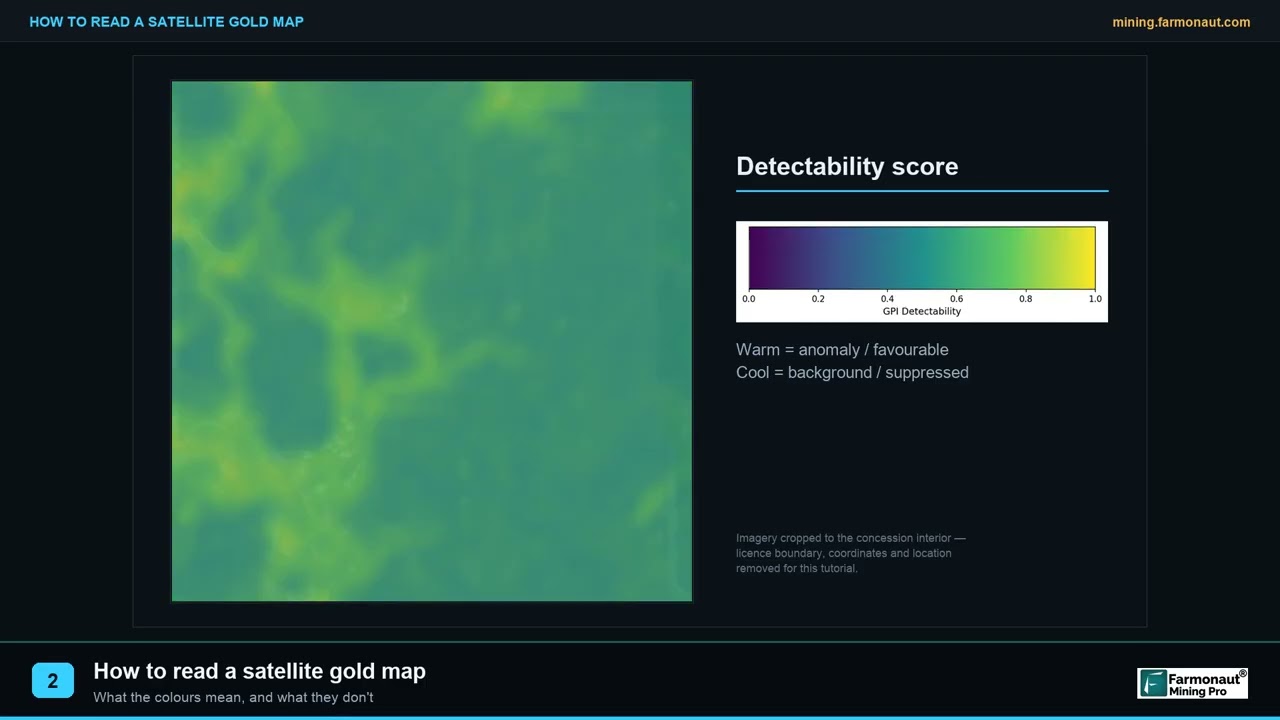
No satellite detects gold itself. What is mapped is alteration mineralogy, iron-oxide and clay signatures, and structural architecture — the geological company gold keeps, and a footprint many times larger than the ore body inside it. That is what makes the method powerful on small ground: the halo is big enough to see from orbit even when the target is not. Depth is modelled rather than measured and grade is expressed as a range, which is exactly why the deliverable is a ranking of where to look first — the job it does extremely well.
A Square Kilometre Is Still Far Too Big to Trench Blind
Here is the intuition that traps small licence holders, and it is worth taking seriously because it is not stupid — it is just wrong at the margin.
The intuition runs: my ground is small. I can walk the whole thing in a morning. I can see the outcrops. Why would I pay someone to look at it from space when I can look at it with my own eyes?
The arithmetic does not agree. A sub-100-hectare block is on the order of a square kilometre. At a conventional first-pass soil geochemistry grid of 50 metres by 50 metres, that is roughly four hundred sample stations. At a coarser 100 by 100 metre grid it is still about a hundred. Each of those samples has to be collected, labelled, freighted and assayed, and the multi-element analytical work alone commonly runs in the tens of dollars per sample before you count the field crew, the vehicle, the accommodation and the time.
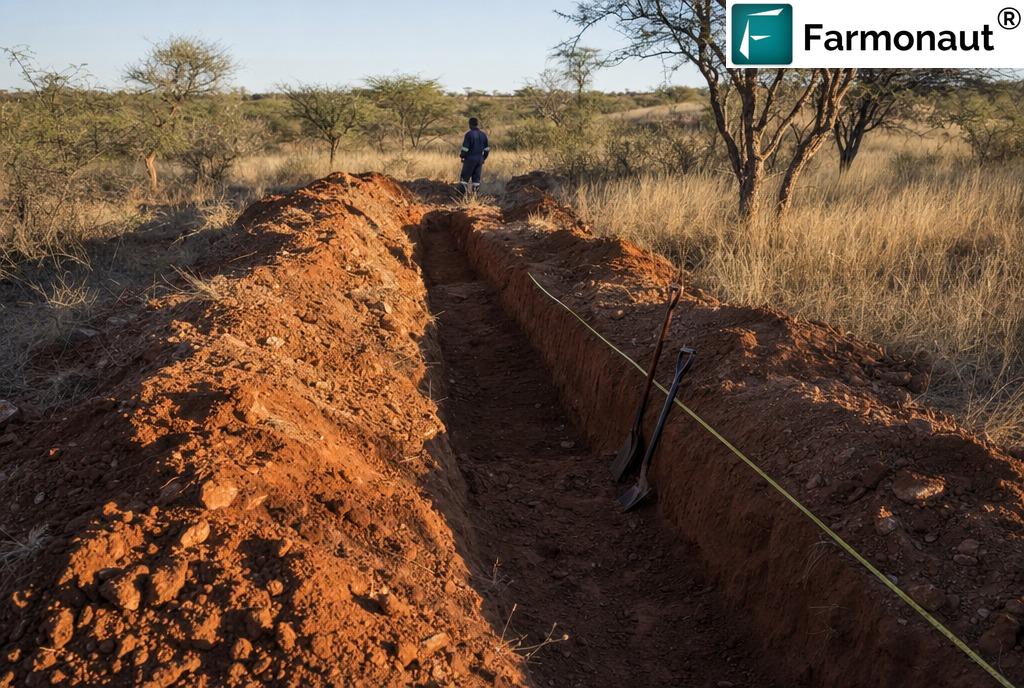
Trenching is worse per unit of information. A trench tells you a great deal about a two-metre-wide strip of ground and nothing at all about the ground ten metres to either side. To cover a square kilometre with trenches at any useful spacing is not a programme; it is a career.
And drilling — the thing everyone actually wants to get to — is where the numbers become unforgiving. Published comparisons put reverse-circulation drilling at roughly 25 to 40 percent cheaper than diamond core drilling, with a worked example putting RC around $120 per metre against $200 per metre for core in that project’s market. Those are indicative figures from one source and one market, not a quote, and African rates vary widely with access, water availability, ground conditions and mobilisation distance. But the shape holds everywhere: a single hundred-metre hole is a five-figure decision, and mobilisation is charged whether the hole hits anything or not.
Percentage of budget, not absolute hectares
This is the reframe that the whole case study rests on.
A major with a ten-thousand-hectare concession and a multi-million-dollar annual exploration budget can absorb a barren first hole. It is a line item. The geologists shrug, log it, adjust the model and move the rig. The programme continues.
A holder of a sub-100-hectare Zimbabwean gold licence very often cannot. For that operator, one campaign may represent the majority of available capital — possibly capital raised from family, from a local partner, or from the proceeds of previous production. A wasted first hole does not adjust the model. It ends the season, and sometimes it ends the project.
So the correct measure of exploration risk is not the absolute size of the property. It is the share of the operator’s total risk capital riding on the first decision. By that measure the small licence holder is carrying the highest concentration of risk in the entire industry, and is simultaneously the least likely to have been offered a technique that reduces it.
“The major can afford a barren first hole. The small licence holder often cannot afford a second one.”
When you assess a small licence, the sharpest diagnostic is not the geology pitch — it is how the first drill location was chosen. “Where the old workings are,” “where my uncle found colour,” and “where the access road already goes” are all real answers, and all three are selection biases rather than evidence. An operator who can hand you a licence-wide, uniformly derived, independently produced ranking surface has done something structurally different with their capital, and it is visible in the documentation before a single metre is drilled.
How the Screen Was Run on This Licence
Farmonaut has been applying Earth observation and AI to mineral exploration since 2018, and has screened 100,000+ hectares across 25+ countries for more than 20 mineral types. The workflow applied to this Zimbabwean licence in late 2025 followed our standard four stages, and is deliberately the same whether the ground is a few dozen hectares or several thousand.
- Multi-date acquisition. We assemble an image archive spanning several seasons over the licence rather than trusting one scene. Zimbabwe’s pronounced wet and dry seasons make this essential: a spectral anomaly that appears in one dry-season scene and vanishes in the next is a vegetation or moisture artefact, not mineralogy. Persistence across dates is the first filter.
- Atmospheric correction and spectral decomposition. Raw radiance is corrected to surface reflectance, then decomposed to separate genuine mineralogical response from soil background, shadow, and the strong vegetation contribution that African savanna and cultivated ground both introduce.
- Indicator mapping. We map iron-oxide and gossan response, clay and sericite alteration in the short-wave infrared, silicification, lithological contacts, and the structural architecture — lineaments, shear corridors, fold-axis-parallel fracture sets and their intersections — using elevation, drainage and radar-derived surface texture alongside the optical stack.
- Ranking and delivery. Those layers are combined into a prospectivity surface using a weighted composite of multiple normalised sub-scores, discrete zones are delineated and ranked, and the package is delivered as a PDF report plus georeferenced GIS files the operator can load into their own systems. Typical turnaround is 5–20 business days.
On a licence this size, that process yields something a large concession screen cannot: fine-grained internal discrimination. The full indicator stack concentrated over a square kilometre does not produce three broad regional zones; it produces meaningful separation between one corner of the property and another, at a resolution that is directly actionable for placing a trench or a hole.
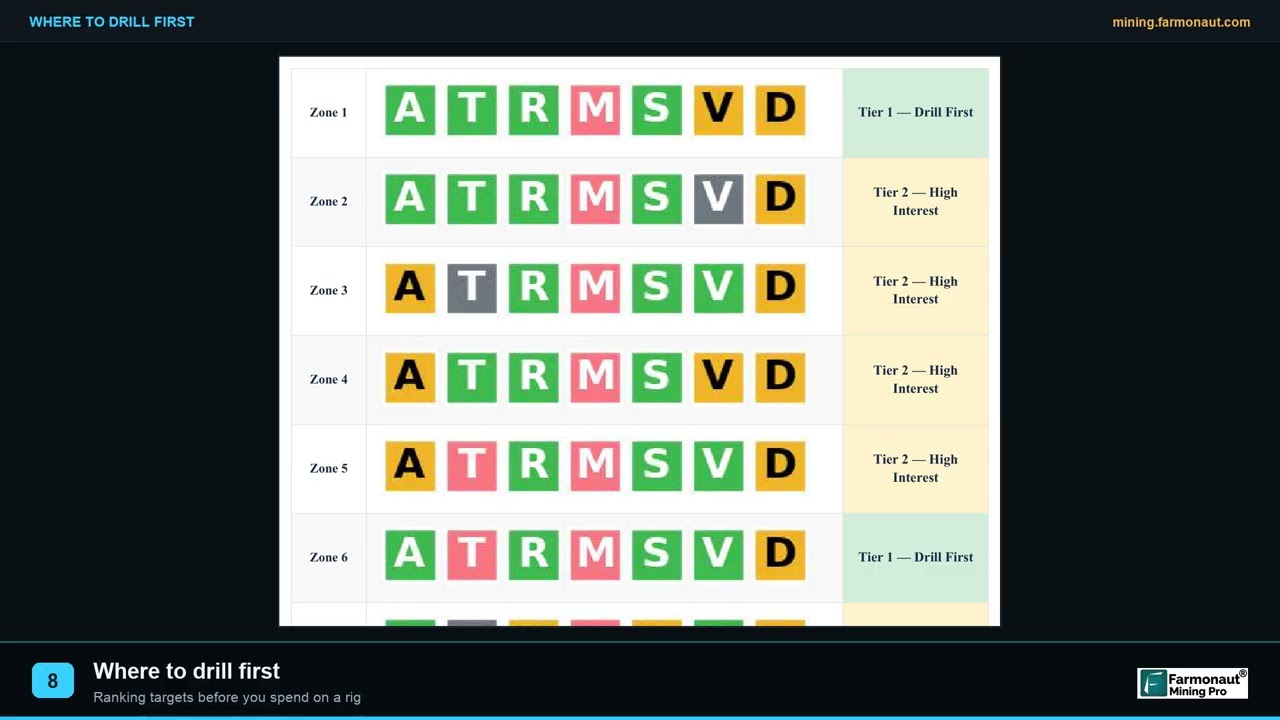
When you read a prospectivity report on small ground, do not simply pick the single highest composite score. Look for coincidence between independent indicator layers — a moderate-scoring zone where iron-oxide response, clay alteration and a mapped structural intersection all overlap is very often a better first target than a high-scoring zone carried by one index alone. Coincidence of independent evidence beats magnitude of a single score, every time.
What the Client Reported Back
Some months after the report was delivered in late 2025, the operator completed our structured post-project feedback form. These are fixed questions with banded answer options. What follows is a faithful rendering of the selections they made — not a quotation, not a paraphrase of anything they said in their own words, and not a measurement we performed.
Recorded answers — Zimbabwe gold licence, sub-100 hectares
Read that scorecard in the right order and the value is obvious. Every one of those outcomes — the narrowed targeting, the six-months-or-more time band, the up-to-USD-25,000 cost band — was banked before a rig was mobilised. The drill programme sits below them as the next stage, not as a gap. That is the unusual and genuinely useful thing about this record: it isolates what targeting alone is worth, uncontaminated by any downstream field result.
What “Six Months or More” Means When It Is Saved at the Planning Stage
Time savings in exploration are usually reported as field-stage savings: the rig moved sooner, the programme finished earlier, the assays came back in one batch rather than three. That is not what happened here, because there has been no field stage.
The client selected the “6 months or more” band on a question about exploration time saved, and they selected it having drilled nothing. So the saving has to be a planning-stage saving, and it is worth reasoning through what a planning-stage saving on small ground actually consists of. The reasoning below is ours, offered as generic industry context — the client did not describe their programme to us, and none of it should be read as a description of their plans.
The season is a hard boundary
Zimbabwe’s field year is not continuous. The rainy season roughly spanning November to March degrades access, floods pits and trenches, complicates sampling and pushes drill rigs off soft ground. In practice an operator has a working window, and if a decision slips past the end of it, the cost is not a few weeks — it is the remainder of the year until the window reopens. On that calendar, “six months or more” is not an abstract efficiency. It is frequently the difference between drilling this season and drilling next season.
The reconnaissance loop you do not have to run
The conventional path from “I hold a licence” to “I know where to drill” on ground of this size is a sequence, and each step gates the next. Walk and map the outcrops. Design a soil grid. Collect it. Freight it. Wait for the laboratory. Interpret the results. Design a trenching programme against those results. Cut the trenches. Sample and log them. Wait for the laboratory again. Only then site the hole.
Every laboratory turnaround in that chain is weeks. Every design step needs a competent person who may not be on site. Every field mobilisation needs a crew, a vehicle and dry ground. Six months to traverse that sequence on a small property with a small team is not slow — it is normal. A prospectivity surface does not replace that work, but it lets an operator enter the sequence already narrowed, running a focused soil grid over ranked ground instead of a blanket grid over the whole licence.
The decision that stops being deferred
There is a third component that is less often discussed and, on small licences, often the largest. Exploration decisions get deferred when there is no defensible basis for making them. An operator who cannot justify why the hole goes here rather than there frequently does not drill at all; they wait, they consult, they revisit, and months pass with no field activity whatsoever. A ranked target list does not make the geology better. It makes the decision defensible, and defensible decisions get made.
The screening phase involves no ground disturbance at all. No access tracks cut, no pits, no trenches, no drill pads, no fluids, no water abstraction, no vegetation clearance. On a sub-100-hectare licence in a populated Zimbabwean farming district, this matters more than it does on remote ground: whole portions of a property can be ruled out as low priority without a spade ever touching them, and the eventual physical footprint is concentrated where the evidence actually points. Less speculative digging is both cheaper and better practice.
Up to USD 25,000 — Where That Money Would Otherwise Have Gone
The client selected the “up to USD 25,000” band for cost saved. Again, that is a band on a form, not an audited figure, and we will not convert it into a point estimate or extrapolate from it. What we can do is set out what an equivalent sum buys in conventional first-pass ground exploration, so the reader can judge the shape of the trade for themselves.
| First-pass approach on a ~1 km² licence | What it involves | Where the cost and time go |
|---|---|---|
| Blanket soil geochemistry | Grid across the whole licence; hundreds of stations at 50 m spacing, ~100 at 100 m spacing | Per-sample multi-element assay, freight, field crew, vehicle; weeks of laboratory turnaround before any interpretation |
| Reconnaissance trenching | Hand or excavator trenches cut across suspected structures | Labour or plant hire, rehabilitation obligations, and a very narrow information yield per metre cut |
| Ground geophysics | Magnetics, IP or resistivity lines walked across the property | Instrument hire, operator day rates, and a mobilisation charge that a small licence cannot amortise |
| Speculative first drill hole | One RC or diamond hole sited on best available judgement | Rig mobilisation charged regardless of result, plus per-metre cost; a five-figure commitment on a single guess |
| Satellite prospectivity screen | Whole licence assessed on one consistent basis, targets ranked | Fixed, known cost; 5–20 business days; no mobilisation, no ground disturbance, no laboratory queue |
The point of that table is not that satellite screening replaces any of the rows above it — it does not, and the honest sequence still ends in a drill hole. The point is ordering. Every conventional line item becomes cheaper when it is aimed. A soil grid over the top-ranked forty percent of a licence costs less than a soil grid over all of it and answers the same question. A trench cut across a mapped structural intersection carries more information than a trench cut where the access happened to be easy. And a first hole sited on coincident evidence is a fundamentally different bet from a first hole sited on hope.
Across our project base, satellite screening has typically lowered early-exploration cost by around 80–85 percent versus conventional first-pass ground programmes. That is a portfolio-level figure describing the method in general; it is not this client’s number, and their reported band should not be read as confirming it.
Where our published material illustrates prospectivity scores, zone rankings, tonnage envelopes or grade ranges, those come from separate, already-redacted projects and are shown to explain the deliverable format. No prospectivity value, zone count, grade or tonnage figure from this Zimbabwean client’s report is reproduced anywhere in this article, and none should be inferred from anything shown here.
The Asymmetry: Small Ground, Large Reported Saving
Set the two facts side by side and the shape of this case study becomes clear.
Fact one: the licence is small — under a hundred hectares, roughly a square kilometre, walkable. Fact two: the reported savings bands are at the substantial end of what we see across our client base, including from operators holding ground ten and twenty times larger.
Those two facts are not in tension. They are causally connected, and the connection runs through three mechanisms.
Mechanism one: concentration of the indicator stack
The analytical effort is not proportional to area. Running the full indicator stack over a square kilometre yields a much finer internal ranking than running the same stack over a hundred square kilometres, because the discriminating power is concentrated. On large ground the deliverable answers “which district?”. On small ground it answers “which slope, which structure, which contact?” — and the second question is the one that sites a hole.
Mechanism two: the counterfactual is worse on small ground
A saving is always measured against what would otherwise have happened. A large operator’s counterfactual is a systematic, well-resourced regional programme that would have got to a reasonable answer eventually. A small operator’s counterfactual is frequently a guess, or a long deferral, or a speculative hole. The worse the counterfactual, the larger the saving — and small-licence counterfactuals are usually the worst in the industry.
Mechanism three: the fixed-cost floor of conventional work
Conventional exploration carries hard fixed costs. Rig mobilisation, geophysics crew mobilisation, minimum laboratory batch charges, consultant travel — none of these scale down with your licence. A large operator spreads them across a big programme. A small operator pays them in full for a fraction of the work. Satellite screening has almost no mobilisation component, which is precisely why its relative advantage is greatest on the smallest ground.
“Mobilisation does not scale down with your licence. Satellite screening barely has any.”
| Dimension | Large concession (thousands of hectares) | Small licence (this project’s scale) |
|---|---|---|
| What the screen answers | Which district or block deserves a field programme | Which slope, structure or contact should take the first hole |
| Share of budget on the first decision | A line item within a larger programme | Frequently the majority of available risk capital |
| Realistic counterfactual | A systematic regional programme, eventually | A guess, a deferral, or a speculative hole |
| Fixed mobilisation costs | Spread across many holes and many months | Paid in full for a fraction of the work |
| Consequence of a barren first hole | Model adjusted, rig moved, programme continues | Season lost, and sometimes the project with it |
| Value of documentation to third parties | Supplements an existing technical department | Often the only independent technical record the licence has |
The documentation dividend
There is a fourth benefit that has nothing to do with geology and everything to do with how exploration ground changes hands in Zimbabwe.
Small licences are typically held by operators without an in-house technical department. That is not a criticism — it is the ordinary structure of early-stage exploration across most of the world, and in Zimbabwe it is the structure that produces three quarters of the national gold. But it means the technical documentation supporting a licence is often thin, and thin documentation is a genuine obstacle when the holder wants to raise capital, bring in a joint-venture partner, satisfy a work commitment, or sell.
A satellite prospectivity study fills that gap in a way that is disproportionately valuable on a small property. It produces a structured, independent, third-party assessment covering the entire licence on one consistent basis, delivered with georeferenced GIS files that any competent geologist on the other side of a negotiation can load and interrogate for themselves. For an operator whose alternative was a verbal account, a licence map and some hand specimens, that is a substantial change in position — and it exists before any drilling has been done.
What a ranked target set does for the first drill programme
The most valuable thing a small operator gets out of a prospectivity screen is not a map. It is a sequenced programme where previously there was a single anxious decision.
A ranked target set converts “where do we drill?” into “we drill here first, here second, here third, and here is why each one is where it is.” That changes several things at once for a holder of small ground. The first hole is sited on coincident, independently derived evidence rather than on access convenience or inherited folklore. If it does not deliver, the programme has somewhere defensible to go next instead of stalling, because the second and third targets were ranked on the same consistent basis rather than improvised afterwards. Rig mobilisation — the single least divisible cost in the whole exercise — can be planned against several pre-sited collars in one visit rather than paid twice. And the intervening ground work gets aimed too: a focused soil grid or a trench cut across a mapped structural intersection carries far more information per dollar than a blanket grid over an entire licence.
On large ground that sequencing is a convenience. On a licence of this size, where the operator may realistically get one campaign, it is the difference between a programme and a gamble.
The licence-commitment dividend
There is a second, quieter benefit that matters a great deal in Zimbabwe specifically. Mining title carries obligations. Holders are expected to demonstrate genuine work on their ground, and the framework carried into the 2025 Bill tightens that expectation further, requiring work plans and supporting documentation and putting non-performing ground at risk.
For an operator without an in-house technical department, meeting that standard has traditionally meant spending scarce capital on physical activity simply to have something to show. A licence-wide prospectivity study changes the arithmetic: it produces a structured, independent, third-party technical assessment of the entire holding on one consistent basis, delivered as a report plus georeferenced GIS files, within 5–20 business days and without a spade touching the ground. That is a substantive work product, a planning document, and an asset description all at once — and it exists at a fraction of the cost of generating the equivalent by digging.
“A ranked target set turns one anxious decision into a sequenced programme — and that is worth most where there is only one campaign to spend.”
How to Run This on Your Own Small Licence
Use the report for what it is built to do — deciding where your regulated work happens. Satellite-derived estimates are exploration targets; they are not Mineral Resources or Ore Reserves under JORC, NI 43-101, SAMREC or any equivalent code, and they sit alongside drilling, sampling and a Competent or Qualified Person’s assessment rather than replacing them. Operators who get the most value hand the GIS files straight to whoever plans their ground programme, and let the ranking set the running order.
- Send the ground. Coordinates, a KML or KMZ file, or a polygon drawn directly at mining.farmonaut.com. Include the country and every commodity you are targeting, not just the primary one — secondary metals change which indicator layers matter.
- We select the sensor stack. Multispectral or hyperspectral, matched to your area, terrain and mineral complexity, with multi-date coverage so seasonal artefacts can be filtered out rather than mistaken for mineralogy.
- Analysis and delivery. Typically 5–20 business days, delivered as a PDF report plus georeferenced GIS files you can load into QGIS, ArcGIS or your consultant’s software directly.
- Optional Premium+ upgrade. Adds TargetMax™ Drilling Intelligence — drill-angle recommendations, higher ore-intersection probability and interactive 3D subsurface vein models, which is where the money goes furthest if a rig is genuinely imminent.
- Then take it to the ground. Run a focused soil grid or a trench across the ranked zones, then site your hole. The screen narrows the search; the ground still has to answer.
A short glossary
- Greenstone belt
- A preserved sequence of metamorphosed volcanic and sedimentary rocks enclosed within Archaean granitic basement. Zimbabwe’s greenstone belts host the overwhelming majority of the country’s gold occurrences.
- Zimbabwe Craton
- The Archaean continental nucleus underlying roughly sixty percent of Zimbabwe, with rocks dating back possibly as far as 3.46 billion years, bounded by the Limpopo Belt to the southeast and the Zambezi Belt to the north.
- Orogenic gold
- Gold mineralisation formed from fluids moving through deformation structures during mountain-building, typically hosted in quartz veins and shear zones. Structurally controlled, and therefore amenable to structural targeting from surface data.
- Alteration halo
- Chemically altered rock surrounding a mineralising system, usually far larger than the ore body inside it. Its size relative to the target is what makes remote detection of the system possible even though the metal itself is invisible.
- Prospectivity index
- A per-pixel composite score ranking relative favourability across a licence, built from a weighted combination of normalised sub-scores. It is a ranking — not a grade, not a probability, and not a resource.
- Exploration target
- A deliberately cautious industry term for an estimate too speculative to be reported as a Mineral Resource. Always expressed as a range, and never convertible into a resource without drilling and a qualified assessment.
- Small-scale miner (Zimbabwe)
- Statutorily, the holder of registered mining locations aggregating not more than forty hectares, employing fewer than fifty people and producing under 1,200 tonnes of ore a year.
- Fidelity Gold Refinery
- Zimbabwe’s sole authorised gold buyer and exporter, through which all legal gold production is delivered — which is why national delivery statistics give an unusually clean read on who is producing.
Small licence? That is an argument for screening it, not against.
Get your whole licence assessed on one consistent basis, ranked, and delivered as a report plus GIS files you own — before you commit a rig.
Frequently Asked Questions
Was anything drilled or confirmed on this Zimbabwean licence?
No. The client answered that the ranked targets have not been drilled and that drilling is planned on a horizon of six months or more. No mineralisation has been confirmed, no laboratory assay has been performed, and no grade is claimed or implied anywhere in this article. The reported value of this project is entirely at the targeting and decision stage — which is precisely what makes it worth publishing.
Is satellite screening worth it on a licence under 100 hectares?
This project is our strongest evidence that it is. On small ground the benefit shifts from coverage to precision: the full indicator stack concentrated over about a square kilometre produces fine-grained internal ranking rather than broad regional zones. It also matters more financially, because a small operator’s first drill decision typically carries a far higher share of their total risk capital than a major’s does. Screening has almost no mobilisation cost, which is exactly why its relative advantage is greatest on the smallest properties.
Can a satellite actually detect gold?
No, and anyone claiming otherwise is overselling. Gold has no usable spectral signature at exploration scale. What is mapped is the geological company gold keeps — iron-oxide and gossan response from weathering sulphides, clay and sericite alteration in the short-wave infrared, silicification, lithological contacts, and the structural architecture that localises orogenic gold. In the Zimbabwe Craton that structural control is unusually strong, which is what makes the approach productive there.
How reliable are the time and cost savings quoted here?
They are banded selections the client made on a fixed post-project feedback form — “6 months or more” and “up to USD 25,000”. They are the client’s own assessment against their own planned alternative approach, not measurements Farmonaut took and not audited figures. We deliberately do not convert bands into point estimates, average them across clients, or extrapolate from them.
Why is this client not named?
They declined to provide a testimonial, so the case study is published fully anonymised. No statement here is quoted from or attributed to them. The licence name and number, boundary, coordinates, district, exact area, exact dates and all zone-level results are withheld to protect their commercial position. Only the country, the commodity and their banded feedback answers are published.
What counts as a small-scale miner in Zimbabwe?
Statutorily, a holder of registered mining locations aggregating not more than forty hectares, employing fewer than fifty people and producing under 1,200 tonnes of ore a year. A sub-100-hectare licence therefore sits just above that statutory ceiling — larger than a small-scale holding in law, yet still very small by international exploration standards, which is the gap in the market this case study sits in.
How long does an analysis take and what do I receive?
Typically 5–20 business days depending on area size and mineral complexity. You receive a PDF report plus georeferenced GIS files you can load into your own systems and hand to your own geologist or a counterparty. The Premium+ upgrade adds TargetMax™ Drilling Intelligence, including drill-angle recommendations and interactive 3D subsurface vein models.
Can I report satellite results as a Mineral Resource?
No. Satellite-derived estimates are exploration targets, not Mineral Resources or Reserves under JORC, NI 43-101, SAMREC or any equivalent code. They cannot be reported as resources and do not replace drilling, sampling or a Competent or Qualified Person’s assessment. Their role is deciding where that regulated work should happen.
Published in fully anonymised form. The client is not identified and did not provide a testimonial; no statement in this article is quoted from or attributed to them, and no first-person wording is theirs. The licence name and number, boundary, coordinates, district, exact area, exact project dates and all zone-level results are withheld; the licence area is described only as a band. All outcome figures — including “6 months or more” and “up to USD 25,000” — are banded selections recorded on Farmonaut’s structured post-project feedback form, are the client’s own assessment against their own planned alternative, and are not measurements, audited figures or point estimates. No drilling has been carried out on this licence, no mineralisation has been confirmed, no laboratory assay has been completed, and no grade or tonnage is claimed or implied. Drilling and cost figures cited from third-party sources are indicative market ranges from those sources, not quotations for this or any other project. All imagery is illustrative and does not depict the client’s licence, any real identifiable mine, or any company asset. Satellite-derived estimates are exploration targets and do not constitute Mineral Resources or Ore Reserves under JORC, NI 43-101, SAMREC or any equivalent reporting code.
Discussion
Questions, corrections or field experience? Share them below. First-time comments are reviewed before they appear, and your email is never published.
No comments yet. Be the first to add a question or your experience.

 Comfix & Engineering Limited
 Congo Mining Solutions
 Mining SARL
 SenGold Invest SAS
 Sania Corporation
 Sean Mining Limited
 NTS Group (Pty) Ltd
 Mine4Africa
 Lithspo Minerals Limited
 Tintina Mining Group
 Dalgety Minerals Pty Ltd
 Vortex Minerals Pty Ltd
 Faith At Work (Pty) Ltd
 Geotech Mining Solutions plc
 Vulcan International Limited
 Kidepo Associates
 GKY Mining
 Alkimy SARL
 Double A Trading
 GemSprout Metals Limited
 Qader Group
