

Zimbabwe Gold Drill Validation: Target to Core
An exploration operator screened roughly 300 hectares of Zimbabwean gold ground from orbit, took the highest-ranked targets to a drill, and encountered mineralisation exactly where the analysis said it should be. They also reported saving six months or more of exploration time and USD 25,000–50,000 of exploration budget getting there.
There is a sentence that appears in almost every satellite exploration case study ever written, and it is almost always the last honest thing in the document: the targets have not been drilled yet. This project is one of the comparatively rare ones where that sentence does not apply. An operator holding roughly 300 hectares of gold ground in Zimbabwe commissioned a satellite prospectivity screen, received the ranked output in late 2025, put a drill into the ranked targets — and encountered mineralisation.
That is the strongest outcome a remote-sensing analysis can produce at this stage of an exploration programme. A prospectivity surface is a hypothesis until a rig tests it, and most never get tested at all. This one was, on the operator’s own ground, on their own budget, against their own timetable — and the rock agreed with the model.
What follows is the full path: why Zimbabwe’s Archaean greenstone ground responds so well to orbital screening, how three square kilometres were converted into a ranked drill queue, what the operator reported back about time and cost, and what a drill-stage validation actually unlocks for a licence holder who needs to finance the next phase.
What the client reported back to us
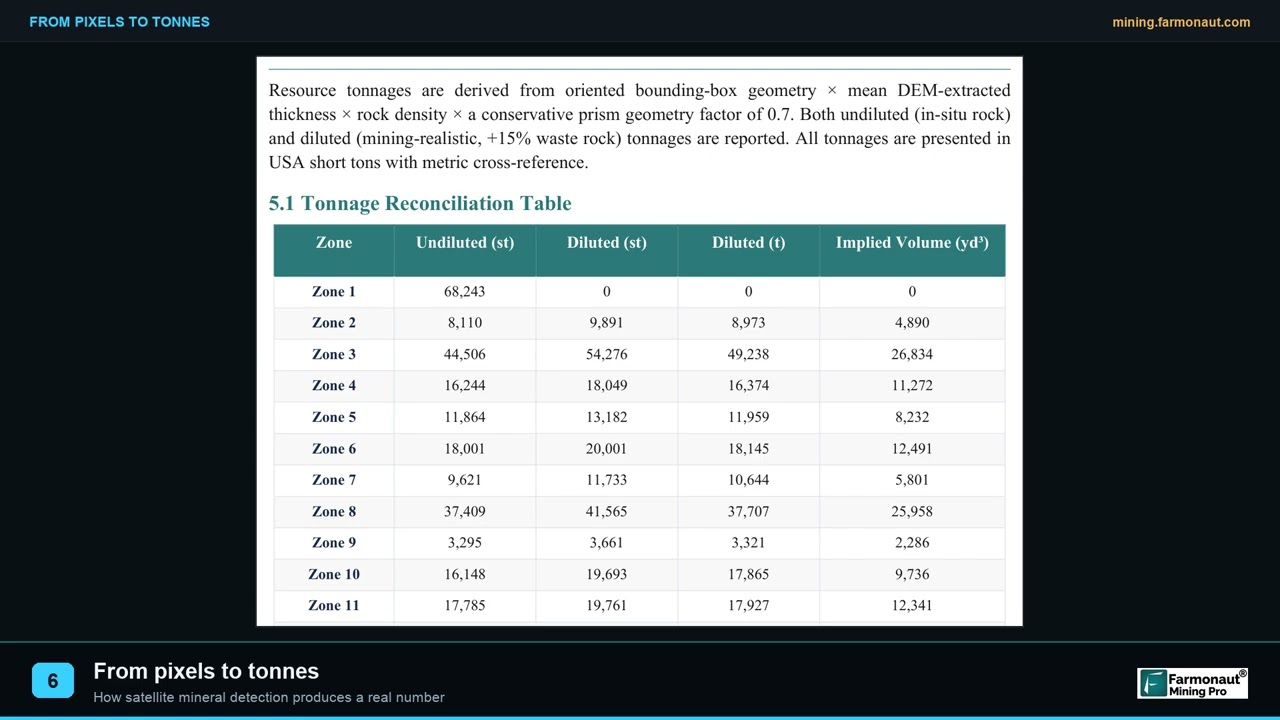
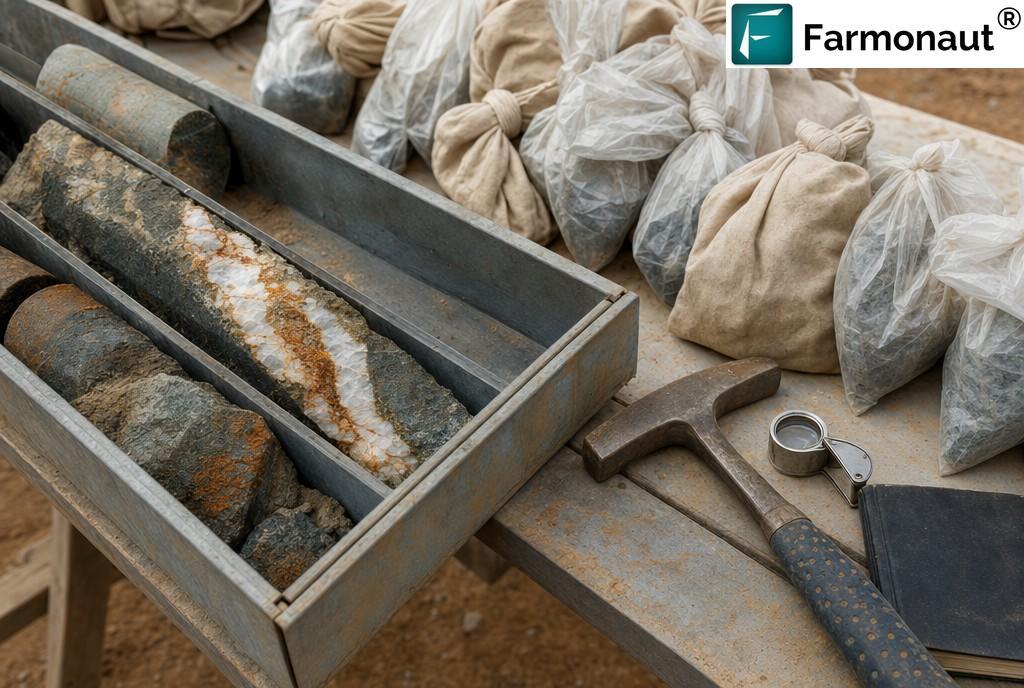
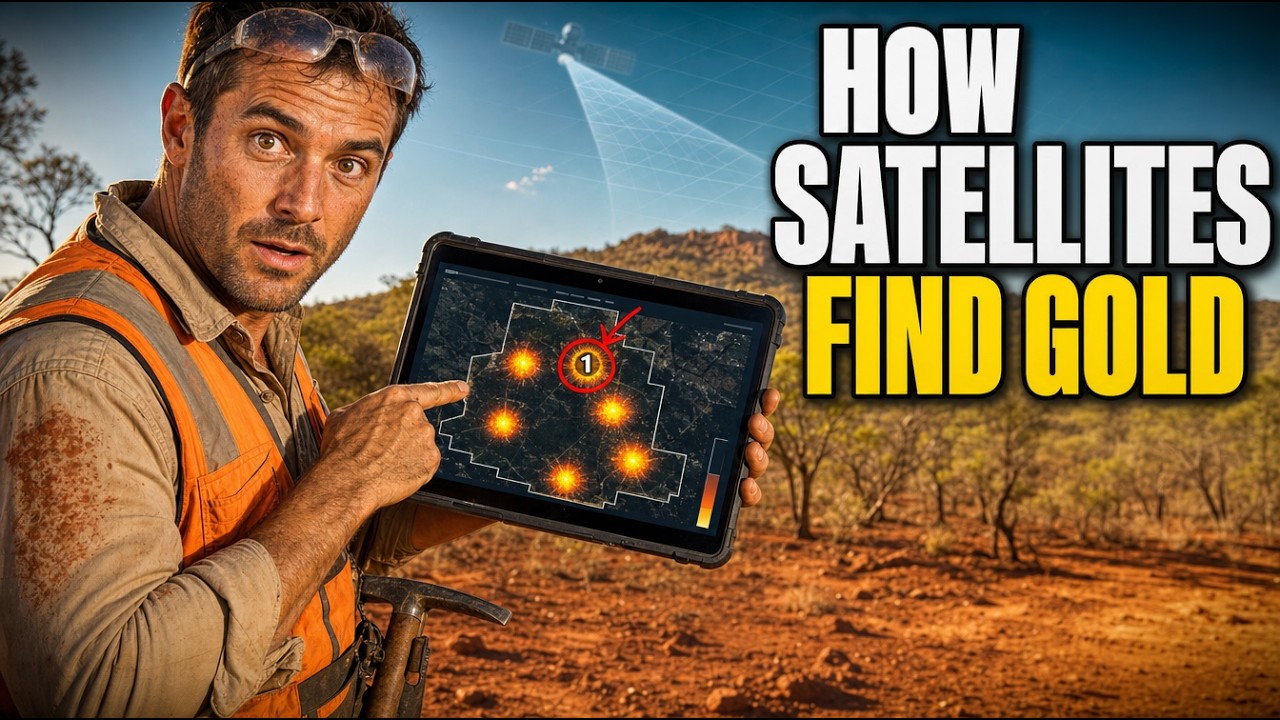
This client is not identified and did not provide a testimonial; no statement in this article is quoted from or attributed to them. The licence name and number, its boundary, coordinates, district, exact area, the exact delivery date and all zone-level results are withheld. All outcome figures are banded selections from our own structured post-project feedback form. Every image is illustrative and does not depict the client’s licence, equipment or samples.
Zimbabwe’s Gold Ground: Why Greenstone Belts Reward Satellite Targeting
To understand why a satellite screen had so much to work with on this licence, you have to start with the rock. Zimbabwe is, geologically, one of the more fortunate countries on earth for gold explorers, and the reason is a piece of Archaean crust that has been sitting more or less undisturbed for three billion years.
The craton and its belts
Most of Zimbabwe is underlain by the Zimbabwe Craton, an Archaean basement province containing rocks dated to as early as roughly 3.46 billion years, assembled from older segments that had stabilised by around 3.3 billion years ago. Cratons of this age are the world’s primary gold address. They are old enough to have hosted the long-lived, deep-crustal fluid systems that concentrate gold, and stable enough that the resulting deposits were never subsequently cooked, stretched or subducted out of existence.
Threaded through that granite-gneiss basement are the greenstone belts — elongate zones of variably metamorphosed mafic to ultramafic volcanic rocks with interlayered sediments, whose characteristic green tint comes from metamorphic chlorite, actinolite and other green amphiboles. In Zimbabwe these are locally called gold belts, which tells you everything about how the country has historically regarded them. The Midlands belt, the Bulawayo–Filabusi belts of Matabeleland, the Harare–Shamva and Mutare belts, and the classic Belingwe and Shurugwi sequences between them account for the overwhelming majority of Zimbabwe’s recorded gold production.
Cutting north-north-east across the whole craton is the Great Dyke, a layered ultramafic intrusion dated at about 2.575 billion years, some 550 kilometres long and three to twelve kilometres wide. It is world-famous for chromite and platinum-group elements rather than gold, but it matters to a gold explorer for a subtler reason: the Dyke is essentially undeformed since intrusion, which makes it a strain marker demonstrating that the craton had already stabilised by the late Archaean. In practical terms, the structures that host gold in these belts were largely locked in place before the Dyke arrived and have not been scrambled since. What you map at surface today has a defensible relationship to what formed at depth — which is precisely the assumption a satellite screen depends on, and one that does not hold everywhere in the world.
What orogenic gold leaves behind at surface
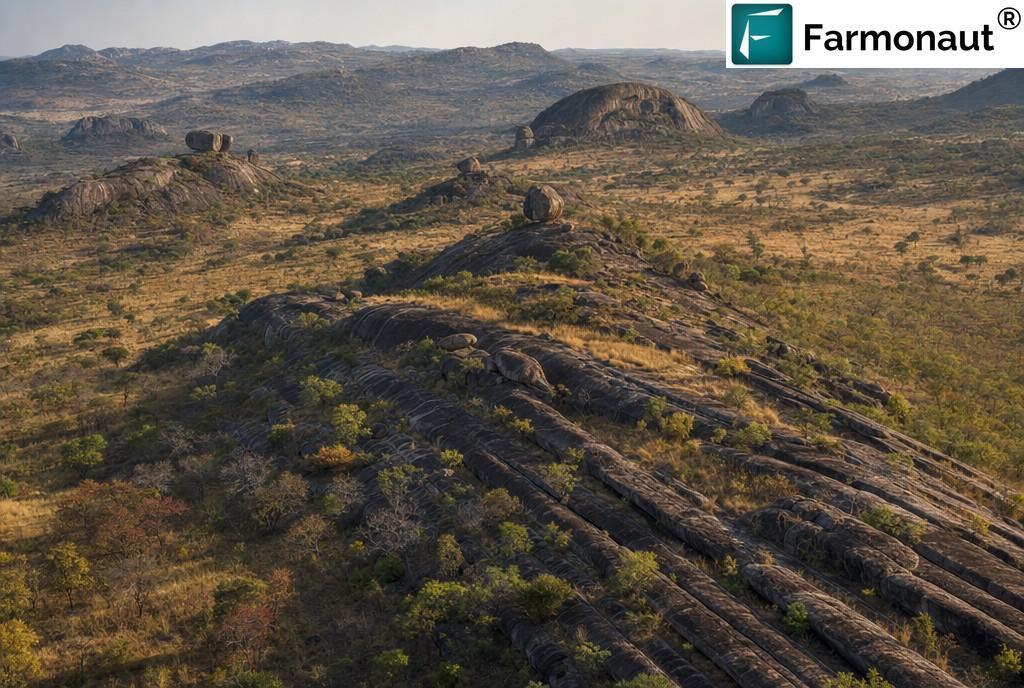
Greenstone-belt gold in Zimbabwe is overwhelmingly of the orogenic or mesothermal type: gold carried in hot, chemically reduced fluids that moved along shear zones and fracture corridors during and after regional deformation, then dropped their metal load where pressure, temperature or chemistry changed sharply. In the Bulawayo belt, for instance, gold deposition is closely tied to brittle–ductile second-order structures splaying off the regional shears that bound the belt margins, such as the WNW–ESE trending Umzingwane Shear Zone on the belt’s southern edge.
This is the single most important fact for a satellite screen, and it is worth stating plainly: the gold itself is invisible from orbit, but the plumbing that delivered it is not. Those fluids did not pass through rock without leaving a mark. They altered the wall rock around them for tens or hundreds of metres, converting original volcanic mineralogy into new assemblages — sericite and other white micas, chlorite, carbonate, and silica — and they oxidised iron-bearing minerals, which weather at surface into distinctive iron-oxide staining. They also filled the structures themselves with quartz, which behaves differently from its host under erosion and often stands out as resistant ridges and float trains.
Alteration halos are typically far larger than the mineralisation that sits inside them, frequently by one or two orders of magnitude. That size difference is the entire reason satellite screening works so well here: it converts a needle-sized exploration problem into a haystack-sized mapping problem, and mapping haystacks is something orbital sensors do superbly.
“The gold is invisible from orbit. The plumbing that delivered it is not — and the plumbing is far bigger than the prize.”
A satellite screen over Archaean greenstone ground works by coincidence of independent proxies — white-mica and clay alteration, iron-oxide response, carbonate signature, silica resistance, and structural architecture. One proxy is a curiosity. Four proxies stacked on the same ground, along a structure that makes geological sense, is a target worth a drill collar. On this project, that is exactly what the operator drilled.
The Project: Roughly 300 Hectares of Archaean Ground
The licence at the centre of this case study covered approximately 300 hectares. That is a specific and slightly awkward size, and it shapes everything about how the project had to be approached.
Why 300 hectares is the hardest size to explore well
Three hundred hectares is three square kilometres. It is too large to prospect exhaustively on foot at the density needed to find a blind or partly covered target — a systematic soil grid at a spacing tight enough to catch a narrow shear-hosted system across that area runs to thousands of samples, and the laboratory bill alone will comfortably exceed the entire first-year budget of most junior operators. But it is also far too small to justify the regional-scale tools that larger explorers reach for. Nobody flies a dedicated airborne geophysical survey over three square kilometres; the mobilisation cost swamps the survey cost.
So the licence sits in a genuine methodological gap. The traditional answer to that gap is to walk the obvious outcrop, follow whatever old workings exist, and drill where the quartz looks best. In a country with Zimbabwe’s density of historical and artisanal workings this is not a foolish strategy — old workings are, after all, evidence that somebody once found something — but it has a structural bias built into it. It preferentially finds what has already been found. Anything under soil cover, under a laterite duricrust, under alluvium in a drainage, or simply in a part of the property that is inconvenient to walk, stays invisible.
The commercial consequence is blunt. On ground this size, an operator typically has budget for one drilling campaign. Not a first campaign followed by a corrective second one — one. Whether that campaign is aimed correctly is very close to a binary determinant of whether the licence has a future. This is the problem the screen was bought to solve, and the client’s first recorded answer — yes, the analysis narrowed down where to explore or drill — is the direct answer to it.
When assessing a small licence, the sharpest question is not “what is the target?” but “on what basis was the drill collar chosen?” A hole sited because the analysis ranked that ground highest across the whole property, on one consistent basis, is a materially different proposition from a hole sited because that is where the old workings were. The first is a test of a model that can be re-run and extended. The second is a test of somebody else’s nineteenth-century judgement.
How 300 Hectares Became a Ranked Drill Queue
Farmonaut has been applying Earth observation and AI to mineral exploration since 2018, and has now screened more than 100,000 hectares across 25+ countries for over 20 mineral types. The workflow applied to this Zimbabwean licence followed our standard four stages, and the output of the fourth is the thing the operator actually used: an ordered list of places to put a rig.
- Multi-date acquisition. We assemble an image archive over the licence spanning multiple dates and seasons rather than working from a single scene. This matters more than it sounds: a single-date anomaly can be a wet patch, a burn scar, a recently ploughed field or a shadow. An anomaly that persists through wet and dry seasons across several years is far more likely to be mineralogical — and persistence testing is free, whereas confirming a false anomaly with a drill hole is not.
- Atmospheric correction and spectral decomposition. Raw satellite radiance is corrected to surface reflectance, then decomposed to separate genuine mineral response from the contributions of vegetation, soil, shadow and topography. On savanna ground with seasonal grass cover this step does most of the heavy lifting; without it, a “mineral map” is largely a vegetation map.
- Indicator mapping. We map the proxies individually — white-mica and clay alteration in the shortwave infrared, iron-oxide and ferric response in the visible and near infrared, carbonate signature, silica and resistant-ridge expression — alongside the structural architecture: lineaments, fracture corridors, shear traces, and the drainage anomalies that so often mark them. Each layer stands on its own evidence.
- Weighted ranking and delivery. Those independent layers are combined into a single prospectivity surface through a weighted composite of multiple normalised sub-scores. Discrete zones are then delineated and ranked against one another, and the package is delivered as a report plus georeferenced GIS files the operator loads directly into their own systems. Typical turnaround is 5–20 business days.
What a ranked queue changes about a drilling decision
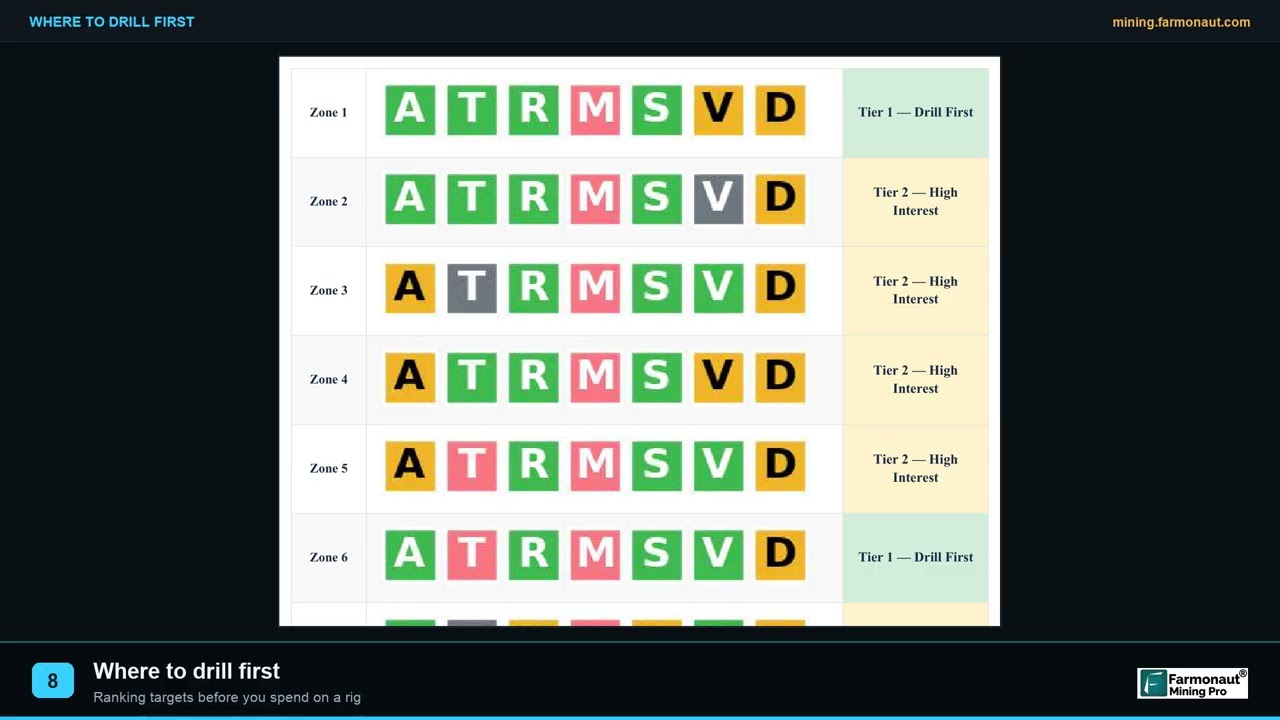
The word doing the work in that last stage is ranked. A prospectivity map that simply shades ground from warm to cool is interesting; a map that resolves the property into discrete, ordered, individually described zones is operational. The difference shows up the moment a drilling budget meets reality.
An operator with a ranked queue can answer the questions that actually determine a campaign. Which zone is hole one? If the budget stretches to three holes rather than one, which are holes two and three — and are they spread across independent zones to test breadth, or clustered to test continuity? If a partner funds an extension, what is next in the queue and why? If the first hole disappoints, what is the fallback, and does the fallback rest on the same indicators or on different ones? None of those questions has a defensible answer from a heat map alone. All of them have one from an ordered list with reasoning attached to each entry.
That is what turned three square kilometres of Archaean ground into a drilling programme on this licence: not a picture of where gold might be, but a sequence of places to test, in order, with the evidence behind each position written down and the whole property assessed on one consistent basis rather than on where somebody happened to walk.
When you receive a ranked prospectivity report, look for coincidence between independent indicator layers, not only the highest number on the composite surface. A mid-ranked zone where alteration, iron-oxide response and a structural corridor all overlap is frequently a better first hole than a top-ranked zone carried by a single strong index. The layers are supplied separately in the GIS package precisely so you can make that judgement yourself.
“A heat map tells you where to look. A ranked queue tells you what to drill first, second and third — and why.”
The Result: Ranked Targets Drilled, Mineralisation Encountered
The report was delivered in late 2025. What happened next is the reason this case study exists.
Asked whether the analysis narrowed down where to explore or drill, the client answered yes. Asked whether they had drilled the targets the analysis identified, they answered yes. Asked whether mineralisation was found at those targets, they answered yes.
A prediction made from orbit was tested against physical rock, and the rock agreed. For a remote-sensing analysis there is no stronger result available at this stage of a programme: the targeting logic held on this specific ground, under this specific cover and weathering regime. Mineralisation encountered is a field observation logged by the operator, with laboratory assay the next milestone in the programme — so no grade figure is quoted anywhere in this article.
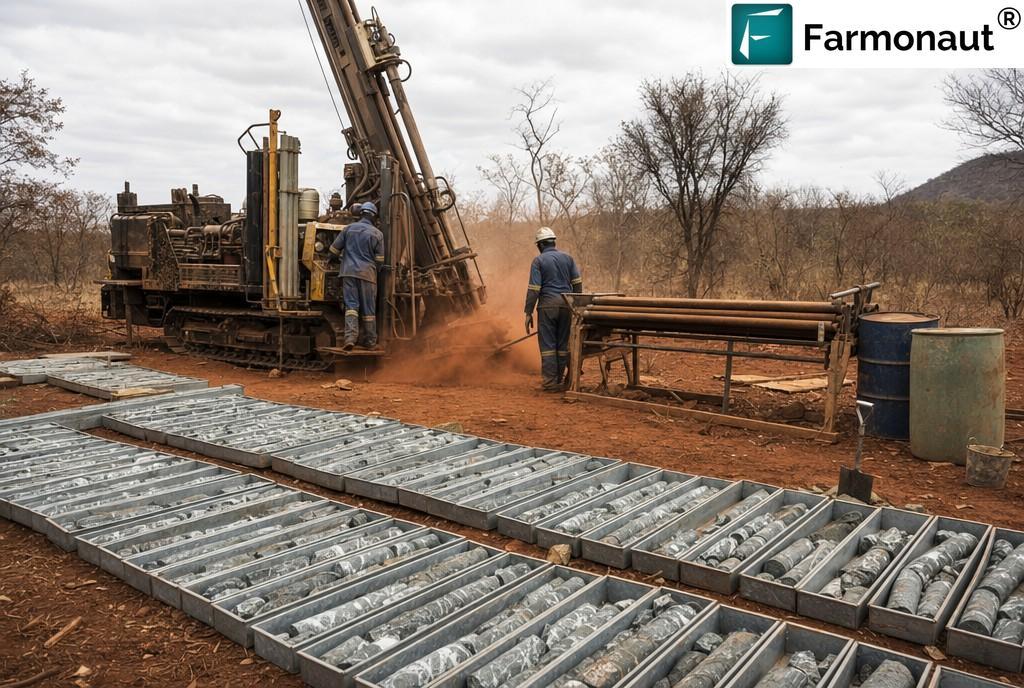
Use the report as a sequencing instrument, and it will repay you many times over. Three habits get the best out of it. Read the prospectivity surface as a ranking of ground rather than as a grade or a probability. Treat modelled depth as a guide to hole design derived from surface expression and structural geometry, and let the driller’s log refine it. And where a zone sits under transported soil, thick laterite or dense canopy, pair it with a little ground checking before committing the rig — cover mutes the surface signal, so those zones reward a short field visit more than the well-exposed ones do.
What Drill-Stage Validation Unlocks
A drill result changes an exploration project’s standing in ways a map, however good, cannot. It is worth being specific about what actually shifts for a licence holder the day a ranked target returns mineralised core.
The geological model stops being theoretical
Before drilling, a prospectivity surface is a chain of inferences: this spectral response implies this alteration mineral, which implies this fluid history, which implies mineralisation may sit here. Every link is plausible in isolation, and the chain as a whole is untested until something is drilled through it. A confirmed intersection at a ranked target means the chain held on this property, under its particular cover and weathering. That is the difference between a method that works in principle and a method that worked here.
Every remaining target inherits credibility
This is the most underrated commercial consequence of a first successful hole, and it compounds. The operator now knows which score band, and which specific combination of indicator layers, produced a hit on their own ground. Every remaining ranked zone can be re-read against that locally calibrated benchmark instead of a generic one. The second and third holes on a validated property are better-informed decisions than the first was — and cheaper ones, because the operator is no longer buying information about whether the model works at all. They have already paid for that answer, once.
Financing conversations change shape
Exploration budgets are approved against evidence, and the evidence bar rises steeply with the size of the cheque. “Our analysis ranks this zone highly” and “we drilled the highest-ranked zone and intersected mineralisation” are different propositions in front of a board, a joint-venture partner, a private lender or a strategic investor — even at identical geological maturity, and even before any grade is known. The first asks a funder to believe a model. The second asks them to fund the extension of a model that has already been tested once at the operator’s own expense.
There is a structural reason this matters more for small operators than for large ones. A major can absorb a dry campaign; a junior holding a single small licence often cannot, and funders price that asymmetry into every conversation. A physical result on the property is the cheapest available way to move a project from “speculative ground” to “programme in progress” in a funder’s mental filing system, and it is a distinction that tends to show up in the terms rather than merely in the answer.
Licence commitments become straightforward to evidence
Most exploration titles carry work obligations — expenditure to be incurred, activity to be reported, progress to be demonstrated at renewal. An operator who can show a licence-wide technical screen, a ranked target list derived from it, drill collars sited against that ranking, and mineralisation logged at the predicted location, has a defensible and self-consistent narrative for every one of those obligations. The work was planned on a documented basis, executed where the documentation said, and produced a recorded result. That is a far easier file to defend at renewal than a set of receipts and a verbal account.
And the next steps become obvious rather than open-ended
Assay attaches grade to the intersection. Additional holes test continuity, width and geometry. Sampling extends the picture laterally along the structure. Re-ranking the remaining zones against the calibrated benchmark tells you which of them to fold into the next campaign. None of that sequencing requires a strategic decision — it follows directly from having a confirmed intersection to build outward from, which is exactly what this operator now has.
A stage-by-stage view of what each step delivers
The clearest way to hold this in mind is to lay out each stage of an exploration programme against what it settles and what it opens up next. The highlighted rows are where this project has reached.
| Evidence stage | What it establishes | What it unlocks next |
|---|---|---|
| Regional geological context | That the property sits in a terrain known to host the deposit style sought | A reason to acquire or retain the ground |
| Satellite prospectivity screen (delivered here) | Relative ranking of ground across the whole licence on one consistent basis, with the indicator layers supplied separately | A drill queue, a budget that can be defended, and a technical file a third party can interrogate |
| Field checking and surface sampling | That the mapped alteration and structure exist on the ground as interpreted | Refined collar positions and hole design |
| Drilling, mineralisation logged (reached here) | That a mineralised system is physically present at the predicted location, and that the targeting logic held | Locally calibrated re-ranking of the remaining zones; a materially stronger financing and renewal position |
| Laboratory assay | Grade over defined intervals — the first quantitative basis for any economic statement | Interval selection for follow-up drilling and metallurgical work |
| Resource drilling to a reporting code | A Mineral Resource under JORC, NI 43-101 or SAMREC, signed by a competent or qualified person | Study work, and the modifying factors required before any Reserve can be declared |
When your first hole intersects mineralisation, go back to the prospectivity surface before you plan the second one — and do it while the logging is fresh. Record which score band and which combination of indicator layers produced the hit. That re-ranking is the single most valuable by-product of a successful first hole, and it costs nothing but an afternoon.
When assessing an early-stage licence, the sharpest question is simple: has anything here been physically tested, or is the whole story still a surface interpretation? A project where satellite targets have been drilled and mineralisation encountered sits at a materially different point on the risk curve from one that has never seen a rig — and it has already demonstrated that its operator will actually commit a campaign rather than accumulate maps.
The Reported Impact: Six Months and a Five-Figure Budget
Alongside the technical outcome, the client selected two banded impact figures from our feedback form. Both are client-reported bands chosen from fixed options — not figures we measured, calculated or audited — and both are worth unpacking for what they mean in practice on a licence of this size.
Time: six months or more
Asked whether the analysis reduced their exploration time, the client answered yes and selected the client-reported band “6 months or more”. That is the top band offered on the form, so it is open-ended: it tells us the saving was at least six months and says nothing about how much more.
Six months is, in exploration terms, a season — and in Zimbabwe seasons are not interchangeable. The practical field year is shaped by a wet season running roughly November to March, when access on unsealed ground becomes difficult and drilling logistics get markedly more expensive. A programme that reaches a drill decision half a year earlier does not merely finish sooner; it frequently lands in a completely different, and better, part of the calendar.
The knock-on effects compound in ways that rarely appear on a budget line. Licence work commitments are dated, and evidence of activity delivered a season early removes a renewal risk rather than merely deferring it. Funding usually arrives in tranches tied to milestones, so reaching a milestone two quarters early can pull an entire subsequent tranche forward. Rigs in southern Africa are booked in advance, and an operator who knows their collar positions six months ahead negotiates from a different position than one scrambling for a slot. And the option value is real: the earlier a result exists, the more time there is to act on it inside the same licence term.
Cost: USD 25,000–50,000 avoided
Asked whether the analysis reduced their exploration cost, the client answered yes and selected the client-reported band USD 25,000–50,000. Again: a banded selection made by the client, not a figure we derived. We do not know its composition and will not guess at one.
What can be said generically is what a conventional first-pass ground programme over 300 hectares consumes in southern Africa: systematic soil geochemistry at a useful spacing, laboratory turnaround on those samples, geological mapping, field crew mobilisation and accommodation, vehicle and fuel costs across a full season, and the supervision time to run it. That composite lands naturally in the tens of thousands of dollars. Across our project base, satellite screening typically lowers early-exploration cost by around 80–85% against such a programme — a portfolio-level observation about the method, offered as context for the client’s selection rather than as a derivation of it.
The more useful way to read a five-figure saving on a small licence is not as money returned but as money redeployed. On ground where the total exploration budget is itself measured in tens of thousands of dollars, USD 25,000–50,000 is frequently the difference between a screening programme that ends in a report and a programme that ends in a drill hole. It is, quite literally, the cost of the campaign that produced this project’s result.
“On a small licence, a five-figure saving is not money returned. It is the drilling campaign you can now afford.”
The screening phase involves no ground disturbance at all — no access tracks cut, no pits, no trenching, no drilling fluids, no water abstraction. On this project the ground that did not warrant work was ruled out without ever being physically touched, and the rig went only where the evidence pointed. On a compact licence in a country where land and water use are closely watched, concentrating disturbance into the smallest defensible footprint is both an environmental and a permitting advantage.
Why Documented Ground Matters in Zimbabwe’s Gold Economy
The commercial backdrop to this project is a gold sector that has changed character dramatically, and in a direction that makes technical documentation more valuable, not less.
Zimbabwe delivered a record 46,729 kg of gold — about 46.7 tonnes — to Fidelity Gold Refinery, the country’s sole authorised gold buyer, in 2025, a 28.1% increase on the 36,487 kg delivered in 2024. The composition of that total is the striking part. Artisanal and small-scale miners supplied 34,875 kg of it, up 46.9% year on year, while large-scale mining operations contributed 11,854 kg, a 7.0% decline (Mining Zimbabwe). The small-scale sector alone delivered nearly as much in 2025 as the entire country did in 2024.
That pattern held through the first half of the year as well: of 20,103.55 kg delivered between January and June 2025, artisanal and small-scale producers accounted for 14,561.68 kg — a 96.31% jump on the same period a year earlier — against 5,541.87 kg from large-scale operations (Mining Zimbabwe). Zimbabwe’s gold output is, in short, overwhelmingly produced by small operators, and gold in turn dominates a mining industry that contributes roughly a tenth of national GDP (overview).
“Zimbabwe’s gold is produced overwhelmingly by small operators. Technical documentation is exactly what small operators are least likely to have — and most need.”
The documentation advantage on small licences
Here is the consequence that matters for a holder of roughly 300 hectares. Small licences are usually held by operators without an in-house technical department. That is not a criticism; it is the normal structure of early-stage exploration almost everywhere. But it means the technical file supporting the licence is often thin — a boundary map, some assay certificates from grab samples, and a great deal of institutional knowledge that lives in one person’s head.
The moment the holder wants to do anything other than mine it themselves — raise money, bring in a joint-venture partner, satisfy a regulator’s work-commitment reporting, or sell — the counterparty on the other side of that conversation has a geologist, and that geologist wants files they can load and interrogate independently.
A satellite prospectivity study fills that gap in a way that is disproportionately valuable on a small property. It produces a structured, independent, third-party technical assessment covering the entire licence on one consistent basis, delivered with georeferenced GIS layers rather than as a narrative. And when the targets in that document have subsequently been drilled and mineralisation encountered — as on this project — the document stops being a plan and becomes a record of something that worked.
In a market where three-quarters of national gold output comes from small operators, the scarce asset is not prospective ground — Zimbabwe has an abundance of that. The scarce asset is ground that has been characterised in a form a third party can independently check. That is a document problem as much as a geology problem, and it is solvable long before a resource drilling programme is affordable.
What Made This Project Work
Four conditions lined up here, and they are worth naming precisely because they are the conditions worth reproducing on another licence.
- ✔ A deposit style with a genuine surface expression. Orogenic gold in Archaean greenstone belts sits inside alteration halos far larger than the mineralisation itself. The analysis had excellent material to work with, which is not true of every commodity in every setting.
- ✔ Multiple independent indicators pointing at the same ground. White-mica and clay alteration, iron-oxide response, carbonate signature and structural architecture are four separate lines of evidence. Coincidence between them is what makes a target worth a rig, and it is a far stronger basis than a high score on any single index.
- ✔ A compact, well-defined licence. Concentrating a full indicator stack over three square kilometres produces fine-grained ranking that genuinely distinguishes one part of the property from another — rather than the broad regional zones you get across a large concession.
- ✔ An operator who actually drilled. This deserves the most credit. A ranked target list is inert until somebody commits a rig to it. Most never are. This operator did, which is the only reason there is a validation result to write about at all.
How to Run This on Your Own Licence
- Send the ground. Coordinates, a KML/KMZ file, or a polygon drawn directly on the map — plus the country and every commodity you are targeting, not only the primary one. Secondary commodities change which indicator layers matter.
- We select the sensor stack. Multispectral or hyperspectral, matched to the area, the deposit style and the mineral complexity, with multi-date coverage so anomalies can be tested for seasonal persistence rather than trusted from one snapshot.
- Analysis and delivery. Typically 5–20 business days, delivered as a PDF report plus georeferenced GIS files you can load straight into your own systems — or hand to a partner’s geologist.
- Optional Premium+ upgrade. Adds TargetMax™ Drilling Intelligence — drill-angle recommendations aimed at raising ore-intersection probability, and interactive 3D subsurface vein models.
- Then drill. As this operator did — and as every satellite target ultimately requires.
A short glossary
- Archaean craton
- A large block of ancient, stable continental crust, in Zimbabwe’s case containing rocks dated to as early as around 3.46 billion years. Cratons of this age host a disproportionate share of the world’s gold.
- Greenstone belt
- An elongate zone of variably metamorphosed mafic to ultramafic volcanic rocks with interlayered sediments, set within granite-gneiss basement. Named for the green metamorphic minerals — chlorite, actinolite and other green amphiboles — that give the rocks their colour. Zimbabwe’s are known locally as gold belts.
- Orogenic (mesothermal) gold
- Gold deposited from hot, chemically reduced fluids moving along shear zones and fractures during and after regional deformation. The dominant gold deposit style in Zimbabwe’s greenstone belts, and the reason alteration mapping works so well there.
- Alteration halo
- Chemically altered wall rock surrounding a mineralising system, typically far larger than the mineralisation itself. Its size relative to the target is precisely what makes remote detection viable.
- Prospectivity index
- A per-pixel composite score ranking relative favourability across a licence, built from a weighted combination of normalised sub-scores. It is a ranking — not a grade, not a probability, and not a measurement.
- Mineralisation encountered
- A field observation that mineralised material — visible sulphides, oxides, veining or alteration — was intersected in drilling. It validates a target’s location; laboratory assay is what attaches a grade to it.
- Assay
- Laboratory determination of metal content over defined sample intervals, normally expressed for gold in grams per tonne. The first step at which any quantitative or economic statement becomes possible.
- Exploration target
- A deliberately cautious term for an estimate too speculative to be reported as a Mineral Resource. Always expressed as a range, and never convertible into a resource without drilling, sampling and a competent or qualified person’s sign-off.
Put your first drill hole where the evidence points
Screen your whole licence on one consistent basis, rank the ground, and commit your campaign to the strongest coincident signal — as this operator did.
Frequently Asked Questions
Did drilling confirm the satellite targets on this Zimbabwe project?
Yes. The client reported that they drilled the targets the analysis identified and that mineralisation was found at them. That is a field observation recorded by the client, and it is the validation step that matters most for a remote-sensing analysis: a prediction made from orbit was tested against physical rock. Laboratory assay, which attaches grade to such an observation, was the next milestone in their programme, so no grade figure is claimed or implied here.
What does a drill-stage validation actually unlock for a licence holder?
Four things. The geological model stops being theoretical. Every remaining ranked zone can be re-read against a locally calibrated benchmark, making the second and third holes better-informed than the first. Financing conversations move from “believe this model” to “fund the extension of a tested one”. And licence work commitments become straightforward to evidence at renewal, because the work was planned on a documented basis and produced a recorded result.
Can a satellite detect gold directly?
No, and it does not need to. What is mapped is the geological company gold keeps: white-mica and clay alteration, iron-oxide and ferric response, carbonate signature, silica expression, and the structural corridors that channelled the mineralising fluids. Because alteration halos are typically far larger than the mineralisation inside them, those proxies give a screen something big to find — and their coincidence on the same ground is what produces a ranked target.
Is 300 hectares big enough to justify a satellite screen?
Yes — and arguably it is the size that benefits most. Three hundred hectares is too large for exhaustive ground prospecting at useful sample density, but too small to justify a dedicated airborne survey. On compact ground the benefit shifts from coverage to precision: the full indicator stack concentrated over a small area produces fine-grained ranking, which matters most when the operator has budget for exactly one drilling campaign.
How long does the analysis take, and what do you receive?
Typically 5–20 business days depending on area size and mineral complexity. The deliverable is a PDF report plus georeferenced GIS files that load directly into standard exploration software, with the indicator layers supplied separately so you can interrogate them yourself. An optional Premium+ upgrade adds TargetMax™ Drilling Intelligence — drill-angle recommendations and interactive 3D subsurface vein models.
How should the reported time and cost savings be read?
As client-reported bands selected from fixed options on a structured post-project feedback form, and nothing more. The client selected “6 months or more” for time saved and “USD 25,000–50,000” for cost avoided. We did not measure, calculate or audit either figure, and neither band should be converted into a point estimate or extrapolated to any other project.
Why is the client not named?
This client did not provide a testimonial and is not identified. The licence name and number, its boundary, coordinates, district, exact area, exact dates and all zone-level results are withheld to protect their commercial position. Nothing in this article is quoted from them or attributed to them as speech; the outcomes reported are their recorded answers to fixed questions.
Is satellite analysis valid for resource reporting?
No. Satellite-derived estimates are exploration targets, not Mineral Resources or Reserves under JORC, NI 43-101, SAMREC or any equivalent code. They cannot be reported as resources and do not replace drilling, sampling, assay or a competent or qualified person’s assessment. Their role is to decide where that work should happen — which is exactly the role they played here.
Published in anonymised form. The client is not identified and did not provide a testimonial; no statement in this article is quoted from or attributed to them. The licence name and number, its boundary, coordinates, district, exact area, exact project dates and all zone-level results are withheld. All outcome figures are banded selections recorded against fixed questions in Farmonaut’s structured post-project feedback form and are the client’s own self-reported responses, not measured or audited savings. Mineralisation reported at the drilled targets was a client field observation; laboratory assay had not been completed at the time of reporting, and no grade, tonnage, contained-metal or economic figure is claimed or implied for this project. Satellite screening detects alteration mineralogy, iron-oxide and clay signatures and structural architecture — not gold itself; depth is modelled from surface expression rather than measured, and the surface signal weakens under transported cover, thick laterite or dense canopy. Satellite-derived estimates are exploration targets and do not constitute Mineral Resources or Reserves under JORC, NI 43-101, SAMREC or any equivalent reporting code. All imagery is illustrative and does not depict the client’s licence, site, equipment or samples. Third-party production statistics are attributed to their published sources and were current at the time of writing.
Discussion
Questions, corrections or field experience? Share them below. First-time comments are reviewed before they appear, and your email is never published.
No comments yet. Be the first to add a question or your experience.

 Denkyira Nkoranza Concession
 Mwerezi Minerals Company Limited
 Congo Mining Solutions
 Mining SARL
 SenGold Invest SAS
 Sania Corporation
 Sean Mining Limited
 NTS Group (Pty) Ltd
 Mine4Africa
 Lithspo Minerals Limited
 Tintina Mining Group
 Dalgety Minerals Pty Ltd
 Vortex Minerals Pty Ltd
 Faith At Work (Pty) Ltd
 Geotech Mining Solutions plc
 Vulcan International Limited
 Kidepo Associates
 GKY Mining
 Alkimy SARL
 Double A Trading
