

Western Australia mining · Mine list and map
Lithium Mines in Western Australia: Full List by Owner
Eight lithium projects are on Western Australia’s principal list, and seven were producing in the latest company reports. Greenbushes is the largest at 1,410 kt of spodumene in the year to June 2026. This page adds owners, the main gold mines, the official map and royalty calculators.
Key takeaways
- Seven lithium mines were producing in July 2026 reports: Greenbushes, Pilgangoora, Wodgina, Mt Marion, Kathleen Valley, Mt Holland and Bald Hill; Mt Cattlin has been on care and maintenance since 2025 (DMPE, 2024-25; company reports, July 2026).
- Greenbushes produced 1,410 kt of spodumene in FY26 (100% basis) and Pilgangoora a record 879.5 kt (IGO and PLS quarterly reports, July 2026).
- Western Australia had 139 principal mining projects in 2024-25, 65 of them gold and 8 lithium; gold sales hit a record A$29.2 billion while lithium fell to A$4.3 billion (DMPE Statistics Digest, 2024-25).
- The state’s Operating Mines dataset downloads as CSV, KMZ or shapefile, and MINEDEX exports reports to Excel and PDF with no login (data.wa.gov.au; wa.gov.au).
- Royalty is 5% of royalty value on concentrate and 2.5% on gold, with the first 2,500 oz a year of gold exempt (WA mineral royalties fact sheet, September 2025).
In this article
- Lithium mines in Western Australia: the full list
- Map of lithium and other mines in WA
- How many mines are there in Western Australia?
- List of gold mines in Western Australia
- Lithium price, sales and jobs: boom, reset and recovery
- Royalty on lithium and gold sales
- Screening ground near these mines before you apply or buy
- Frequently asked questions
Short answer. Eight lithium mining projects sit on the Western Australian Government’s list of principal projects (DMPE Statistics Digest, 2024-25). Seven were producing spodumene concentrate in the latest company reports: Greenbushes, Pilgangoora, Wodgina, Mt Marion, Kathleen Valley, Mt Holland and Bald Hill, which restarted in May 2026. The eighth, Mt Cattlin, has been on care and maintenance since 2025. Greenbushes is the largest by output, at 1,410 thousand tonnes (kt) of spodumene in the year to June 2026 on a 100% basis (IGO quarterly report, 28 July 2026).
This page lists each mine with its owners, location, status and latest output. It then covers the main gold mines in the state, how many mines Western Australia has, where to download the official map and list, and the royalty that applies to lithium and gold sales. Spodumene is the lithium-bearing mineral mined from pegmatite rock; mines crush and concentrate it into a product that ships mainly to China. Western Australia’s whole mining sector sold A$220 billion of minerals and petroleum in 2024-25, of which lithium was A$4.3 billion and gold a record A$29.2 billion (DMPE Statistics Digest, 2024-25).
Lithium mines in Western Australia: the full list
The table is ordered by the latest full-year volume each operator reports, with the mines that report no annual volume last. Read the last column before you compare rows. Greenbushes and Pilgangoora report spodumene concentrate of all grades. Wodgina and Mt Marion report sales in dry metric tonnes (dmt) of SC6, which is concentrate converted to a 6% lithium oxide (Li2O) grade. Kathleen Valley reports concentrate produced at an average 5.1% Li2O. Because of these different bases, the volumes are not directly comparable. Kathleen Valley and Wodgina are close in size. FY26 means the financial year to 30 June 2026.
| Mine | Where | Owners | Status in latest company reports | Latest full-year volume |
|---|---|---|---|---|
| Greenbushes | South West region | Talison, owned by Windfield Holdings: Albemarle 49%, Tianqi Lithium Energy Australia 51% (IGO 49% and Tianqi 51% of that venture) | Producing; a June 2026 fire stopped the new CGP3 plant for about seven weeks | 1,410 kt spodumene produced, FY26, 100% basis |
| Pilgangoora | Pilbara, ships through Port Hedland | PLS Group | Producing; Ngungaju plant restarted on 1 July 2026 | 879.5 kt concentrate produced, FY26 |
| Kathleen Valley | Goldfields, about 60 km north of Leinster | Liontown Resources | Producing, now fully underground | 391,992 dmt concentrate produced, FY26 |
| Wodgina | Pilbara | MARBL joint venture: Mineral Resources 50%, Albemarle 50%; operated by Mineral Resources | Producing; all three processing trains in operation from the September quarter 2026 | 317,000 dmt SC6 sold, FY26 |
| Mt Marion | Goldfields, about 40 km south-west of Kalgoorlie | Mineral Resources 50%, Ganfeng Lithium 50%; operated by Mineral Resources | Producing; underground and flotation plant approved in May 2026 | 242,000 dmt SC6 sold, FY26 |
| Mt Holland (Earl Grey) | About 105 km south-south-east of Southern Cross | Covalent Lithium: Wesfarmers 50%, SQM 50% | Producing; expansion approved in July 2026 | Nameplate about 380,000 t a year of concentrate, 100% basis |
| Bald Hill | Goldfields-Esperance, about 105 km south-east of Kalgoorlie | Mineral Resources | Restarted in May 2026 after care and maintenance since December 2024 | Ramp-up to 140,000 dmt SC6 of capacity due in the December quarter 2026 |
| Mt Cattlin | Just north of Ravensthorpe | Rio Tinto, through its purchase of Arcadium Lithium | Care and maintenance since 2025 | None; the site is idle |
Sources for the table are the company reports named in each section below, the DMPE digest for owners and care-and-maintenance dates, and the project profiles cited for locations. Ownership changes often; confirm it in the latest company filing before you rely on it.
Greenbushes: the largest lithium mine in Western Australia
Talison runs Greenbushes. IGO’s quarterly report states that Windfield Holdings owns 100% of Talison, and that Tianqi Lithium Energy Australia owns 51% of Windfield and Albemarle 49%. IGO holds 49% of the Tianqi venture and Tianqi 51%, which works out to roughly 25% for IGO and 26% for Tianqi in the mine itself (IGO, July 2026). IGO’s lithium exposure therefore comes through Greenbushes and the Kwinana hydroxide refinery; Talison, not IGO, operates the mine.
In FY26 Greenbushes produced 1,410 kt of spodumene and sold 1,368 kt, at a production cash cost of A$415 a tonne and an average realised price of US$1,443 a tonne. The June 2026 quarter price was US$2,286 a tonne, up from US$1,668 in the March quarter. FY27 guidance is 1,550 to 1,750 kt (IGO, July 2026). The new chemical-grade plant, CGP3, contributed 71 kt in the June quarter before the fire.
Pilgangoora: the Pilbara’s biggest producer
PLS Group produced a record 879.5 kt of spodumene concentrate in FY26, up 17% on the 754.6 kt of FY25, at a unit operating cost of A$569 a tonne (FOB, the cost of loading onto a ship at Port Hedland, before sea freight). Its realised price in the June quarter was US$2,415 a tonne on an SC6 basis. PLS restarted its second processing plant, Ngungaju, on 1 July 2026 after care and maintenance since December 2024, and guides to 1,030 to 1,100 kt for FY27 (PLS June quarter report, 30 July 2026).
Wodgina, Mt Marion and Bald Hill: the Mineral Resources group
Mineral Resources (MinRes) operates three WA lithium mines. Wodgina in the Pilbara sold a record 317,000 dmt SC6 in FY26 at an FOB cost of A$738 a tonne. Mt Marion near Kalgoorlie sold a record 242,000 dmt SC6 at A$847 a tonne. The two mines together sold 158,000 dmt SC6 in the June 2026 quarter at an average US$2,425 a tonne CIF (cost, insurance and freight to the buyer’s port), up 15% on the March quarter. In May 2026 MinRes approved A$490 million (100% basis) for a flotation plant and underground mining at Mt Marion, and it restarted Bald Hill, which made first concentrate in June 2026 and shipped in July (MinRes Q4 FY26 report, July 2026). Mt Marion lies about 40 km south-west of Kalgoorlie (Global Mining Review, 2024). Bald Hill is in the Goldfields-Esperance region, about 105 km south-east of Kalgoorlie (Mining Technology).
Kathleen Valley: Liontown’s underground mine
Liontown Resources produced its first concentrate at Kathleen Valley in July 2024 (DMPE). In FY26 it produced 391,992 dmt and shipped 381,997 dmt at an average 5.1% Li2O, and open-pit mining ended during the year so the mine is now fully underground, with a target of 2.8 million tonnes of ore a year by the end of FY27 (Liontown FY26 results, 31 August 2026). The project is nearly 60 km north of Leinster (NS Energy).
Mt Holland: Covalent Lithium’s mine and Kwinana refinery
Covalent Lithium is a 50:50 venture of Wesfarmers and SQM. The Earl Grey deposit at Mt Holland is about 105 km south-south-east of Southern Cross, in the Shire of Yilgarn (EPA Western Australia). On 22 July 2026 the partners approved a second concentrator that lifts nameplate capacity from about 380,000 to 760,000 tonnes of spodumene concentrate a year, with construction due to start in the second half of calendar 2027 (Wesfarmers ASX release). Covalent’s Kwinana refinery made its first lithium hydroxide in August 2025 (DMPE).
Mt Cattlin: on care and maintenance
Mt Cattlin sits about 2 km north of Ravensthorpe (Mining Technology). Rio Tinto took it over when it completed the purchase of Arcadium Lithium in March 2025, and placed it on care and maintenance in 2025: Rio Tinto’s operations reviews give the end of March 2025, and the DMPE digest records July 2025 (DMPE). The same digest records Bald Hill and the Ngungaju plant going idle in December 2024 and a A$150 million state support package for lithium announced in November 2024. Two of those three have since restarted.
For a wider look at lithium geology and the other Australian projects, see our guides to lithium in Australia, lithium mining trends in Western Australia and lithium deposit types.
Map of lithium and other mines in WA
Lithium mines sit in three areas. The Pilbara, in the north, holds Pilgangoora and Wodgina. The Goldfields holds Mt Marion, Kathleen Valley and Bald Hill, in the same region as the Kalgoorlie gold mines. The South West holds Greenbushes. Mt Holland lies south-south-east of Southern Cross, and Mt Cattlin near the south coast. The digest reports sales of spodumene together with the other products those mines sell, such as tantalum and silica, by region for 2024-25.
| Region (as the digest groups it) | Value of sales, 2024-25 |
|---|---|
| South West (tin, tantalum and lithium) | A$1.82 billion |
| Pilbara (spodumene and tantalum pentoxide) | A$1.37 billion |
| Goldfields-Esperance (spodumene and tantalum pentoxide) | A$0.88 billion |
| Wheatbelt (spodumene and silica) | A$0.29 billion |
The Pilbara has two large lithium mines, but the South West earned more in 2024-25. Its figure also includes tin and tantalum, and Greenbushes is the largest single producer: in FY26 it produced more spodumene than Pilgangoora and Wodgina together. Source for the table: DMPE Statistics Digest, Table 7, 2024-25.
Where to get the official map, list and PDF
The state publishes the underlying data in three places, and none needs a login.
- Operating Mines dataset. A map layer of every mine whose status is operating or under development, taken from MINEDEX and updated regularly. It downloads as CSV, KMZ for Google Earth, shapefile, geodatabase or MapInfo TAB, under a Creative Commons licence (data.wa.gov.au).
- MINEDEX. The full mines and mineral deposits database, with operating status, location and mineral resource estimates. It needs no login, can be searched spatially in GeoVIEW.WA, and exports custom reports to Excel and PDF (wa.gov.au).
- The Statistics Digest. Its Table 13 lists every principal mining project by company with notes on sales, restarts and care and maintenance, in a PDF you can print (DMPE).
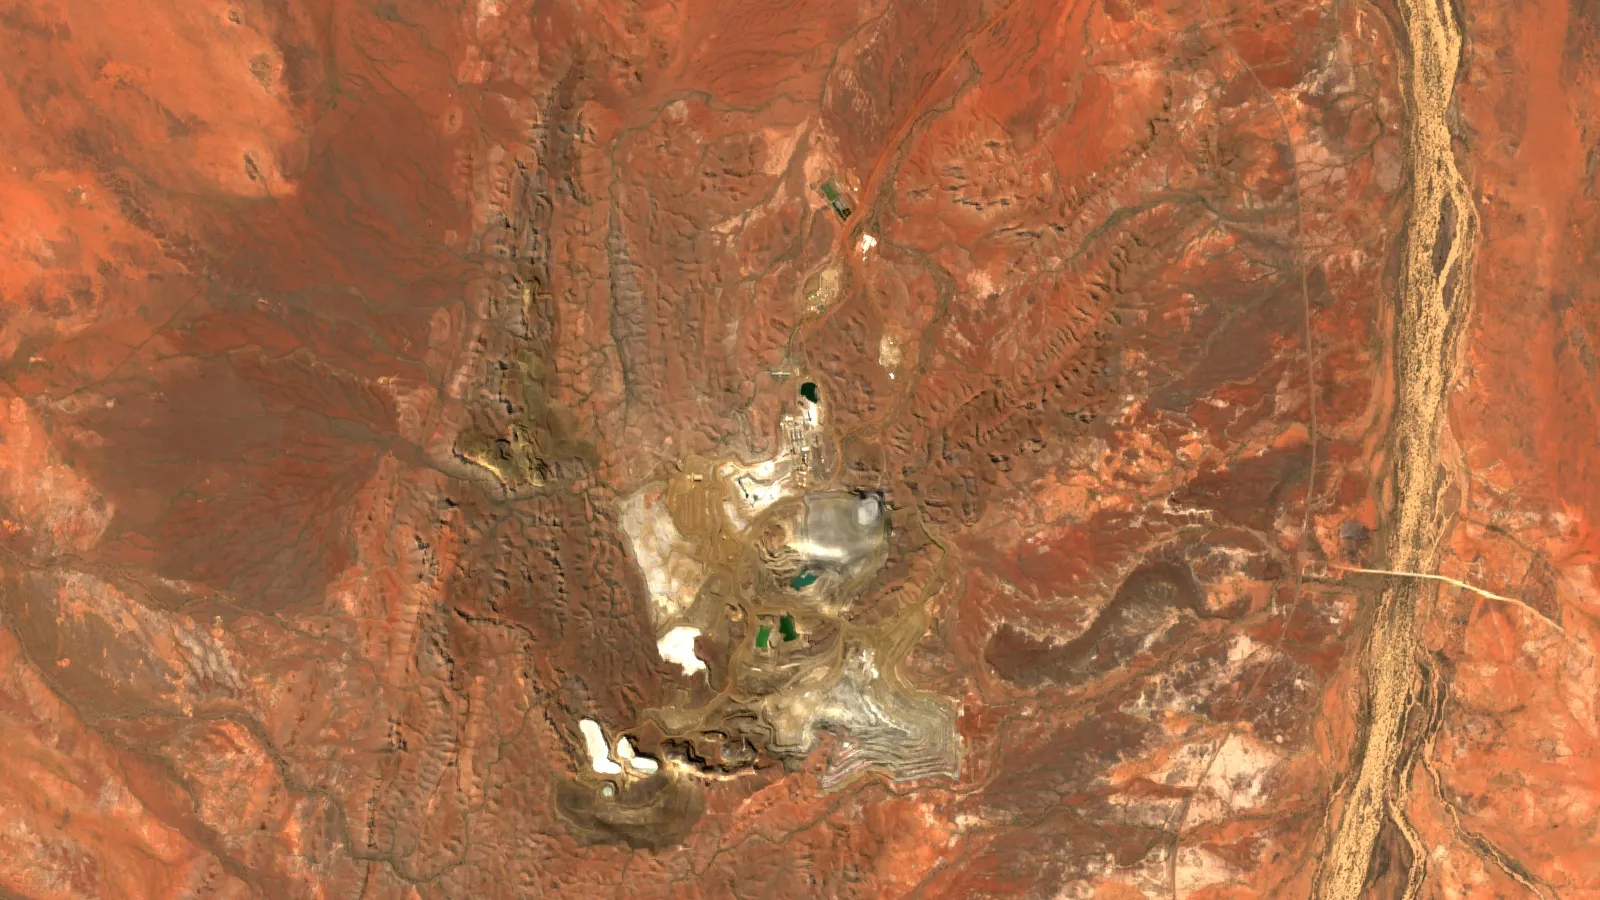
Load the Operating Mines KMZ in Google Earth and switch on satellite imagery to see how each pit and plant looks from above. For older workings and prospects, MINEDEX is the better layer.
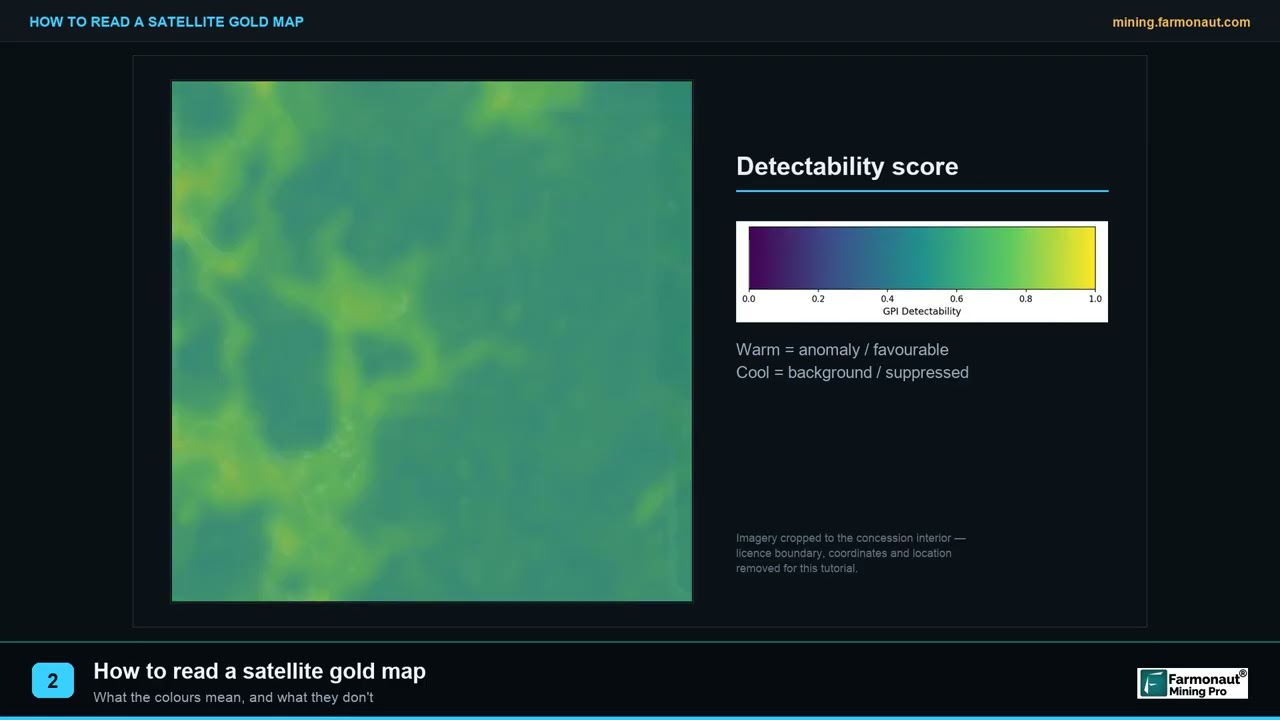
▶ Farmonaut explainer: how to read a satellite map of mineral ground. · 1:40
How many mines are there in Western Australia?
The DMPE counted 139 principal mining projects in 2024-25. A principal project is one that produced minerals worth more than A$5 million, or more than 2,500 ounces of gold, in a financial year, or a project on private land with more than 50 full-time-equivalent staff. Gold accounted for 65 of them, almost half, followed by iron ore with 28, mineral sands with 12, lithium with 8, salt with 6 and nickel with 5. The State also had 11 principal producers of basic raw materials such as aggregate and limestone, and 15 major mineral processing plants (DMPE Statistics Digest, 2024-25).
Chart
Principal mining projects by main commodity
Number of projects, 2024-25; selected commodities
That count leaves out small operations, basic raw material quarries and mines on care and maintenance that produced nothing, so a “mine sites in WA” search on MINEDEX returns many more records. On-site employment in mining was 134,009 full-time-equivalent positions in 2024-25, of which iron ore had 65,496, gold 35,672 and lithium 9,337.
List of gold mines in Western Australia
Western Australia produced 208,611 kg of gold (6.7 million troy ounces) in 2024-25, worth a record A$29.2 billion. The average gold price over the year was US$2,820 (A$4,366) an ounce (DMPE). The table lists the main operations and their operators as the digest records them. Output is given only where the operator reports it for a clearly named period.
Chart
Sales value of selected commodities
A$ billion, financial years; iron ore excluded
| Mine or hub | Operator (owners) | Notes |
|---|---|---|
| Super Pit (Fimiston) and the Kalgoorlie hub, with Kanowna Belle | Northern Star Resources | The Kalgoorlie production centre sold 844,333 oz in the year to June 2026 |
| Jundee, Thunderbox, Bronzewing (Yandal hub) | Northern Star Resources | The Yandal production centre sold 433,768 oz in the year to June 2026 |
| Boddington | Newmont | 565,000 oz produced in 2025 |
| Tropicana | AngloGold Ashanti 70%, Regis Resources 30% | AngloGold Ashanti also runs Sunrise Dam |
| Granny Smith, St Ives, Agnew-Emu, Gruyere | Gold Fields | Gold Fields bought Gold Road in 2025 and so took 100% of Gruyere |
| Telfer | Greatland Gold | Bought from Newmont in April 2025 |
| Mungari and Kundana | Evolution Mining | The Mungari expansion finished in July 2025 |
| Gwalia, Ulysses (Leonora) and Redcliffe (Laverton) | Genesis Minerals | Genesis also bought the Laverton mill in June 2025 |
| Mt Magnet and Penny | Ramelius Resources | Ramelius put Edna May, Symes and Tampia on care and maintenance in early 2025 |
| Duketon | Regis Resources | Includes the Garden Well operations |
| Plutonic | Catalyst Metals | Listed by DMPE as a principal gold project |
| Cue, Fortnum and Meekatharra | Westgold Resources | Murchison hub |
| Darlot, King of the Hills, Mt Monger | Vault Minerals | Leonora and Mt Monger operations |
| Karlawinda | Capricorn Metals | A$120 million expansion to 6.5 million tonnes a year began in August 2025 |
Sources: DMPE Statistics Digest, Table 13 and notable events, for owners and deals; Northern Star June 2026 quarterly report for the two hubs; Newmont Q4 2025 operating statistics for Boddington. The Kalgoorlie centre figure covers Northern Star’s Super Pit (KCGM), Kalgoorlie Operations (Kanowna Belle and South Kalgoorlie) and Carosue Dam, not the Super Pit alone.
Northern Star’s Kalgoorlie and Yandal production centres together sold about 1.28 million ounces in the year to June 2026, and Boddington in the south-west produced 0.57 million ounces in calendar 2025. For where the gold sits geologically, see our guides to gold deposits in Australia by state and gold exploration in Australia, and for company rankings the list of the world’s largest gold miners.

▶ Farmonaut explainer: how satellites help find gold, and what remote sensing can and cannot show. · 4:25
Lithium price, sales and jobs: boom, reset and recovery
Western Australian lithium sales fell from a record A$21.5 billion in 2022-23 to A$8.5 billion in 2023-24 and A$4.3 billion in 2024-25, even as volume rose. The State sold a record 3.85 million tonnes of spodumene concentrate in 2024-25, helped by the Pilgangoora expansions, Mt Marion, Mt Holland and Kathleen Valley. The spodumene price fell to an average A$940 a tonne in June 2025, against A$1,679 a year earlier and a peak above A$9,200 in late 2022. Exports went overwhelmingly to China, at 94.5% of the 2024-25 total by value, with South Korea and Indonesia the next largest (DMPE Statistics Digest, 2024-25). Jobs followed the price: on-site lithium employment rose from 1,846 full-time-equivalent positions in 2020-21 to 11,435 in 2023-24, then fell to 9,337 in 2024-25.
Chart
On-site lithium employment
Full-time-equivalent positions, financial years
Chart
Spodumene concentrate price, 6% grade
A$ per tonne, CIF China, monthly average; peak is a lower bound
Prices have recovered since. MinRes reported an average US$2,425 a tonne CIF for SC6 in the June 2026 quarter, IGO reported US$2,286 a tonne for Greenbushes, and PLS reported US$2,415 a tonne on an SC6 basis (company reports cited above, July 2026). Those are realised prices for one quarter, not a spot price, and index prices can differ; check a current assessment before you use a number in a model.
On the national scale, the USGS estimates Australia mined 92,000 tonnes of lithium content in 2025, about 32% of the 290,000 tonnes worldwide, up from 82,700 tonnes in 2024 (USGS Mineral Commodity Summaries, 2026).
Royalty on lithium and gold sales
Western Australian royalties are set by the Mining (Royalties) Regulations 2025 and, for major projects, by their State Agreement. For most minerals the rate is a percentage of the royalty value, depending on how far the product is processed in the state: 7.5% if sold crushed or screened, 5% as a concentrate and 2.5% in metallic form or equivalent. Allowable deductions include reasonable transport costs. Gold has its own rate of 2.5% of the royalty value, with nothing payable on the first 2,500 ounces a year from a gold royalty project, and gold is valued at the London Bullion Market price in Australian dollars (WA mineral royalties fact sheet, 1 September 2025).
The two calculators below apply these rules to a simple case. They are examples: your tenement’s royalty value and any State Agreement terms control the real figure. Royalties raised A$9.9 billion for the State in 2024-25, down from A$12.0 billion a year earlier as iron ore and lithium prices fell (DMPE).
Calculator
What royalty would a lithium concentrate sale pay?
Enter your own tonnes, price, exchange rate, freight and rate.
- Sales value (A$): $300,000,000
- Royalty value after freight (A$): $288,000,000
- Royalty as share of sales: 4.8%
Example values only, not a forecast. The 5% rate for concentrate and the freight deduction follow the WA mineral royalties fact sheet (Government of Western Australia, 1 September 2025); a State Agreement can set different terms. The price and exchange rate are examples: use today’s price. The result is a simplified royalty before any adjustment by the regulator.
Calculator
What royalty would a gold mine pay?
Enter your own ounces, price, exempt ounces and rate.
- Gross gold value (A$): $500,000,000
- Royalty as share of gross value: 2.4%
Example values only, not a forecast. The 2.5% rate, the 2,500 oz annual exemption and the London Bullion Market valuation in Australian dollars follow the WA mineral royalties fact sheet (Government of Western Australia, 1 September 2025). The price is an example: use today’s price.
Screening ground near these mines before you apply or buy
If you hold or plan to buy a tenement in a lithium or gold district, check three things before any field spend: the tenement status and its neighbours in MINEDEX, the mapped geology, and what the ground looks like from space. Satellite imagery can map clay and iron-oxide alteration and mapped structures across a whole tenement in one pass, so a consultant or investor can rank ground before drilling. The result is an exploration target that sits ahead of a resource estimate; it does not replace sampling. Farmonaut screens a polygon you supply with satellite data, and you can send your site details through the mining query form or read about our satellite-based mineral detection service.
For Europe’s hard-rock and brine projects, see lithium mining in Europe.
For other states and commodities, see the Australia mineral deposits map guide.
Western Australia’s spodumene mines are pegmatites: see pegmatite deposits, LCT vs NYF.
Frequently asked questions
How many lithium mines are in Western Australia?
Eight projects are on the State’s principal projects list for 2024-25. Seven are producing in the latest company reports: Greenbushes, Pilgangoora, Wodgina, Mt Marion, Kathleen Valley, Mt Holland and Bald Hill. Mt Cattlin is on care and maintenance (DMPE).
What is the biggest lithium mine in Western Australia?
Greenbushes, with 1,410 kt of spodumene produced in the year to June 2026 on a 100% basis, ahead of Pilgangoora at 879.5 kt (IGO and PLS, July 2026).
Who owns Greenbushes?
Talison Lithium operates it. Talison is owned by Windfield Holdings, which is 51% Tianqi Lithium Energy Australia and 49% Albemarle. IGO owns 49% of the Tianqi venture (IGO).
What lithium does IGO own?
IGO holds 49% of Tianqi Lithium Energy Australia. That venture owns 51% of Windfield Holdings, which owns Talison (Greenbushes), and it also owns the Kwinana lithium hydroxide refinery. Talison, not IGO, operates the mine (IGO).
Which lithium mines in Western Australia are closed or idle?
Mt Cattlin has been on care and maintenance since 2025. Bald Hill and the Ngungaju plant at Pilgangoora were idle from December 2024 and have both restarted in 2026 (DMPE, MinRes).
Where can I download a list or map of mines in Western Australia?
Use the Operating Mines dataset on data.wa.gov.au for a downloadable map layer, MINEDEX for the full database and PDF reports, and Table 13 of the Statistics Digest for a printable list of principal projects. See the section on the official map above for the links.
How many mines are there in Western Australia?
The State counted 139 principal mining projects in 2024-25, of which 65 were gold and 8 lithium. Smaller operations and quarries add to the total.
What is mined in Western Australia?
By value in 2024-25: iron ore A$121.5 billion, gold A$29.2 billion, alumina A$8.2 billion, lithium A$4.3 billion and nickel A$2.1 billion, with copper, zinc, manganese, mineral sands and salt behind them (DMPE).
Which are the biggest gold mines in Western Australia?
In the table, Northern Star’s Kalgoorlie centre (which includes the Super Pit) sold 844,333 oz in the year to June 2026, Newmont’s Boddington produced 565,000 oz in calendar 2025 and Northern Star’s Yandal centre sold 433,768 oz in FY26. These are different periods and groups of mines, and several operators in the table have no figure here, so this is not a ranking of all Western Australian gold mines.
How much lithium does Western Australia export?
These are state figures. Western Australia sold 3.85 million tonnes of spodumene concentrate worth A$4.3 billion in 2024-25, and 94.5% of those exports by value went to China. For the national total, the USGS estimates Australia mined 92,000 tonnes of lithium content in 2025 (DMPE, USGS).
Is the royalty on lithium different from gold?
Yes. Concentrate is under the general 5% rate unless a State Agreement says otherwise, while gold pays 2.5% with the first 2,500 ounces a year exempt (WA mineral royalties fact sheet).
This page is for information only. It is not investment advice or legal advice. Company names and output figures are facts, not recommendations. Ownership, status and royalty terms change; confirm them with the company, the regulator (DMPE) and the relevant State Agreement. Satellite results are exploration targets that sit ahead of a resource estimate. Prospecting needs the permission of the tenement holder and the regulator, and mercury must never be used.
Farmonaut mining
Screen ground in Western Australia from space
Request a quote to screen a tenement with satellite data and get ranked exploration targets, ahead of a resource estimate.

Mining Pro sample view, synthetic data
Keep reading
Sources
- DMPE (Government of Western Australia), Western Australian Mineral and Petroleum Statistics Digest 2024-25: wa.gov.au
- IGO, Quarterly Report for the period ended 30 June 2026 (ASX, 28 July 2026): announcements.asx.com.au
- PLS Group, June 2026 Quarterly Activities Report (ASX, 30 July 2026): announcements.asx.com.au
- Mineral Resources, Q4 FY26 quarterly activity report (July 2026): mineralresources.com.au
- Wesfarmers, Mt Holland lithium expansion final investment decision (ASX, 22 July 2026): announcements.asx.com.au
- Northern Star Resources, June 2026 Quarterly Report (ASX, 29 July 2026): announcements.asx.com.au
- Newmont, Q4 2025 Operating Statistics: s24.q4cdn.com
- Government of Western Australia, Mineral Royalties in Western Australia fact sheet (1 September 2025): wa.gov.au
- data.wa.gov.au, Operating Mines dataset (MINEDEX extract): catalogue.data.wa.gov.au
- Government of Western Australia, Access Mines and Mineral Deposits (MINEDEX): wa.gov.au
- USGS, Mineral Commodity Summaries 2026: Lithium: pubs.usgs.gov
- Liontown, FY26 results announcement (ASX, 31 August 2026): announcements.asx.com.au
- NS Energy, Kathleen Valley Lithium Project: nsenergybusiness.com
- EPA Western Australia, Earl Grey Lithium Project: epa.wa.gov.au
- Global Mining Review, MinRes commences preliminary development works at Mt Marion (April 2024): globalminingreview.com
- Mining Technology, Bald Hill Lithium-Tantalum Mine: mining-technology.com
- Mining Technology, Mt Cattlin Lithium Project: mining-technology.com
Discussion
Questions, corrections or field experience? Share them below. First-time comments are reviewed before they appear, and your email is never published.
No comments yet. Be the first to add a question or your experience.

 Qader Group
 Ileys General Trading
 SG Gold Mining LLC
 VRV Global Pte Ltd
 Omsri International FZE
 G.I.T.T.
 Jaunita Erss Ltd
 Almosi SARL
 SRK Consulting
 Berks Gold Limited
 Mwerezi Minerals Company Limited
 Mining SARL
 SenGold Invest SAS
 Sean Mining Limited
 NTS Group (Pty) Ltd
 Mine4Africa
 Lithspo Minerals Limited
 Tintina Mining Group

 Licence holder · Nigeria · Gold + lithium










