

Wheat Supply Chain Risks and What Grain Forecasts Show
Reviewed September 2026 against USDA Economic Research Service, USDA National Agricultural Statistics Service, and FAO Food Outlook.
Try it: Run your own numbers →
Wheat and Grain Supply Chain: The Short Answer
U.S. wheat farm prices have fallen from $5.01 per bushel in January 2026 to a USDA Economic Research Service forecast of $6.50 per bushel for the 2026/27 marketing year — a projection, not a spot price, and one that moves every month the ERS updates its Wheat Outlook. Global wheat trade volume is down 9% year-over-year in 2025/26 versus 2024/25, according to FAO and USDA WASDE data, which is the supply chain story hiding behind the price story: fewer bushels are moving across borders even as demand holds. If you searched for grains forecasts, wheat market trends, or wheat supply chain risk, those two data points are the anchor for everything below — and unlike an AI summary of the topic, every figure here comes with its source and its refresh date so you can check whether it has moved since.
This article covers what actually changed in the wheat and grain supply chain, why trade volume is contracting, what that means for financing risk further down the chain, and how to pull the current numbers yourself instead of relying on a stale forecast.




U.S. Wheat Farm Prices: The Numbers Behind the Trend
Two figures anchor the current U.S. wheat price picture, and they are not the same kind of number, so don’t average them. USDA NASS recorded a U.S. wheat farm price of $5.01 per bushel for January 2026 — that’s an observed monthly figure from actual sales. Separately, the USDA Economic Research Service’s Wheat Outlook projects a season-average farm price of $6.50 per bushel for the 2026/27 marketing year — a forward-looking forecast built from expected production, export demand, and ending stocks, not a price anyone has actually received yet.
The gap between the two — roughly $1.49 per bushel — reflects the ERS’s expectation that prices firm up over the 2026/27 marketing year as global wheat trade volume contracts (see the trade section below) and U.S. exportable supply competes for a smaller pool of import demand. Whether that plays out is exactly what next month’s NASS release and the next monthly WASDE report will show.
- Where to check the current NASS figure: USDA NASS Quick Stats, searching “wheat” then “price received,” at USDA NASS. NASS releases agricultural prices monthly.
- Where to check the current ERS forecast: the USDA Economic Research Service Wheat Outlook, published monthly, at USDA ERS Wheat Outlook.
- Where to check global stocks-to-use: the monthly WASDE report, released around the 10th of each month, at usda.gov/oce/commodity/wasde.
This is the durable method behind this article’s headline number, not just the number itself: any time you need the current U.S. wheat price, pull the latest NASS monthly release for the observed figure and the latest ERS Wheat Outlook for the forward season-average forecast, and treat the difference between them as the market’s implied view of where prices are headed.
Milling-grade wheat has its own outlook, and USDA forecasts for milling wheat track prices, yields and supply for that class.

Grains Forecasts Comparison: Price, Trade, and Supply Balance
The table below is the kind of structured comparison an AI Overview typically strips out in favor of a single sentence. Keep it as a reference point: three figures, three periods, three sources, side by side.
| Metric | Figure | Period | Source |
|---|---|---|---|
| U.S. wheat farm price (observed) | $5.01/bushel | January 2026 | USDA NASS |
| U.S. wheat season-average farm price (forecast) | $6.50/bushel | 2026/27 marketing year | USDA ERS Wheat Outlook |
| Global wheat trade volume change | −9% year-over-year | 2025/26 vs. 2024/25 | FAO / USDA WASDE |
Each row carries its own vintage because these three figures update on different schedules — NASS monthly, ERS monthly, and FAO’s Food Outlook quarterly (January, March, June, September, November). Don’t cite this table as a single “current state” snapshot next year; pull each row from its own source link above before quoting it.


What Factors Affect Global Wheat and Corn Supply and Demand Balances
This is one of the direct questions people search, so here is a direct answer: global wheat and corn supply-demand balances move on four levers — production (weather, planted area, yield), trade policy (export quotas, tariffs, sanctions), demand (feed use, food use, biofuel mandates), and ending stocks (the buffer that absorbs shocks in any of the first three). None of these levers is measured only once a year; each one is republished on its own schedule, which is why a forecast article that names a single year goes stale within months.
- Production: driven by planted acreage and yield, both sensitive to weather in the growing season. USDA’s acreage breakdown for spring versus winter wheat in the current marketing year is published in NASS’s acreage reports — the specific split for 2026/27 was not available in the current research pass; pull it directly from USDA NASS under Quick Stats.
- Trade policy: export quotas, tariffs, and sanctions can remove tens of millions of tonnes of supply from the market inside a single marketing year. The 9% year-over-year drop in global wheat trade volume (2025/26 vs. 2024/25) reported by FAO and USDA WASDE reflects this lever more than any single production shortfall.
- Demand: feed use, food use, and biofuel mandates shift with livestock herd sizes, population, and energy policy. Corn production and price forecasts for both the U.S. and global markets are published monthly in USDA’s WASDE report; standalone corn figures were not confirmed in the current research pass for this article, so check the current WASDE release directly at usda.gov/oce/commodity/wasde for the corn supply-and-use tables.
- Ending stocks and the stocks-to-use ratio: this is the single number analysts watch most closely, because it shows how much buffer exists against the next shock. USDA publishes updated global wheat stocks-to-use forecasts in every monthly WASDE report.
That four-lever framework is the durable part of this section — it doesn’t expire when the numbers behind it change. Whatever the current wheat or corn balance looks like when you’re reading this, checking each of those four levers against the latest WASDE and NASS releases will tell you why.
Grain Supply Chain Logistics: The Fifth Lever
- Beyond the four supply-and-demand drivers above, the physical grain supply chain — storage, transport, and fleet coordination — determines whether grain actually reaches the port or mill on schedule once it’s harvested. Delays or breakdowns at this stage compound a tight supply-demand balance into an actual regional shortage.
- Tools that streamline agricultural fleet management reduce the logistics-side risk in the grain supply chain — a separate problem from the production-side risk covered above, but one that matters just as much when trade volumes are already down 9% year-over-year.
- Blockchain-based product traceability addresses a third layer: verifying that grain moving through the chain is what it’s claimed to be, which matters increasingly to corporate buyers and food brands sourcing under sustainability or origin commitments.

Wheat Trade Volume: Why Grain Supply Chains Are Tightening
The 9% year-over-year decline in global wheat trade volume for 2025/26 versus 2024/25 — reported by FAO’s Food Outlook and cross-referenced against USDA’s WASDE — is the clearest supply chain signal in this dataset. A drop in trade volume, distinct from a drop in production, means less wheat is crossing borders even where production holds up. That can come from importing countries drawing down domestic stocks instead of buying, exporting countries restricting outbound shipments, or freight and financing costs pricing some trade flows out of the market.
For a reader tracking wheat market trends rather than wheat production trends specifically, trade volume is often the more useful number to watch month to month, because it moves faster than production figures (which only update meaningfully at planting, mid-season, and harvest) and it’s a direct read on how tight the physical supply chain actually is.
- Where to check the current trade figure: FAO’s Food Outlook, updated quarterly, at FAO Food Outlook, June 2025, cross-checked against the trade tables in the current month’s WASDE.
Agricultural Supply Chain Finance Risks
Rising input costs and a tighter trade environment don’t stay contained to the price of grain — they show up next in how the supply chain gets financed. Agricultural lenders and researchers have flagged rising financing costs across operating lines of credit as a growing pressure point for grain handlers, processors, and farm operations carrying working-capital debt through a season where trade volume is down 9% and prices are more volatile than the headline forecast suggests.
- A specific, quantified interest-rate benchmark for agricultural operating lines of credit was not confirmed in the current research pass — qualitative reporting of rising rates exists, but a standalone percentage figure was not available to cite here. For the current cost of agricultural credit, check FarmMac’s lending analysis directly.
- Similarly, a quantified markup for supply chain financing (the premium charged over base rates for grain trade finance specifically) was not available in this research pass. If this is decision-relevant for your operation, ask your agricultural lender for the current spread over prime or SOFR on operating and trade-finance lines — that spread is the actual number to track, and it will not sit still.
- Satellite-based crop verification is one of the few levers that directly reduces this financing risk at the source: it cuts fraud and reduces the diligence lenders need to do before extending operating credit or insurance-backed loans, which can translate into better terms for verified operations even while headline rates are rising.
This is a case where honesty about the gap matters more than a plausible-sounding number: interest rates and financing spreads are precisely the kind of figure that goes stale within weeks, so the right move for a reader making a real financing decision is to pull the current rate from their own lender or from FarmMac’s published lending analysis, not from any article.
Read local grain price tracking for how these national figures translate to your local market.
Wheat Margin Calculator
Use the calculator below to check your own margin against the current NASS observed price and ERS forecast price cited above — plug in your own yield, acreage, and cost per acre rather than relying on a national average.
Run your own numbers
Assumptions: uses a flat price and yield you enter (no basis, drying, or storage deductions); does not model crop insurance indemnities, hedging positions, or input cost inflation over the season. Update the price field with the current NASS or ERS figure from the sections above before relying on the result.
Building Resilience Into the Wheat Supply Chain
Given a 9% contraction in global wheat trade volume and a wide gap between observed and forecast prices, the operational question for anyone in the grain supply chain — grower, elevator, processor, or buyer — is how to reduce exposure to the next shock rather than just react to the last one. Three levers show up repeatedly in the data above:
- Verified crop condition data reduces uncertainty in lending and insurance decisions, which matters more when financing costs are already under pressure (see the finance section above).
- Fleet and logistics coordination reduces the chance that a tight trade environment turns into a missed shipping window, compounding a 9% trade-volume contraction into a larger local shortfall.
- Traceability supports buyers who need to verify origin and handling before committing to long-term purchase contracts in a market where supply is less predictable than it was.
None of these levers changes the weather or trade policy. What they do is shrink the gap between what the forecast says and what actually reaches the buyer — which is the entire point of tracking a supply chain rather than just a price.
How Satellite Monitoring Feeds Better Grain Forecasts
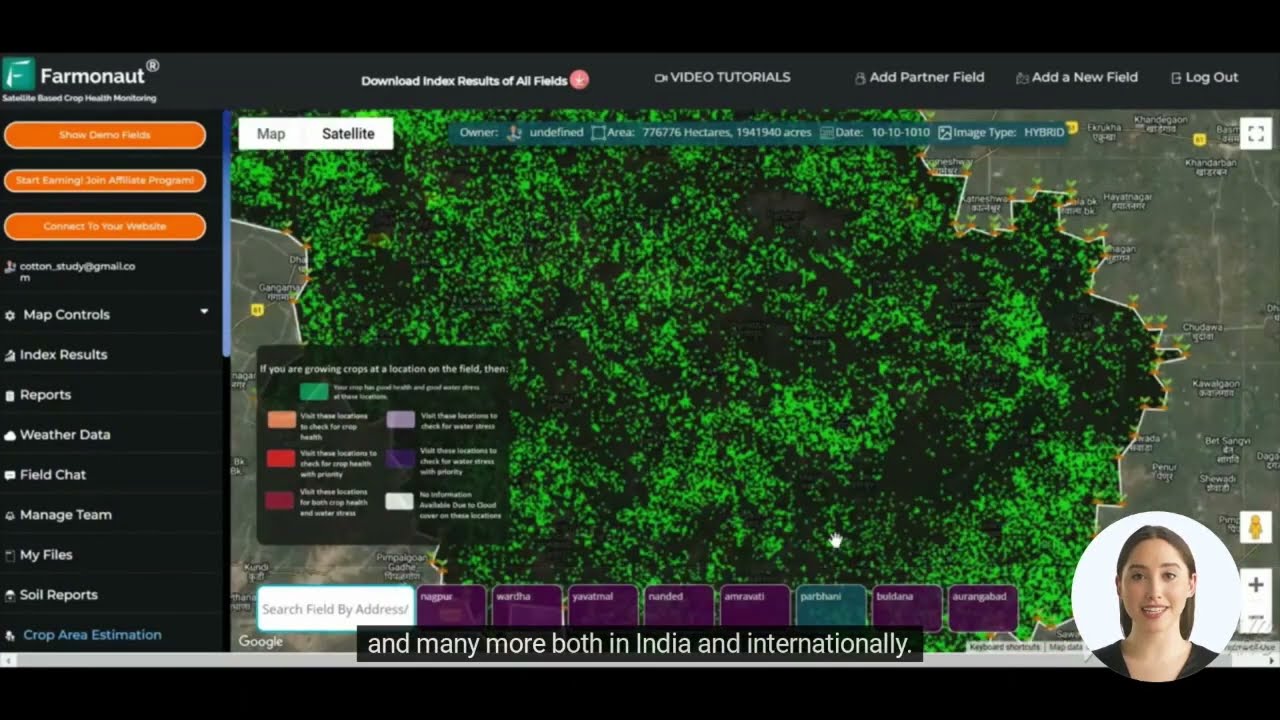
National-level forecasts like the ERS Wheat Outlook and FAO’s Food Outlook are built from aggregated data — acreage surveys, weather models, trade statistics. Farmonaut’s role sits underneath that layer, at the level of an individual field or fleet of fields, where satellite imagery can flag a yield problem weeks before it shows up in a national statistic.
- Satellite-based crop health monitoring: multispectral imagery tracks vegetation health, soil moisture, and stress indicators in near real time, which feeds directly into irrigation, fertilizer, and pest-management decisions at the field level.
- Jeevn AI advisory: combines weather, crop stage, and historical trends into specific management guidance, rather than a generic seasonal outlook.
- Carbon and sustainability tracking: carbon footprint tracking supports the sustainability commitments increasingly attached to grain supply contracts.
- Developer access: the Farmonaut API and its developer documentation let agritech teams and researchers pull satellite and weather data directly into their own forecasting or risk models, rather than relying on national aggregates alone.
- For crop yield, irrigation, and health risk advisory at the field or farm level, see the Farmonaut Crop Plantation and Forest Advisory platform.
Farmonaut Subscriptions: Field-Level Data to Pair With National Forecasts
Choose a plan to add satellite monitoring, AI advisory, and field-level yield tracking on top of the national forecasts covered in this article — for individual farms, agribusinesses, and government use.
Frequently Asked Questions
What is the current U.S. wheat price?
USDA NASS recorded $5.01 per bushel for January 2026 as the observed farm price. Separately, USDA ERS forecasts a $6.50 per bushel season-average price for the 2026/27 marketing year. Check NASS Quick Stats for the latest observed monthly figure and the ERS Wheat Outlook for the current forward forecast, since both update monthly.
What factors affect global wheat and corn supply and demand balances?
Four levers: production (weather, acreage, yield), trade policy (export quotas, tariffs), demand (feed, food, and biofuel use), and ending stocks (the stocks-to-use ratio published monthly in WASDE). A fifth, logistics-level factor — storage and transport capacity — determines whether that balance actually reaches the market on schedule.
Why is wheat trade volume falling?
Global wheat trade volume is down 9% year-over-year for 2025/26 versus 2024/25, per FAO and USDA WASDE data. This reflects some combination of importers drawing on domestic stocks, export-side restrictions, and higher freight and financing costs — check the current WASDE trade tables to see which factor is dominant now.
What are agricultural supply chain finance risks right now?
Reporting from agricultural lenders points to rising costs on operating lines of credit as a real pressure on grain-chain participants, though a specific quantified rate was not available in the current research pass. Ask your lender for the current spread on operating and trade-finance lines, and check FarmMac’s published lending analysis for sector-wide trends.
How does satellite monitoring improve grain forecasting?
Satellite imagery and AI-based advisory (as with Farmonaut) assess crop health at the field level in near real time, catching stress signals weeks before they show up in national acreage or yield statistics — useful for individual planting, irrigation, and marketing decisions that a national forecast can’t inform on its own.
Further reading:
Conclusion: Tracking the Forecast, Not Just Reading It
The headline numbers in this article — $5.01 per bushel observed in January 2026, a $6.50 per bushel forecast for 2026/27, and a 9% drop in global wheat trade volume — will all have moved by the time you’re reading this, because that’s how NASS, ERS, and WASDE are designed to work: monthly and quarterly republication, not a fixed annual snapshot. The method matters more than the specific figures: check NASS for the observed price, ERS for the forward forecast, WASDE for stocks-to-use and trade volume, and FAO’s Food Outlook for the global trade picture, on the schedule each publishes.
- Pair the national-level forecast with field-level data where you can get it — that’s the gap between knowing the market moved and knowing why your operation specifically is exposed.
- Treat financing risk as a live, lender-specific number to check directly rather than a headline rate to assume.
- Use the calculator above with your own yield, acreage, and cost figures rather than a national average margin.
Discussion
Questions, corrections or field experience? Share them below. First-time comments are reviewed before they appear, and your email is never published.
No comments yet. Be the first to add a question or your experience.

 John Deere
 Progenseed
 SkyHarvest
 Polaris Digitech
 Teledarbas
 Wild Oak Farm
 SFX
SFX BACF Africa
 Doodlakine
 Exurbia Geospatial
 FieldZero
 Indico Company
 Kubota
 Licence holder · Niger · Gold










