

Food security · Evidence guide
Sustainable Agriculture Solutions for Food Security
FAO estimates 673 million people faced hunger in 2024 and 645 million in 2025. Seven sustainable agriculture solutions, with dated figures from FAO, UNEP and USDA, four charts and a calculator for post-harvest loss.
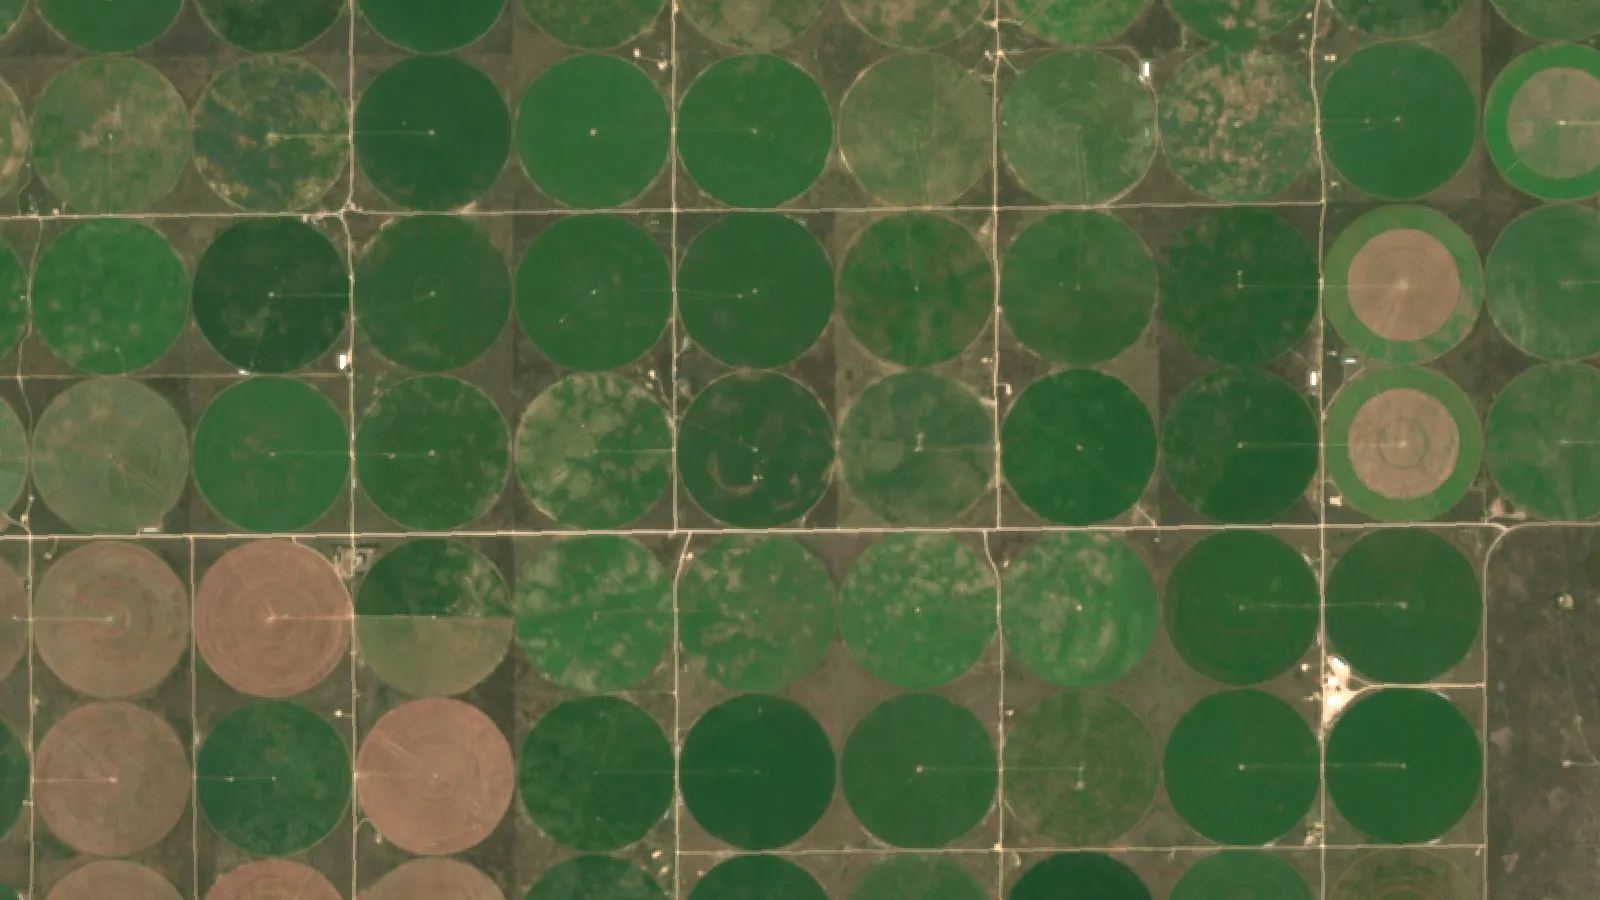
Key takeaways
- FAO’s SOFI 2025 puts hunger at 673 million people in 2024 (8.2%), and SOFI 2026 estimates 645 million for 2025. In the 2025 edition, hunger kept rising in most subregions of Africa and western Asia.
- Conservation agriculture raised sub-Saharan African yields by 3.7% on average, and 8.4% for maize when all principles were used together (Nature Food, 2020); herbicide use may rise, so follow the label..
- 13.3% of food, tracked through a basket of main commodities, was lost between harvest and retail in 2023 (FAO), and 1.05 billion tonnes, 19% of food available to consumers, was wasted in 2022 (UNEP).
- More than 3 million hectares of Niger’s agroforestry parklands have been revegetated since the 1980s, with farmer-managed natural regeneration a main method.
- Family farms produce about 80% of food by value, while farms under two hectares produce roughly 35% (FAO, 2021).
In this article
- Sustainable agriculture solutions at a glance
- Why food security is still at risk
- How we chose and checked these solutions
- 1. Agroforestry: trees on farmland
- 2. Climate-smart and soil-saving practices
- 3. Farmer-managed natural regeneration
- 4. Sustainable forest management
- 5. Precision agriculture and better farm management
- 6. Cutting food loss and waste
- 7. Policy and support for family farming
- How satellite data supports these solutions
- Which solution fits which farm
- What farmers and food businesses can do first
- FAQ
The best sustainable agriculture solutions for food security are the ones that raise or protect food supply on land already farmed: trees on cropland, climate-smart and soil-saving practices, restored farmland trees, precision tools, less food lost after harvest and stronger support for family farms. FAO’s 2025 report estimates that 673 million people faced hunger in 2024, and its 2026 edition puts the figure at 645 million for 2025.
This guide goes through seven solutions with dated figures from FAO, the UN Environment Programme, USDA and peer-reviewed studies. It shows where each one helps, where the evidence is weaker, and gives a calculator for testing what a cut in post-harvest loss is worth on your own harvest. Always read local rules before changing fertilizer, pesticide or water use.
Sustainable agriculture solutions at a glance
The table sums up the seven solutions. Each has its own section below with the source behind it.
| Solution | Problem it tackles | Evidence in this guide | Who acts |
|---|---|---|---|
| 1. Agroforestry | Soil loss, heat and drought stress | 43% of farmland had at least 10% tree cover in 2010 (Sci Rep, 2016) | Farmers, land managers |
| 2. Climate-smart practices | Low yields, soil decline, climate risk | Conservation agriculture raised African yields by 3.7% on average; it may rely on herbicides, so follow the label (Nature Food, 2020) | Farmers, extension services |
| 3. Natural regeneration | Degraded dryland fields | More than 3 million ha regreened in Niger since the 1980s (PMC review) | Smallholders, communities |
| 4. Forest management | Forest loss that cuts food and income | Forests cover 4.14 billion ha, 32% of land (FAO FRA, 2025) | Governments, forest owners |
| 5. Precision farming | Wasted inputs, uneven fields | Auto-steer on 58% of US corn acres in 2016 (USDA ERS, 2023) | Farmers, advisers |
| 6. Less food loss and waste | Food that never reaches a plate | 13.3% of main commodities lost before retail in 2023; 19% of food wasted at retail, food service and home in 2022 (FAO, UNEP) | Farmers, traders, households |
| 7. Support for family farms | Low investment and weak markets | About 80% of food by value comes from family farms (FAO, 2021) | Governments, lenders |
Why food security is still at risk
Food security means that all people have enough safe, nutritious food at all times. It rests on four pillars: availability, access, use and stability. A shock to any one of them, such as drought, conflict or a price spike, can undo progress on the others.
Each solution in this guide protects at least one pillar. Agroforestry, climate-smart practices and natural regeneration support availability by keeping soil productive. Precision tools and loss reduction raise availability from the same land. Family-farm support improves access, because income and credit decide who can buy or grow food. Stable supply needs all of these, plus storage and fair trade rules.
The numbers moved the right way recently, but unevenly. FAO’s 2025 report found that 8.2% of the world’s people, about 673 million, faced hunger in 2024, down from 8.5% in 2023 and 8.7% in 2022, according to the FAO release on SOFI 2025. Hunger kept rising in most subregions of Africa and western Asia. The same release counts 2.3 billion people, 28.0% of the world, in moderate or severe food insecurity in 2024.
The 2026 edition of the report estimates that 645 million people faced hunger in 2025 and that a healthy diet is out of reach for about 2.7 billion people. FAO says global hunger and food insecurity remain far above the targets of the 2030 Agenda.
Cost matters as much as supply. SOFI 2025 reports that food price inflation peaked at 13.6% in January 2023, and that the number of people unable to afford a healthy diet fell from 2.76 billion in 2019 to 2.60 billion in 2024 but rose in low-income countries. The report recommends targeted social protection, steady monetary policy, and investment in agrifood research, transport and market information to help raise productivity and resilience.
Chart
People facing hunger by region, 2024
millions of people, SOFI 2025 point estimates; three regions from the FAO release; western Asia (39 million) is part of Asia
How we chose and checked these solutions
We kept solutions that have published measurements, not only claims. Each figure below names its source and year. Where results vary by place or crop, we say so. Impact depends on soil, rainfall, farm size and cost, so treat every number as a guide, not a forecast for your farm.
1. Agroforestry: trees on farmland
Agroforestry grows trees or shrubs with crops or livestock on the same land. The trees can give fruit, nuts or timber, shade animals, slow erosion and hold water in the soil.
It is already widespread. A remote-sensing study in Scientific Reports found that in 2010, 43% of all agricultural land had at least 10% tree cover, up 2% over the previous ten years. That tells us trees and farming already share much of the world’s farmland. It does not tell us the yield effect, which depends on species, spacing and rainfall.
The USDA National Agroforestry Survey, run with the National Agroforestry Center, tracks five agroforestry practices: windbreaks, silvopasture, riparian forest buffers, alley cropping, and forest farming with multi-story cropping. Windbreaks shelter fields and animals, silvopasture pairs trees with grazing, riparian buffers protect streams, and alley cropping grows crops between tree rows.
For a farmer, the choice is local: which tree, where, and how it competes with the crop for light and water. Ask your extension service for species lists and rules on planting and harvesting trees.
2. Climate-smart and soil-saving practices
Climate-smart agriculture, as FAO describes it, aims to raise productivity and income, build resilience to climate change and, where possible, cut emissions. In practice that means practices such as cover crops, reduced tillage, crop rotation, better water management and drought-tolerant varieties. FAO’s climate-smart agriculture sourcebook says agricultural production may have to rise by 60% by 2050 to meet expected demand for food and feed.
The yield evidence is mixed, which is why you should test practices on a small area first. A meta-analysis of 933 observations from 16 sub-Saharan African countries found that conservation agriculture raised average yields by only 3.7% across six major crops and 4.0% for maize. When all its principles were applied together, maize yields rose 8.4%. The biggest gains came in low-rainfall conditions. Reduced tillage often shifts weed control to herbicides, so follow the product label and local rules.
Cover crops show a clearer yield signal in US data. The Sustainable Agriculture Research and Education (SARE) program reports, from a national cover crop survey, that farmers saw a 3% rise in corn yield and 4.9% in soybeans after five straight years of cover crops, and larger gains of 9.6% and 11.6% in the 2012 drought year. SARE also says cover crops can pay for themselves in the first year or may take a few years to give a net return, so cost and payback depend on your fields.
Nutrient management belongs in this group too. Matching fertilizer to crop need, soil tests and timing cuts loss to water and air. Our guide to soil health practices and our page on integrated nutrient management go deeper. Follow the product label and your local nutrient rules, and ask an agronomist before you change rates.
In the United States, the Census of Agriculture counted 18.0 million acres of cover crops in 2022, 17% more than in 2017. Growth has slowed: the 2017 total was 50% above 2012. Our explainer on sustainable forest management techniques covers the woodland side of climate-smart land use.
Chart
US cover crop acres, Census of Agriculture
million acres planted to cover crops, 2012 to 2022; 2012 and 2017 derived from the stated changes
3. Farmer-managed natural regeneration
Farmer-managed natural regeneration (FMNR) means protecting and pruning the tree stumps and seedlings that already grow in a field, instead of planting new ones. Farmers do the work themselves, so the main inputs are labour and know-how.
The best-known case is Niger. A review of dryland restoration notes that in Niger’s agroforestry parklands more than 3 million hectares have been revegetated since the 1980s, and that FMNR in Niger, Burkina Faso, Mali, Senegal and Ethiopia has been linked to more tree cover, more soil carbon and higher crop yield and household income. The review also says land scarcity often rules out simply leaving fields to recover, which is why on-farm methods matter.
The evidence above comes from dryland systems, so results elsewhere may differ. Check local forestry rules on who owns trees on your land.
4. Sustainable forest management
Forests supply wood, fuel, wild foods and water, and they protect soil. FAO’s Global Forest Resources Assessment 2025 estimates that forests cover 4.14 billion hectares, 32% of the world’s land, about 0.50 ha per person. Forests are not spread evenly: 45% are in the tropics and 28% in the boreal zone.
Sustainable management means setting harvest limits, planting or allowing regrowth, and watching for illegal clearing. Satellites help with the last part. Our guide to tools to supervise deforestation lists the methods used to spot clearing.
5. Precision agriculture and better farm management
Precision agriculture uses maps and sensors to put seed, water and fertilizer where the crop needs them. It is common in some US crops. A USDA Economic Research Service report found that auto-steer was used on 58% of planted US corn acres in 2016, up from 5.3% in 2001. Yield maps, soil maps and variable-rate tools were used on only 5% to 25% of the acreage of winter wheat, cotton, sorghum and rice.
The same report shows adoption differs by crop and farm size, so the gains are not automatic. Start with a low-cost step such as a yield map or a satellite vegetation map of each field, then act on what it shows. A vegetation map shows where plants differ, not why, so walk the field before you spend money.
Farmonaut Satellite + AI Farm Monitoring System draws satellite vegetation maps for fields you outline, on web, Android and iOS. Our overview of the technologies farmers actually use compares options, and how farm IoT systems work explains sensors.
▶ Six plain steps to start precision farming, from field maps to satellite monitoring. · 4:18
6. Cutting food loss and waste
This adds food without new land, because the crop is already grown. FAO’s SDG 12.3.1 indicator estimates that 13.3% of food, tracked through a basket of main commodities, was lost between harvest and retail in 2023, up slightly from 13.0% in 2015. FAO says there is no apparent progress since 2015. Loss differs by region and by crop, as the chart shows.
Chart
Where retail and home food waste happens
million tonnes wasted in 2022, three sectors
Waste at retail and home is separate. The UN Environment Programme’s Food Waste Index Report 2024 found that 1.05 billion tonnes of food were wasted in 2022, 19% of food available to consumers. Households accounted for up to 60%, or 631 million tonnes. The report names Japan (18% less waste) and the UK (31% less) as examples of reductions.
On the farm, losses come from late harvest, rough handling, poor drying and storage, and slow transport. Fruit and vegetables lose the most: FAO puts their loss at 25.4% in 2023, against 8.4% for cereals and pulses. Cooling, clean containers and shorter routes to market are the usual fixes. Follow the label and local food safety rules for any storage treatment.
To find where your own losses happen, follow the crop in order:
- Weigh the crop at harvest, at storage and at sale, and note the gaps.
- Record damage, spoilage and rejected loads, with the reason for each.
- Fix the largest gap first, such as drying, cooling or crates.
- Measure again at the next harvest and compare.
FAO also publishes guidelines on measuring harvest and post-harvest losses for grains, pulses, and fruit and vegetables, which can help larger operations and cooperatives set up the same check.
Chart
Share of main commodities lost between harvest and retail
percent lost, selected regions and world, 2015 vs 2023
Try the numbers for your own farm below.
Calculator
What would a cut in post-harvest loss be worth?
Enter your own harvest, loss rates, price and the yearly cost of the fix.
- Value of saved food (US$): $7,500
- Net of yearly cost (US$): $500
- Break-even loss cut: 2.80 points
Example values only, not a benchmark or a forecast; the global figure of 13.3% (FAO, 2023, a basket of main commodities) is shown for reference and is not your farm’s rate. Price is an example, use today’s price from your buyer. Loss is measured as a share of harvested tonnes. Cost covers storage, cooling or handling changes per year.
7. Policy and support for family farming
Family farms are central to food supply. FAO’s 2021 research estimates there are more than 608 million family farms, producing around 80% of the world’s food in value terms. Farms under two hectares, which are five of every six farms, produce roughly 35% of food and use about 12% of farmland. The share from small farms ranges widely by country.
That is why finance, insurance, advice and secure land rights for family farms are food security policy, not only farm policy. The UN Decade of Family Farming runs from 2019 to 2028. Our page on crop loan and insurance explains how field records can support a credit application. Talk to a licensed lender or adviser before you borrow or insure. FAO’s 2021 work also warns that data on production by farm size exist for very few countries, so national policies often rely on rough estimates.
▶ Six benefits of mixing crops and livestock on one farm. · 2:55
How satellite data supports these solutions
Several of the seven solutions need a way to see change across land. Satellite images show vegetation and bare ground at field scale, so a farmer or forester can compare one week with the next, spot a weak patch, or check that regrown trees are spreading. A vegetation map shows that something changed, not the cause, so pair it with a field visit and local advice.
Every solution has a price and a catch. Trees on cropland can shade a crop or draw on the same water, so spacing and species matter. Conservation agriculture can help yields only slightly in some African trials, and gains came mainly where several principles were combined. Cover crops cost seed and labour in the first years. Natural regeneration needs patience and clear rules on who owns the trees.
Precision tools cost money to buy or subscribe to, and they pay off only when the farmer acts on the data. Storage and cooling need power and upkeep. Policy support depends on budgets and on the quality of local data. For these reasons, compare the full yearly cost against the yield or loss you expect, as the calculator above does for loss, and start small.
Which solution fits which farm
No single practice fits every place. The table gives a starting point, based on the evidence above.
| Your situation | Start with | Why |
|---|---|---|
| Dry cropland, low yields | FMNR, mulch, rotation | Gains were largest in low rainfall (Nature Food); herbicide label rules apply |
| Large row-crop fields | Yield maps, satellite scouting | Wide adoption on US corn (USDA ERS) |
| Fresh produce grower | Cooling and handling | Highest loss rate, 25.4% (FAO) |
| Mixed crop-livestock farm | Trees, manure, rotation | Spreads risk across enterprises |
| Cooperative or lender | Shared storage, records | Family farms need finance (FAO) |
What farmers and food businesses can do first
- Measure your own post-harvest loss for one season, from field to buyer.
- Test one soil-saving practice on a small block before you scale it.
- Keep field records, such as yield, inputs and weather, so you can compare changes year to year.
- Ask your extension office which trees, cover crops and varieties suit your area.
- Follow the product label and local rules for fertilizer and pesticide, and get professional advice for financial or legal decisions.
The video below explains seven easy soil and water habits in plain language.
▶ Seven simple ways to protect soil and water, explained in plain language. · 4:34
FAQ
What are sustainable agriculture solutions?
They are farming and food-system practices that protect soil, water and trees while keeping food supply steady. Examples are agroforestry, cover crops, reduced tillage, precision tools and storage that cuts post-harvest loss. The right mix depends on your climate, soil and market.
How many people are hungry in the world?
FAO’s SOFI 2025 estimates 673 million people faced hunger in 2024, and SOFI 2026 estimates 645 million for 2025. The ranges around these estimates are wide, so FAO also gives them as intervals.
Does sustainable farming raise yields?
Sometimes. A meta-analysis in Nature Food found conservation agriculture raised African yields by 3.7% on average, and 8.4% for maize when all principles were used together. Results vary by crop and rainfall.
How much food is lost or wasted?
FAO estimates 13.3% of food, tracked through a basket of main commodities, is lost between harvest and retail (2023), and UNEP estimates 19% of food available to consumers was wasted in 2022. The two figures cover different stages and use different bases (a basket of main commodities versus all food available to consumers), so do not add them together.
Are small farms important for food security?
Yes. FAO estimates family farms produce about 80% of food by value, and farms under two hectares produce roughly 35% of food. The role of small farms varies by country.
Can satellite data help with sustainable farming?
It can show where vegetation differs across a field, so you know where to scout. It does not name the cause, so check the field before acting.
Related pages on our site
Related pages on our site: food traceability, farm carbon footprint tracking, farm fleet and resource management, large-scale farm management app, satellite data API, weather API developer docs, crop and forestry monitoring, land restoration after mining.
Farmonaut crop monitoring
See your own fields from space
Outline your fields once and Farmonaut shows satellite vegetation maps for them through the season, on web, Android or iOS.




Keep reading


Sources
- FAO, Hunger declines globally but rises in Africa and western Asia (SOFI 2025 release, 2025): fao.org
- FAO, The State of Food Security and Nutrition in the World (SOFI 2026 page): fao.org
- FAO, SDG indicator 12.3.1 Global food losses (data portal, 2023 estimates): fao.org
- UN News, report on UNEP Food Waste Index Report 2024 (2024): news.un.org
- Zomer et al., Global tree cover and biomass carbon on agricultural land, Scientific Reports (2016): pmc.ncbi.nlm.nih.gov
- Corbeels et al., Limits of conservation agriculture in sub-Saharan Africa, Nature Food (2020): nature.com
- FAO, Climate-smart agriculture sourcebook, executive summary (2013): openknowledge.fao.org
- farmdoc daily, University of Illinois, Cover crops in the 2022 US Census of Agriculture (2024): farmdocdaily.illinois.edu
- Drivers of farmer-managed natural regeneration in the Sahel, review in PMC: pmc.ncbi.nlm.nih.gov
- FAO, Global Forest Resources Assessment 2025, forest extent and change: openknowledge.fao.org
- USDA ERS, Precision Agriculture in the Digital Era, EIB-248 (2023): ers.usda.gov
- FAO, Small family farmers produce a third of the world’s food (2021): fao.org
- SARE, Cover Crops for Sustainable Crop Rotations (national cover crop survey analysis): sare.org
- USDA NASS, National Agroforestry Survey: nass.usda.gov
Discussion
Questions, corrections or field experience? Share them below. First-time comments are reviewed before they appear, and your email is never published.
No comments yet. Be the first to add a question or your experience.

 Nale Network
 Exurbia Geospatial
 FieldZero
 Indico Company
 Kubota
 FFBS
 Jontra
 Kalustyan
 Tucor
 Geno
 Hayleys Agriculture
 Linx Agritech
 Adinet
 Save Your Soils

 Licence holder · Niger · Gold










