

Lentil Market 2026: Prices, Supply Outlook & Shortage Facts
Reviewed March 2026 against USDA Agricultural Prices (NASS), USDA FSA, and Saskatchewan Pulse Growers.
Try it: Enter values above to calculate. →
US farmers received $21.80 per hundredweight (cwt) for lentils in March 2026, according to USDA’s Agricultural Prices report — a figure the department reissues every month. There is no confirmed nationwide “lentil shortage”: Canada, which supplies most of the lentils traded internationally, is forecast to produce 3.36 million tonnes for the 2025–26 season with 1.5 million tonnes left in storage at season’s end, a carryout that points to ample supply rather than scarcity. What’s actually happening is a market splitting in two — red lentil prices moving one way, green lentils another — and this article shows you exactly where each stands and how to track it yourself.
Table of Contents
- What Lentils Cost Right Now
- Is There a Lentil Shortage? The Actual Numbers
- The Trader Joe’s Lentils Question
- Global Supply: Who Grows and Exports Lentils
- Lentil Market Outlook: What Moves Prices Next
- India’s Lentil Market and Why It Matters to US Buyers
- Buying Lentils in Bulk: What Changes at Volume
- Lentil Cost Calculator
- Tracking Supply Before the Market Does
- FAQ
- Try it: Enter values above to calculate.
What Lentils Cost Right Now
The most recent official US figure is $21.80 per cwt (hundredweight, equal to 100 pounds), reported by USDA’s National Agricultural Statistics Service for March 2026 in its Agricultural Prices release. That number is the price farmers received at the farm gate — not the retail shelf price, and not a futures quote. USDA publishes this series monthly at USDA NASS Agricultural Prices; search “agpr” plus the month and year to get the current release, since a new one supersedes this figure roughly every 30 days.
Separately, USDA’s Farm Service Agency sets an Effective Reference Price for lentils of $0.2731 per pound for the July 2025–June 2026 marketing year, used as the benchmark for its Emergency Relief Program. That’s a policy floor, not a market price — it exists to calculate support payments when market prices fall below it, and it’s published in the USDA FSA Emergency Relief Program documentation. Converting the March farm price to the same unit: $21.80/cwt works out to $0.218/lb, which sits below the $0.2731/lb reference price — one reason ERP-eligible growers may see support payments this marketing year rather than a sign of runaway inflation.
On the wholesale/export side, Tridge tracks current pricing by origin — Canada, Australia, and Turkey are the three reference points international buyers watch, because pricing diverges by growing region and by color class (red vs. green vs. other lentil types). Canadian and Australian FOB quotes move independently of the US farm price above, which is why a single “lentil price” headline number is almost always incomplete — you need to know which origin and which color class it refers to. Check current wholesale quotes at Tridge’s dried lentil market overview, which updates its origin-by-origin pricing on a rolling basis.
Is There a Lentil Shortage? The Actual Numbers
No — the supply data available for the 2025–26 season points the opposite direction. Saskatchewan Pulse Growers, the industry body covering the province that grows the majority of Canada’s lentils, forecasts:
- 3.36 million tonnes of Canadian lentil production for the 2025–26 crop year
- 2.1 million tonnes forecast for export in 2025–26
- 1.5 million tonnes of carryout stock remaining at the end of the 2025–26 season
A carryout of 1.5 million tonnes against 3.36 million tonnes of production is a stocks-to-production ratio of roughly 45% — high enough that Saskatchewan Pulse Growers’ own framing is a well-supplied market, not a tight one. These figures come from the Saskatchewan Pulse Growers Canadian peas and lentils outlook, which the organization updates two to three times per growing season — check that page directly for the current revision, since forecasts made early in a season shift as harvest data comes in.
Why does a shortage narrative circulate anyway? Three things get conflated in casual reporting: (1) a temporary retail stock-out of one product at one retailer, which is a merchandising or logistics event, not a supply event; (2) red lentil pricing moving independently of green lentil pricing, which can look like “lentils are short” if you’re only watching one color class; (3) shipping and container costs from Canadian ports, which raise landed cost without reducing the tonnes available. None of those show up as a drop in the global production or export figures above.
If you want to check whether a *specific* shortage claim is current, the fastest verification path is: pull the latest Saskatchewan Pulse Growers outlook (link above) for the current season’s carryout number, and cross-check against USDA NASS’s monthly Agricultural Prices release for whether the US farm price is spiking month-over-month — a genuine supply shock shows up as a sharp, sustained price move in both, not just a headline.
The Trader Joe’s Lentils Question
Retailer-specific discontinuations are a merchandising decision by that retailer, not a market signal — Trader Joe’s rotates its private-label pulse and grain SKUs regularly, and no supply data in USDA’s or Saskatchewan Pulse Growers’ reporting shows a lentil-specific disruption that would force a national retailer to pull a product. If a specific Trader Joe’s lentil SKU is missing from your local store, the two most likely explanations are a regional distribution gap (ask the store directly — they can usually tell you if it’s a temporary out-of-stock or a permanent delist) or a seasonal reformulation of a packaged product line, which retailers don’t always announce. There is no USDA or Saskatchewan Pulse Growers data point that ties a national retailer’s shelf decision to a supply-side lentil shortage.
Global Supply: Who Grows and Exports Lentils
Global lentil production was estimated at 6.6 million tonnes for the 2024–25 season by FAO, while a broader market-volume estimate (which includes trade flows and processing) put the global lentil market at 19.5 million tonnes in 2025 per Tridge/IMARC figures — the two numbers measure different things (raw production vs. total market volume including re-trade), so don’t subtract one from the other expecting a clean balance.
Canada and Australia are the two dominant exporters:
| Country | Metric | Figure | Period | Source |
|---|---|---|---|---|
| Canada | Lentil export volume | 1.92 billion kg | 2024 | Tridge |
| Canada | Lentil production | 3.36 million tonnes | 2025–26 forecast | Saskatchewan Pulse Growers |
| Canada | Export forecast | 2.1 million tonnes | 2025–26 | Saskatchewan Pulse Growers |
| Australia | Lentil export volume | 1.34 billion kg | 2024 | Tridge |
| Australia | Lentil production (share of global) | 1.84 million tonnes (26% of global) | 2023 | FAO/Statsgeo |
| Global | Total production | 6.6 million tonnes | 2024–25 | FAO estimate |
| Global | Total market volume | 19.5 million tonnes | 2025 | Tridge/IMARC |
Canada exported 1.92 billion kg of lentils in 2024 against Australia’s 1.34 billion kg — Canada moves roughly 43% more volume than Australia in raw export terms. Both countries’ output is dominated by red and green lentil classes, and pricing between the two color classes moves independently: a tight red lentil market in one export season doesn’t necessarily mean green lentil supply is tight too, which is the segmentation Saskatchewan Pulse Growers tracks in its outlook reports.
Australia’s 1.84 million tonnes of production (2023 figure, per FAO/Statsgeo) represented about 26% of global output that year, a share large enough that a poor Australian harvest can move world prices even when Canadian supply is normal — the two exporters aren’t interchangeable buffers for each other because their harvest windows fall in different halves of the year.
Lentil Market Outlook: What Moves Prices Next
Rather than forecast a number that will be wrong within a quarter, here’s the durable checklist for reading the lentil market outlook yourself, in the order these signals typically move:
- Canadian seeding intentions (spring): Saskatchewan Pulse Growers and Statistics Canada both publish seeded-acreage estimates before planting. A shift of a few percentage points in lentil acreage versus canola, wheat, or peas is the earliest signal of the following season’s supply.
- Australian harvest results (varies by hemisphere season): Because Australia’s growing season is offset from North America’s, an Australian shortfall or surplus becomes visible on world markets before the Canadian harvest is even in.
- Saskatchewan Pulse Growers’ mid-season revisions: The outlook figures cited above (3.36 million tonnes production, 2.1 million tonnes exports, 1.5 million tonnes carryout) get revised two to three times per season as harvest and export-shipment data firm up — the current revision is always at the link above, not in this article.
- USDA’s monthly Agricultural Prices release: This is the only US farm-gate price series with an official monthly cadence; a sustained multi-month rise (not one data point) is what separates a real price move from noise.
- Container and shipping costs out of Canadian ports: These raise landed cost for importers without changing the underlying tonnage available — a rise here shows up as higher retail prices before it shows up as a supply figure anywhere.
What’s explicitly NOT available to check against, based on the current research for this piece: there is no published lentil futures contract on a major US exchange comparable to corn or wheat futures, so “lentil market outlook” searches that expect a futures-style price curve won’t find one — pricing is set through negotiated grain-company and export contracts rather than exchange-traded futures. There’s also no consolidated red/green/beluga market-share breakdown publicly available; if you need that split for a specific origin, Saskatchewan Pulse Growers’ outlook report is the closest published source, since it separates red and green lentil pricing and volume commentary.
India’s Lentil Market and Why It Matters to US Buyers
India is the world’s largest lentil consumer and a major importer, which makes Indian demand a real driver of the export volumes Canada and Australia report above — when Indian import demand rises, more of that 1.92 billion kg of Canadian exports and 1.34 billion kg of Australian exports gets routed there, tightening what’s available to other buyers even though global production hasn’t changed. This is the connective thread between “india lentil market” search interest and the North American price data covered elsewhere in this article: India functions as a demand-side variable in the same 2024 export figures already discussed, not as a separate market. US buyers and traders watching lentil commodity price movements should treat Indian import volume as one of the checklist items in the outlook section above, alongside Canadian seeding and Australian harvest data — it’s the same global export pool.
Buying Lentils in Bulk: What Changes at Volume
For buyers searching for bulk lentils — food service operators, co-ops, or households buying in volume — pricing works on a different basis than the per-cwt farm price or the per-pound retail shelf price. The wholesale/export prices tracked by Tridge (linked above) reflect large-lot, origin-specific pricing (by the tonne, FOB a Canadian, Australian, or Turkish port), which is the basis that actually determines what a bulk distributor pays before markup, packaging, and freight are added. A few practical differences at bulk volume:
- Color class matters more, not less. Because red and green lentils price separately (see the outlook section above), a bulk buyer locking in a contract should specify which class, since the two can diverge by a meaningful margin in the same season.
- Origin matters. Canadian, Australian, and Turkish lentils carry different FOB baselines per Tridge’s tracking — a bulk quote should state origin, not just “lentils.”
- Freight is a larger share of landed cost at bulk volumes than it is per retail bag, which is why the shipping-cost signal in the outlook checklist above matters disproportionately to bulk buyers.
There’s no published “bulk lentil price near me” dataset — that’s inherently local (specific distributor, specific origin, specific contract terms), so the actionable step is to request a current FOB quote referencing the Tridge benchmark above and compare it against your distributor’s markup, rather than searching for a number that doesn’t exist as a national retail figure.
Lentil Cost Calculator
Use the figures above to estimate your own landed cost per pound, starting from either the USDA farm price or a bulk FOB quote you’ve obtained, plus your actual freight and markup.
Enter values above to calculate.
Assumptions: converts your entered base price to a per-pound figure, adds flat freight/handling per pound, then applies a percentage markup. It does not account for color-class price differences, contract minimums, or origin-specific duties — use a real quote for a purchasing decision.

Tracking Supply Before the Market Does
Everything in the outlook checklist above — seeded acreage, in-season crop condition, harvest timing — is observable from satellite before it reaches a USDA or Saskatchewan Pulse Growers report, which is where a monitoring platform earns its place for anyone trading or planning around pulse crop supply rather than reading about it after the fact.
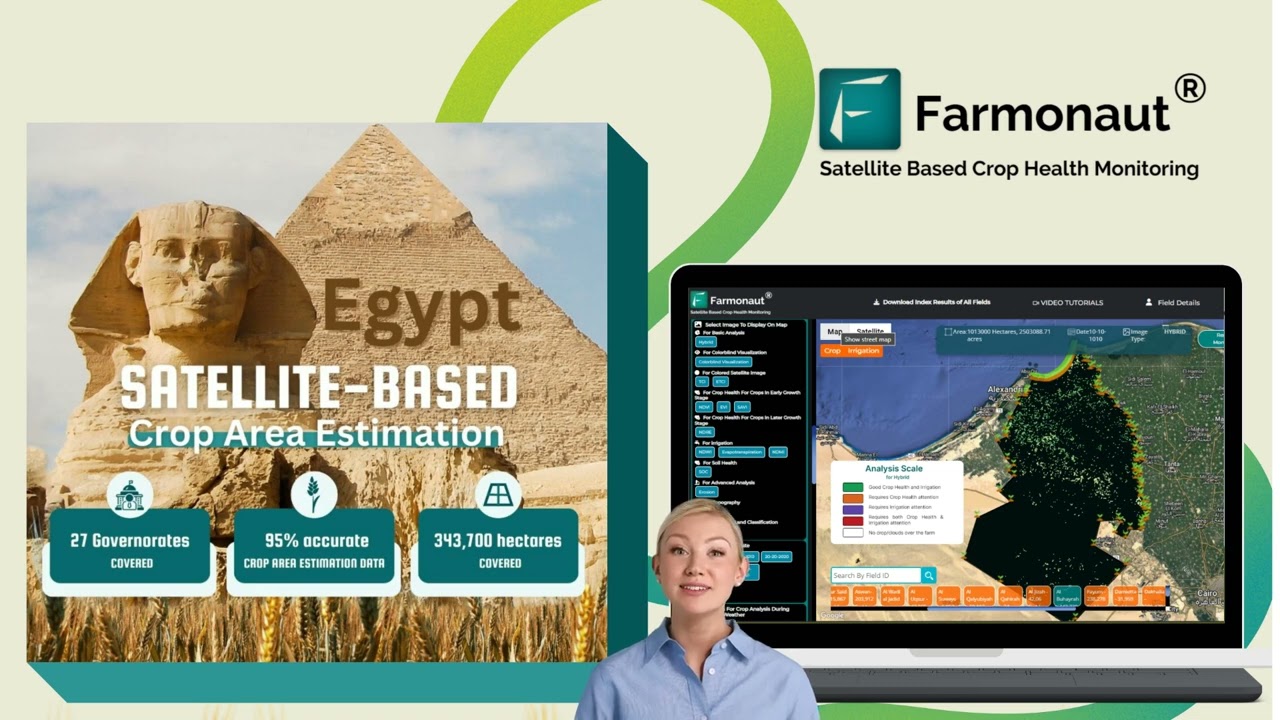
Farmonaut’s satellite-based platform gives growers and buyers three tools relevant to the supply-side questions this article covers:
- Crop area estimation: satellite-derived acreage estimates for lentils and competing rotation crops, ahead of official government acreage reports.
- Yield prediction: combines historical yield data with in-season crop health indicators to flag whether a region is tracking toward its production forecast or falling short of it.
- Weather monitoring: integrated weather data to assess in-season risk to yield before it shows up in a harvest report.
For teams that want to build these signals into their own systems rather than check a dashboard manually, Farmonaut’s satellite and weather data is available via API:
Explore Farmonaut’s API for custom integrations:
Farmonaut Satellite API
API Developer Documentation

Policy context also shapes lentil economics on the US side — the $0.2731/lb reference price cited earlier sits inside a broader system of agricultural subsidies that affects planting decisions for lentils versus competing crops. And because lentils are one line item inside a much larger traded-commodities system, background on how that system works is covered in our explainer on what agricultural commodities are.
Outside North America, smaller producers pooling resources through cooperative structures is a recurring theme in pulse markets generally — see our coverage of cooperative marketing models for how that structure changes market access for smaller growers.

Explore Farmonaut’s precision agriculture solutions:





FAQ: Lentil Market Questions Answered
Q1: What is the current lentil price?
A1: US farmers received $21.80 per cwt (about $0.218/lb) in March 2026, per USDA NASS Agricultural Prices. This is a farm-gate price, not a retail or futures price, and USDA reissues it monthly — check the latest USDA Agricultural Prices release for the current figure. Wholesale export pricing by origin (Canada, Australia, Turkey) is tracked separately by Tridge.
Q2: Is there a lentil shortage?
A2: No — Canadian carryout stocks are forecast at 1.5 million tonnes against 3.36 million tonnes of 2025–26 production, a well-supplied position per Saskatchewan Pulse Growers. Localized retail stock-outs or one country’s harvest shortfall get reported as “shortage” even when global and North American supply data don’t support that framing.
Q3: Why did Trader Joe’s discontinue a lentil product?
A3: That’s a retailer merchandising decision, not a supply-driven event — no USDA or Saskatchewan Pulse Growers data shows a lentil-specific disruption that would force a delisting. Contact the specific store for whether it’s a temporary stock-out or a permanent SKU change.
Q4: What’s the lentil market outlook for the coming season?
A4: Watch, in order: Canadian seeded acreage (spring), Australian harvest results, Saskatchewan Pulse Growers’ mid-season revisions to its 3.36 million tonne production forecast, USDA’s monthly farm-price releases, and shipping costs out of Canadian ports. There’s no exchange-traded lentil futures market comparable to corn or wheat, so pricing is set through negotiated contracts rather than a futures curve.
Q5: How do red and green lentil prices differ?
A5: Saskatchewan Pulse Growers’ outlook tracks red and green lentils as separate price series that can move independently within the same season — a specific split isn’t published as a simple ratio, so check the Saskatchewan Pulse Growers outlook directly for the current commentary on each class.
Q6: How much does India’s lentil demand affect US and Canadian prices?
A6: India is the largest global lentil importer, and its demand draws on the same export pool as other buyers — Canada’s 1.92 billion kg and Australia’s 1.34 billion kg of 2024 exports (Tridge) are shared across all destination markets, so a rise in Indian import demand tightens availability for everyone else without any change in global production.
Q7: Where can I get bulk lentil pricing?
A7: There’s no published national “bulk near me” price — request an FOB quote by origin and color class from your distributor and compare it against the Tridge wholesale benchmark linked above; freight is a larger share of cost at bulk volumes than at retail.
Conclusion: Read the Supply Data, Not the Headline
The specific numbers in this article — $21.80/cwt, 3.36 million tonnes of Canadian production, 1.5 million tonnes of carryout, 1.92 billion kg and 1.34 billion kg of export volume from Canada and Australia — will all be superseded by newer releases within a season or two. What won’t expire is the method: check USDA’s monthly Agricultural Prices release for the current US farm price, check Saskatchewan Pulse Growers’ outlook (revised two to three times per season) for the current supply-demand balance, and treat any shortage claim as unverified until it shows up as a multi-month move in both. That checklist is the actual value of this page — the numbers are just today’s inputs to it.
Discussion
Questions, corrections or field experience? Share them below. First-time comments are reviewed before they appear, and your email is never published.
No comments yet. Be the first to add a question or your experience.

 ZOL Zimbabwe
 Innomick
 Juligerm
 AdBio
AdBio MISE Maroc
 Drift-Sense
 NWNS
NWNS Red August Group
 Farm Inc
 WeMe Global
 Agrotoken
 Blue BearX
 Insignito
 Croptimum
 DnCubed
 Field Capacity
 Indosistim Teknologi
 Liquify Digital
 Licence holder · Niger · Gold
 Licence holder · Nigeria · Gold + lithium










