

Farm weather · Australia guide
Best Farm Weather Forecasting in Australia: A Guide
Combine Bureau of Meteorology forecasts and long-range odds, an on-farm station for spray and frost calls, and satellite crop maps that show how the paddock responded. National rainfall swung from 277.6 mm in 2019 to 596 mm in 2024 (BOM).
Key takeaways
- The Bureau’s long-range forecasts give the chance of above or below median rain and temperature up to four months ahead; one- and two-week forecasts update daily.
- GRDC’s spray guideline is Delta T ideally 2 to 8 and not above 10 (Bureau of Meteorology); follow the label and state rules.
- Australia has warmed 1.51 ± 0.23 °C since 1910, and south-west cool-season rainfall is down around 16% since 1970 (CSIRO and BOM, State of the Climate 2024).
- 2025 was the fourth-warmest year on record at 1.23 °C above the 1961–1990 average, with southern cool-season rain 12% below average (BOM).
- Japan’s Himawari-9 satellite has been the main geostationary weather satellite over the region since December 2022 (JMA).
In this article
- What a weather forecast for agriculture should tell you
- Best weather forecasting sources for Australian farmers
- Weather sources compared
- How satellites feed Australian weather forecasts
- How Australia's climate is changing for farmers
- Recent Australian rainfall and temperature records
- Using forecasts for spraying, sowing and frost
- Is acting on a forecast worth it?
- Bringing weather and crop data together
- Weather by Australian region
- How we checked the numbers
- FAQ
The best weather forecasting for farmers in Australia combines three layers: the Bureau of Meteorology’s free daily and long-range forecasts, an on-farm weather station for spray and frost decisions, and satellite crop maps that show how the paddock is coping. No single app covers all three. This guide explains what each layer does well, where it falls short, and how to turn a forecast into a spray, sowing or frost decision.
It also covers the satellites behind Australian forecasts, recent rainfall and temperature records from the Bureau, and a simple calculator that tests whether acting on a frost or rain forecast pays for itself. Short version: use official forecasts for the big picture, local measurements for the go/no-go call, and crop monitoring to check the result.
What a weather forecast for agriculture should tell you
A normal forecast tells you whether to take an umbrella. A forecast for agriculture has to answer farm questions: can I spray tomorrow, will frost hit the flowering crop, is there enough rain coming to sow?
Four things matter most on Australian farms:
- Spray windows. Delta T, the gap between dry-bulb and wet-bulb temperature, shows how fast droplets evaporate. The Bureau of Meteorology says Delta T should ideally be between 2 and 8 when applying pesticides, and not greater than 10, per its Delta T page. Wind speed and direction matter just as much for drift.
- Frost and heat. Overnight minimums and heat alerts decide when to irrigate, cover or delay operations.
- Rain amount and timing. The chance of a given rainfall total over the next few days drives sowing, fertiliser and harvest timing.
- Seasonal odds. The Bureau issues long-range forecasts as the chance of exceeding median rainfall or temperature for the coming weeks, month and three months.
A good farm forecast combines these with what the crop is doing on the ground. That last part is where satellite crop monitoring fits in. Spray decisions also depend on the product: always check the label and your state’s spray drift rules before you go out.
Best weather forecasting sources for Australian farmers
Here are five sources, in the order most farms would set them up. Each has a “Best for” line so you can match it to a job. We did not rank paid apps against each other; we list the types of source and what each one can and cannot do.
1. Bureau of Meteorology daily and seven-day forecasts
The Bureau (BOM) is Australia’s national weather service. Its town and district forecasts, MetEye grids, radar and warnings are the base layer that most farm apps build on or compare against.
Best for: the next one to seven days, severe weather warnings, radar during storms.
Limits: forecasts are for a grid or district, not your paddock. A frost hollow or a valley wind can differ a lot from the district number.
2. BOM long-range forecasts
The Bureau’s long-range forecasts look out up to four months. According to the Bureau’s guide to its long-range forecasts, they give the percentage chance of wetter or drier (and warmer or cooler) than median conditions for weeks, fortnights, months and three-month periods. Newer maps show the chance of at least a given rain total, such as 10 mm in a week, and the chance of particular three-day totals.
One- and two-week forecasts update daily, around 3 pm eastern time. The Bureau also notes that a three-month forecast issued in the last week of a month will generally be more accurate than one issued earlier in that month.
Best for: sowing plans, stocking rates, fodder buying, and choosing between a short and a long season variety.
Limits: these are odds, not a promise. A 70% chance of above-median rain still means about three seasons in ten come in below median.
3. Climate driver updates (El Niño, La Niña and the IOD)
El Niño, La Niña, the Indian Ocean Dipole and the Southern Annular Mode shift the odds of a wet or dry season. The Bureau’s climate driver monitoring page tracks these indices. Note a change: from December 2024 the Bureau stopped issuing ENSO Outlook Watch and Alert statements and the ENSO dial. It now points users to its long-range forecast, which already accounts for all ocean and atmosphere influences.
Best for: understanding why the long-range forecast says what it does.
Limits: do not plan off a climate driver alone. Use the long-range forecast, which builds the drivers in.
4. On-farm weather stations
A station in or near the paddock measures temperature, humidity, wind and rain where you actually spray and sow. Many stations calculate Delta T on the spot, which is what you need for a spray go/no-go call.
Station data can also drive disease models. A UConn Extension article on tomato disease models describes Tom-Cast, which uses temperature and leaf-wetness time to predict early blight; the same author still found scouting more reliable over time.
Best for: spray timing, frost nights, rain records for each block, and checking how well the forecast did on your farm.
Limits: it measures, it does not forecast. A station needs care (clean rain gauge, correct height, power) to stay accurate.
5. Satellite crop monitoring
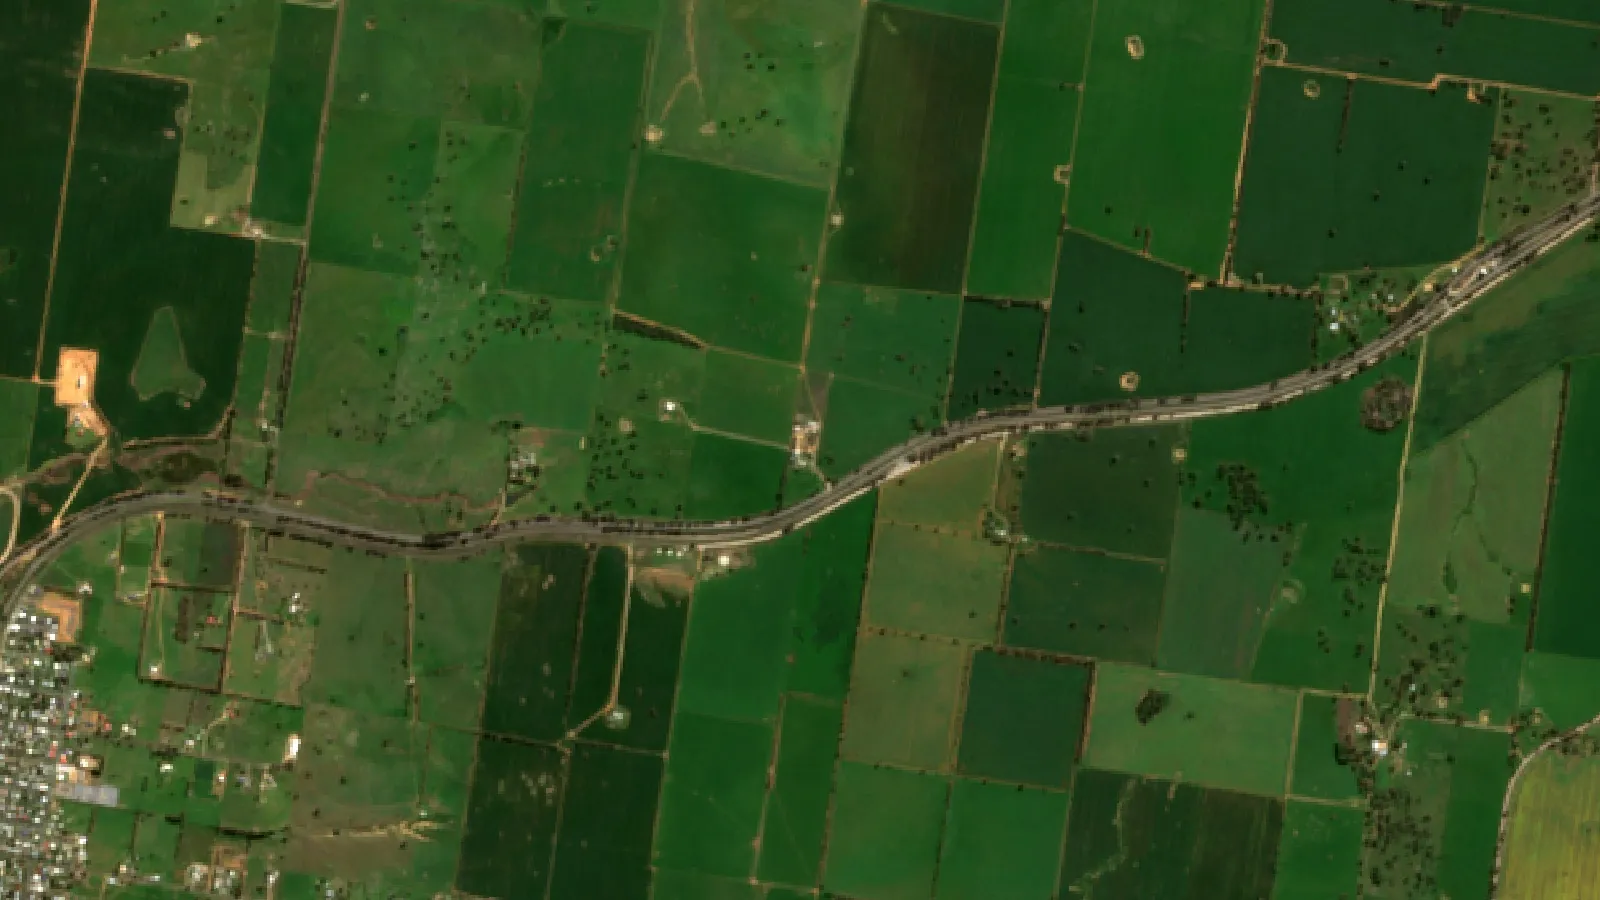
Satellites such as Sentinel-2 measure how green and active the crop canopy is. A vegetation map after a frost, heatwave or dry spell shows which parts of a paddock have changed. That turns a weather event into a list of places to check on foot.
Best for: seeing the effect of the weather on the crop, and deciding where to scout first.
Limits: a satellite shows a change in the canopy, not its cause. Cloud can block optical images for days. You still need to walk the paddock to confirm frost, disease or water stress.
Weather sources compared
The table sums up the five sources. Use it to see which gap each one fills.
| Source | Time range | Scale | Main farm use |
|---|---|---|---|
| BOM daily forecast | 1 to 7 days | District or grid | Day-to-day planning, warnings |
| BOM long-range | Weeks to 4 months | Regional | Sowing, stock and fodder plans |
| Climate drivers | Months | Ocean basins | Context for the long-range odds |
| On-farm station | Now and past | Your paddock | Spray, frost, rain records |
| Satellite crop maps | Past days to weeks | 10 m pixels | Crop response, scouting |
▶ How satellite NDVI maps show crop stress across a large farm before it is visible on foot. · 4:09
How satellites feed Australian weather forecasts
Much of the cloud and storm tracking over Australia comes from a Japanese weather satellite. The Japan Meteorological Agency’s satellite page says Himawari-9 sits about 35,800 km above the equator near 140.7° east. It took over the main operational role on 13 December 2022, with Himawari-8 as back-up, and is scheduled to observe until 2030.
Because it stays over the same spot, a geostationary satellite like Himawari can watch storms, cyclones and fire smoke build through the day. The Bureau uses these images in its forecasts and publishes them on its satellite pages. Polar-orbiting satellites add sharper but less frequent passes.
These observations are shared between countries. The World Meteorological Organization coordinates the global exchange of observations and data processing that national forecasts depend on, as its overview of weather services explains.
Forecast models then turn these observations into a forecast. Global centres such as ECMWF track the skill of their own forecasts with a set of headline scores and publish a detailed report on forecast quality each year. For a farmer, the practical point is simple: forecast skill drops the further ahead you look, which is why long-range forecasts are given as odds.
How Australia’s climate is changing for farmers
Forecasts matter more when the seasons shift. The State of the Climate 2024 report from CSIRO and the Bureau says Australia has warmed by 1.51 ± 0.23 °C since national records began in 1910. It also reports clear changes in rainfall by region and season.
- South-west Australia: April to October rainfall down around 16% since 1970, and May to July rainfall down around 20%.
- South-east Australia: April to October rainfall down around 9% since 1994.
- Northern Australia: October to April wet-season rainfall up around 20% since 1994.
The cool season, April to October, is the main growing season for many southern crops. The same report says southern cool-season rainfall was above the 1961–1990 average in only 6 of the 30 years from 1994 to 2023. That is why the start of the season, and the rain needed to sow, gets so much attention in the south.
Chart
Fall in southern growing-season rainfall
Approximate % decline in seasonal rainfall over the period shown
Recent Australian rainfall and temperature records
Year-to-year swings are large. The Bureau’s annual climate statements show national rainfall ranging from 277.6 mm in 2019, the driest year on record, to 596 mm in 2024, 28% above the 1961–1990 average of 466 mm.
Chart
Australia’s national rainfall by year
Area-averaged rainfall, mm; 1961–1990 average is 466 mm
The Bureau’s Annual Climate Statement 2025 reports that 2025 was Australia’s fourth-warmest year since 1910, at 1.23 °C above the 1961–1990 average. National rainfall was 503 mm, 8% above average. The picture was split: northern wet-season rainfall (2024–25) was 18% above average, while southern cool-season rainfall (April to October 2025) was 12% below average. South Australia’s rainfall was 28% below average, and Queensland’s was 31% above.
A national average can hide what happens on your farm. A wet north and a dry south in the same year is a good reason to read regional forecasts, not national headlines. For 2024 figures, see the Bureau’s 2024 statement; for the driest year, see the 2019 statement.
Chart
Temperature above average by season, 2025
National mean temperature, °C above the 1961–1990 average
Using forecasts for spraying, sowing and frost
A forecast is only useful if it changes a decision. Here is how to use the sources above for the three jobs that depend most on the weather.
Spraying
- Check the seven-day forecast for wind, rain and temperature to find likely spray days.
- On the day, read Delta T and wind from your own station, not the district forecast.
- Stop if Delta T moves outside the label or guideline range, if wind is too light (risk of an inversion) or too strong, or if wind turns towards a sensitive crop or neighbour.
- Record the conditions for each job. Many states require spray records; check your local rules.
Sowing
Use the long-range forecast’s “chance of at least” maps to judge the odds of follow-up rain after sowing. Compare that with stored soil moisture. In a dry start, some growers sow part of the program and wait for a better rain chance on the rest. Ask your agronomist how that fits your rotation and your variety choices.
Frost
Frost damage depends on the crop stage. The risk is highest when cereals flower in late winter and spring. Watch forecast minimums and your own station’s readings for low-lying paddocks. After a frost night, use satellite vegetation maps a week or two later to find patches that have slowed, then cut grain heads in those spots to check for damage.
Is acting on a forecast worth it?
Every forecast is a chance, not a certainty. A simple rule used in weather decision studies is the cost-loss ratio: if protecting the crop costs less than the chance of the event times the loss it would cause, acting is worth it on average. The calculator below lets you test this with your own numbers for a frost, rain or heat event.
The answer is an average over many similar seasons. In a single season you will either lose the protection cost or avoid the loss. Use it to sense-check a decision, not to replace advice from your agronomist or adviser.
Try the numbers for your own farm below.
Calculator
Is it worth acting on this forecast?
Enter the forecast chance, your protection cost and the loss you would expect.
- Expected loss if you do nothing: $2,000
- Cost of acting: $2,000
- Break-even forecast chance: 20.0 %
Example values only, not a benchmark or a forecast; every number is your input. The defaults are set near break-even. The result is an average over many similar events (cost-loss rule), not what will happen this season. Get advice from your agronomist or adviser.
Bringing weather and crop data together
Weather data is most useful when it sits next to crop data. A practical setup for a mixed or broadacre farm looks like this:
- BOM forecasts and warnings on your phone for daily planning.
- One or more on-farm stations for spray and frost calls.
- Satellite vegetation maps for each paddock, checked after every major weather event.
- A simple log of rain, spray jobs and crop observations.
For developers and consultants, weather and satellite data can also come through an API. Our API Developer Docs describe the current, historical and forecast weather endpoints, and you can sign up for an API key on the developer page. Farmonaut Satellite + AI Farm Monitoring System adds satellite crop health maps for each field, which you can view next to the weather for that field.
Planning guides on our site go further on crop planning and management and on water efficiency in agriculture.
Related pages on our site: precision agriculture tools, agriculture web applications, and the Farmonaut web app.

▶ Tutorial on pulling current, historical and forecast weather data from the Farmonaut API. · 4:30
Weather by Australian region
Australia’s farm regions face very different weather risks. A forecast setup that works in one may miss the main risk in another.
- South-west Western Australia: a drying cool season, so the break of season and follow-up rain matter most.
- South-east (Victoria, southern NSW, South Australia): lower cool-season rain since the mid-1990s, plus spring frost risk for cereals and canola.
- Northern Australia: wetter wet seasons since 1994, cyclones and flooding; radar and warnings are critical.
- Queensland and northern NSW: summer storms, heat and very variable rain from year to year.
- Tasmania: cooler, with frost a concern for horticulture.
Whatever your region, compare the forecast with what your own gauge and station record. Over a few seasons you will learn where the forecast tends to run high or low for your farm.

▶ Six plain steps to start precision farming, from field maps to satellite monitoring. · 4:18
How we checked the numbers
All climate figures on this page come from the Bureau’s annual climate statements and long-range forecast guide, the CSIRO and Bureau State of the Climate 2024 report, the Japan Meteorological Agency, the World Meteorological Organization, ECMWF and UConn Extension. We list each source at the end of the page. Figures are dated; check the Bureau for newer statements. We did not test or rank commercial weather apps.
FAQ
What is the best weather forecast for farmers in Australia?
There is no single best one. Most farms use the Bureau of Meteorology for daily forecasts, warnings and long-range odds, an on-farm station for spraying and frost, and satellite crop maps to see how the crop responded.
How far ahead can a farm weather forecast be trusted?
Day-to-day detail is most reliable over the next few days. The Bureau’s long-range forecasts reach four months ahead, but they give the chance of above or below median conditions, not exact amounts.
What Delta T is safe for spraying?
The Bureau of Meteorology says Delta T should ideally be 2 to 8, and not greater than 10. Always follow the product label and your state’s rules, which may be stricter.
Does the Bureau still issue El Niño and La Niña alerts?
No. From December 2024 the Bureau stopped issuing ENSO Watch and Alert statements and the ENSO dial. It still tracks the indices and points users to its long-range forecasts.
Which satellite does Australia use for weather images?
The main geostationary satellite over Australia is Japan’s Himawari-9, operational since December 2022 at about 140.7° east, with Himawari-8 as back-up (Japan Meteorological Agency).
Can satellites show frost damage?
Satellite vegetation maps can show areas where the crop canopy changed after a frost. They cannot confirm frost as the cause, so check those spots on foot.
Farmonaut crop monitoring
See your own paddocks from space
Draw your paddocks once and Farmonaut shows satellite vegetation maps for them through the season, on web, Android or iOS.




Keep reading
Sources
- Bureau of Meteorology, About long-range forecasts: bom.gov.au
- Bureau of Meteorology, Climate driver monitoring (ENSO, IOD, SAM): bom.gov.au
- Bureau of Meteorology, Annual Climate Statement 2025 (February 2026): bom.gov.au
- Bureau of Meteorology, Annual Climate Statement 2024: bom.gov.au
- Bureau of Meteorology, Annual Climate Statement 2023: bom.gov.au
- Bureau of Meteorology, Annual Climate Statement 2022: bom.gov.au
- Bureau of Meteorology, Annual Climate Statement 2021: bom.gov.au
- Bureau of Meteorology, Annual Climate Statement 2020: bom.gov.au
- Bureau of Meteorology, Annual Climate Statement 2019: bom.gov.au
- CSIRO and Bureau of Meteorology, State of the Climate 2024: Australia’s changing climate: csiro.au
- Japan Meteorological Agency, Meteorological satellites (Himawari-8/9): jma.go.jp
- ECMWF, Quality of our forecasts: ecmwf.int
- UConn Extension IPM, Using forecasting models to time tomato fungicides (and insect management): ipm.cahnr.uconn.edu
- World Meteorological Organization, Weather: wmo.int
- Bureau of Meteorology, Delta T: bom.gov.au
Discussion
Questions, corrections or field experience? Share them below. First-time comments are reviewed before they appear, and your email is never published.
No comments yet. Be the first to add a question or your experience.

 YelloSkye
 GalaxEye Space
 Sun Palm Australia
 Grandstream Algérie
 XOS Realty
 Geospatial Lab Africa
 Agro La Gándara
 HIPSAC
 ZOL Zimbabwe
 Juligerm
 AdBio
 MISE Maroc
 NWNS
 Red August Group
 Farm Inc
 WeMe Global
 Agrotoken
 Blue BearX
 Insignito

 Licence holder · Niger · Gold
 Licence holder · Nigeria · Gold + lithium










