

Agritech Software Development: Ag Data Tools Compared
Reviewed August 2026 against USDA’s Economic Research Service precision-agriculture adoption data, the U.S. Government Accountability Office’s precision-agriculture report, and USDA APHIS’s animal disease traceability rule.
Try it: Run your own numbers →
On This Page
- Ag Data Software vs. Agritech Software vs. Agriculture Safety Software
- Agritech Software Development: Platforms, APIs, and Data Pipelines
- Cattle Data Software: Herd Records and Traceability
- Agriculture Safety Software
- Ag Trends Software: 7 Signals Worth Tracking
- Rural Connectivity: The Real Constraint
- Calculator: Precision-Ag Data Investment Payback
- The Farmonaut Platform
- Frequently Asked Questions
- Farmonaut Subscription Plans
- The Bottom Line
Ag Data Software vs. Agritech Software vs. Agriculture Safety Software
Ag data software collects and analyzes field-level numbers — soil, weather, yield, and equipment telemetry — so a grower can make one decision faster. Agritech software is the wider category ag data software sits inside, alongside traceability, fleet management, financing, and safety tools. Agriculture safety software is the slice of that category built to protect people and assets rather than to lift yield. If you only need one of the three, “agritech software” is a broader search than what you actually want; if you need all three talking to each other, you’re shopping for a platform, not a point tool.
Here’s how much ground is still uncovered: the U.S. Government Accountability Office reported that only 27% of U.S. farms or ranches used any precision-agriculture practice to manage crops or livestock, based on USDA’s Agricultural Resource Management Survey fielded between June 2022 and June 2023 (GAO-24-105962, published January 31, 2024). Adoption is far from uniform across farm sizes: USDA’s Economic Research Service found 52% of midsize farms and 70% of large-scale crop-producing farms used guidance autosteering systems in 2023, and 68% of large-scale farms used yield monitors, yield maps, or soil maps that same year, with small farms trailing on every technology category (USDA ERS, December 10, 2024).
Measured by acreage rather than farm count, the gap looks different again: ERS found guidance autosteering applied to “well over 50 percent of the acreage planted to corn, cotton, rice, sorghum, soybeans, and winter wheat,” while variable-rate technology and yield/soil mapping reached only 5% to 25% of planted acreage for winter wheat, cotton, sorghum, and rice, based on ARMS data spanning 1996 through 2019 (USDA ERS, “Precision Agriculture in the Digital Era”). Farm-count adoption and acreage adoption move at different speeds because a small number of very large operations plant a disproportionate share of the country’s acres — worth knowing before comparing any two adoption statistics against each other.
Want to run your own numbers instead of reading someone else’s? Jump to the precision-ag data investment payback calculator.
Agritech Software Development: The Platforms, APIs, and Data Pipelines
Most agritech software, regardless of vendor, is built from the same four layers: an ingestion layer that pulls in satellite imagery, weather, and sensor or equipment telemetry; a processing layer that turns raw pixels and readings into indices and advisories; a delivery layer (web, mobile, API) that puts the output in front of a user; and an export layer that turns the whole thing into something a lender, agronomist, or buyer outside the platform can act on.
- Ingestion: satellite imagery (NDVI, EVI, MSAVI), weather station and forecast feeds, IoT soil/water sensors, and equipment telematics.
- Processing: cloud masking, index calculation, anomaly detection, and the AI advisory models that convert an index value into a recommendation — irrigation timing, pest risk, harvest window.
- Delivery: Farmonaut’s own stack ships this as a web app, Android app, and iOS app, plus a REST API for teams embedding the data into their own software rather than using the dashboard directly.
- Adjacent modules most agritech builds add once the core data layer works: fleet and equipment management, blockchain-based product traceability, and carbon-footprint reporting.




Turning Field Data Into a Report Someone Else Will Actually Read
A recurring build request in agritech software development is a web-based export: a season summary that turns raw sensor and imagery numbers into a shareable PDF, ideally with a price reference attached so the document is useful to a lender or grain buyer, not just the farm’s own dashboard. Two things separate a useful version of this feature from a decorative one: the yield or NDVI-derived figures need to trace back to a dated satellite pass or sensor reading rather than an unsourced smoothed average, and the price reference needs to come from a public feed — U.S. platforms most commonly pull from the USDA Agricultural Marketing Service’s daily and weekly cash and terminal-market reports — instead of being typed in by hand. Farmonaut’s web app and API generate exportable field reports from the same NDVI, soil, and advisory data behind the dashboard; the developer docs cover the endpoints for teams building that report layer into their own software.


Cattle Data Software: Purpose-Built Tools for Herd Records and Traceability
“Cattle data software” is a narrower ask than general ag data software: it means calving dates, weights, treatments, and pedigree records for a herd, plus — as of a federal rule change — an electronic identification layer that general-purpose farm software rarely handles. Since November 5, 2024, USDA’s Animal and Plant Health Inspection Service has required that eartags used as official identification for the interstate movement of covered cattle and bison be both visually and electronically readable, replacing the previous visual-only standard; the rule was finalized and published on May 9, 2024 (Federal Register, Doc. 2024-09717). Tags applied before that date remain valid identification for the life of the animal, but any producer moving covered cattle across state lines from that point on needs an EID reader in the chain somewhere — which is what pulls cattle data software into a category of its own rather than a generic spreadsheet replacement. USDA APHIS’s traceability program page carries the current list of covered classes and any exceptions; check there before assuming your herd is or isn’t in scope, since the covered-class list is set by regulation and can be amended.
What’s Actually on the Market
University of Nebraska–Lincoln Extension maintains a comparison of dedicated cow-calf record-keeping programs rather than naming a single winner, on the stated reasoning that “price is not everything” — its guidance is to weigh technical support, ease of use, and trial availability before cost (University of Nebraska–Lincoln Extension). The programs it lists include CowCalf5 (University of Nebraska’s Great Plains Veterinary Educational Center), Chaps 2000 (North Dakota State University’s Dickinson Research Extension Center), THE Beef Cattle fIRM (University of Tennessee Extension), and commercial cloud options such as CattleMax.
| Plan | Billing | Monthly cost | Herd-size tiers |
|---|---|---|---|
| Commercial | Billed annually | $12/mo | 50 to 2,000+ active animals |
| Commercial | Monthly | $15/mo | 50 to 2,000+ active animals |
| Registered | Billed annually | $16/mo | 50 to 2,000+ active animals |
| Registered | Monthly | $20/mo | 50 to 2,000+ active animals |
Source: CattleMax plan pricing (cattlemax.com/pricing), confirmed August 2026. Cattle-software vendors revise tiers periodically — check the vendor’s current page before budgeting.
How to Evaluate a Cattle Data Program Before You Buy
- Does it sync with an EID reader, or accept only manual tag entry? This matters directly because of the November 2024 traceability rule above.
- Is pricing per active animal, flat, or tiered by herd size — and what happens when your count crosses a tier boundary mid-year?
- Does it export records as PDF or CSV for a veterinarian, co-op, or state brand inspector, or only display them on screen?
- Is it a one-time desktop license or a recurring cloud subscription, and who keeps the data if you cancel?
- Does the vendor or your state Extension office offer a trial period before you commit a full season of records to it?
Agriculture Safety Software
Agriculture safety software is the layer of agritech software built around people and compliance rather than yield: incident logging, wearable alerts near moving machinery, chemical-exposure tracking, and audit trails a workers’-comp insurer or safety inspector can review. It typically runs alongside, not instead of, the ag data layer — the same GPS and equipment-telemetry feeds that guide a tractor also flag when a person is standing in its path.
For a side-by-side look at what’s on the market specifically for this category, see this comparison of digital farm-safety solutions. Field-built mobile apps — the same design pattern covered in this piece on AI-powered farming apps — are the template safety software borrows from: work offline, sync when connectivity returns, and put the alert on the phone the worker already carries rather than a terminal in the shop.
No single federal survey tracks agriculture-safety-software adoption the way ARMS tracks precision ag, so there’s no clean adoption percentage to cite here. If you need a number for your own planning, your state’s workers’-compensation carrier and your insurer’s loss-run reports are the two places that will have farm-specific injury and incident rates for your operation and region.
Ag Trends Software: The 7 Signals Worth Tracking
“Ag trends software” searches usually mean one thing: which of these categories is actually moving, and which is still a slide-deck promise. Here’s each trend against the hardest evidence available, rather than an invented adoption percentage per row.
| Trend | What the data actually shows | Farmonaut example |
|---|---|---|
| AI-driven advisory | GAO flags data governance and interoperability, not model accuracy, as the main barrier to AI-in-ag scaling (GAO-24-105962, Jan 2024). | Jeevn AI advisory for irrigation and pest timing |
| Satellite & IoT data collection | 27% of U.S. farms use any precision-ag practice; adoption rises to 52–70% on midsize and large-scale farms for guidance systems (USDA ERS/GAO). | NDVI/EVI monitoring via Web App |
| Equipment automation & guidance | Autosteer reached 70% of large-scale crop farms and 52% of midsize farms in 2023 (USDA ERS, Dec 2024). | Fleet telemetry via Fleet Management |
| Blockchain traceability | No national adoption survey exists yet; the closest federal parallel is the mandatory EID traceability rule for cattle, effective Nov. 5, 2024. | Product Traceability platform |
| Environmental/carbon reporting | AEM’s Aug. 2025 study credits precision practices with avoiding cultivation of 11.4 million acres of cropland. | Carbon Footprinting |
| Integrated safety & compliance | No federal adoption survey; track your own incident rate via your workers’-comp carrier (see Agriculture Safety Software above). | Compared at farm-safety software guide |
| Satellite-verified financing & insurance | $200 million in combined USDA/NSF precision-ag R&D funding, FY2017–2021, much of it aimed at data infrastructure lenders now draw on (GAO). | Crop Loan & Insurance tools |
The Productivity Case, in AEM’s Own Numbers
The Association of Equipment Manufacturers, with the American Farm Bureau Federation, American Soybean Association, CropLife America, and National Corn Growers Association, updated its precision-agriculture benefits study in August 2025. It credits precision-ag adoption to date with a 5% increase in annual U.S. crop production, with another 6 percentage points available if adoption keeps climbing — a combined upside of roughly 11 points over a no-precision-ag baseline. The same study attributes 11.4 million acres of cropland avoided (about five times the area of Yellowstone National Park) to precision practices, and finds that targeted spray-application technology can cut herbicide volume by 50% to 90% where it’s deployed (AEM, August 2025).



Rural Connectivity: The Real Constraint
Every trend above assumes a data connection, and that’s the constraint GAO and the Farm Bureau both flag first. About 20% of U.S. farms lacked broadband internet access as of 2021, per the American Farm Bureau Federation’s analysis of federal connectivity data — and the Federation puts the cost of a private wireless 5G system built specifically for precision-ag use at $55,000 upfront (equipment, tower, and labor) plus about $6,000 a year in subscription costs, which is often the larger line item next to the software license itself (American Farm Bureau Federation).
The 2022 Census of Agriculture shows the trend moving in the right direction, if slowly: farms with any internet access rose from 75% in 2017 to 79% in 2022, while mobile internet access nearly doubled, from 39% to 62%, over the same five years — even as the total U.S. farm count fell to 1.9 million, down 6.9% (about 142,000 farms) from 2017 (Choices Magazine, National Association of Agricultural Economists, summarizing USDA’s 2022 Census).
Connectivity-first workarounds aren’t unique to the U.S. Similar builds — extending satellite connectivity into under-served rural areas — are underway elsewhere, using the same principle U.S. operations without fiber or 5G already lean on: satellite-based data collection doesn’t need local broadband to deliver an imagery-based advisory to a phone.
Calculator: Precision-Ag Data Investment Payback
Enter your own acreage and cost quotes below — using the Farm Bureau’s connectivity-cost figures above only as a starting placeholder — to see the payback period for a precision-ag data investment.
Run your own numbers
Assumes the added value per acre is realized every year of the projection and stays constant; it excludes financing interest, equipment depreciation, and labor. The $55,000/$6,000 defaults reflect the private-5G example cited above — replace them with your own quotes.
The Farmonaut Platform: Where These Pieces Come Together
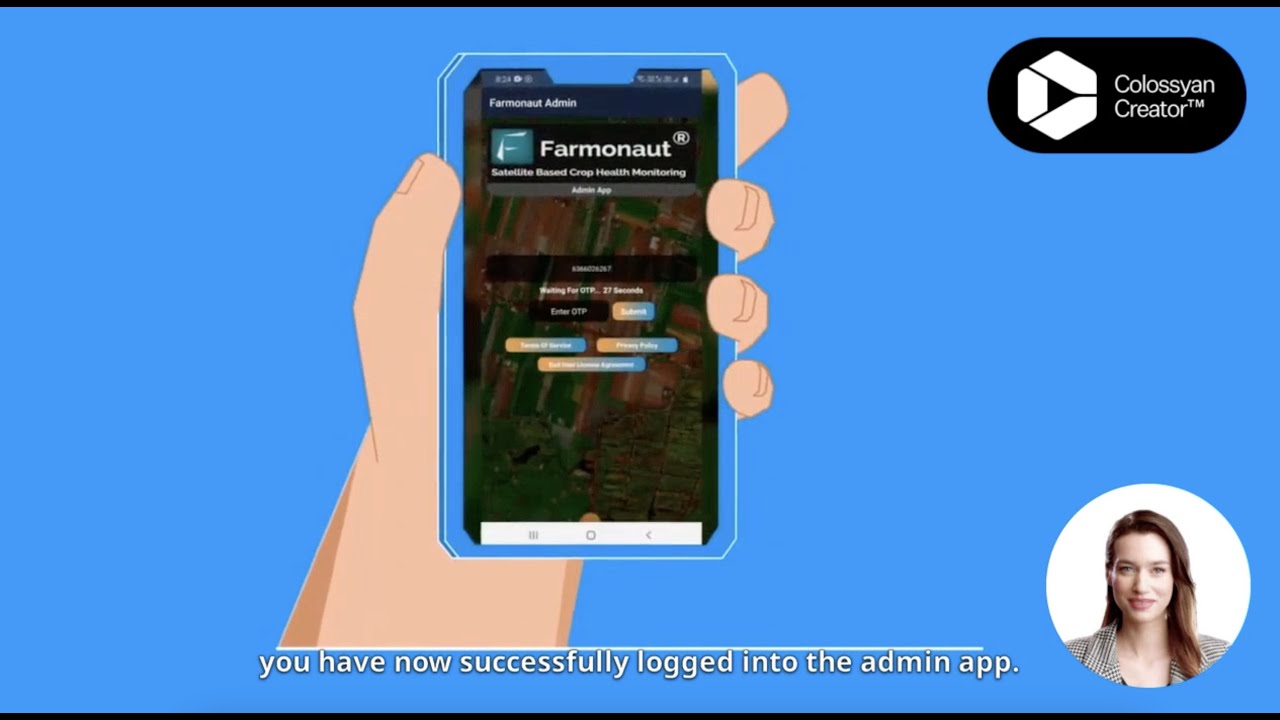
Farmonaut brings the layers above under one account rather than requiring separate vendors for each: satellite-based monitoring through the web app and open API; AI-driven Jeevn advisory for irrigation, input timing, and risk alerts; blockchain-enabled traceability for growers, processors, and distributors; fleet and resource management to track machinery location and uptime; carbon and environmental reporting; and satellite-verified crop loan and insurance tools. For admin- and enterprise-level field tracking across multiple locations, see large-scale farm management with Farmonaut.

Frequently Asked Questions
What’s the difference between ag data software and agritech software?
Ag data software focuses on collecting and analyzing farm-level numbers — soil, weather, equipment, crop health, yield — for precision decisions. Agritech software is the broader category: farm management, traceability, safety and compliance, financing, and automation systems built on top of that data layer.
Is there one best cattle data software?
No single program fits every herd. Match the choice to the five-point checklist in the cattle section above — EID compatibility, pricing structure, export format, hosting model, and trial availability — and weigh it against your own herd size and state Extension office’s current comparison list rather than a vendor’s marketing page alone.
What changed with cattle traceability that software needs to handle now?
Since November 5, 2024, official eartags for interstate movement of covered cattle and bison must be electronically readable, not just visual, under USDA APHIS’s finalized rule (Federal Register, Doc. 2024-09717). Software that only logs a visual tag number no longer covers the full compliance picture for producers moving cattle across state lines.
What’s the easiest way to generate a web-based harvest report as a PDF with price data?
Look for a platform that exports its own dated yield or NDVI-derived figures directly to PDF rather than requiring manual copy-paste, and that pairs those figures with a public price feed such as USDA’s Agricultural Marketing Service reports instead of a hand-typed number. Farmonaut’s web app and API generate this kind of report from the same data behind its dashboard.
Where can I check for more current ag data adoption numbers than this page?
USDA’s Economic Research Service republishes precision-agriculture adoption charts as new Agricultural Resource Management Survey rounds come in, and the Census of Agriculture runs every five years (next full release after 2022 is due in 2027). GAO’s precision-agriculture report and USDA APHIS’s traceability rule page are the two other primary sources this article draws from, and both are the fastest way to confirm whether a figure here has since moved.
How much does agritech software cost to build versus buy?
Buying access to an existing data layer — through an API like Farmonaut’s rather than building satellite ingestion and processing from scratch — is the lower-cost path for most operations; USDA and NSF alone put nearly $200 million into precision-ag R&D infrastructure between FY2017 and FY2021, which is the kind of investment a buy decision lets you skip (GAO-24-105962). Building your own stack makes sense mainly when you need proprietary processing logic or are integrating agritech data into a larger existing enterprise system.
Farmonaut Subscription Plans
Choose the right package for crop monitoring, fleet management, traceability, environmental compliance, and more.
The Bottom Line
Ag data software, agritech software, and agriculture safety software are three different scopes of the same market, and the honest adoption number for all of them combined — 27% of U.S. farms using any precision-ag practice as of the 2022–2023 ARMS survey — means most of the market is still deciding, not already sold. The gap by farm size (52–70% on midsize and large operations versus a national average pulled down by smaller farms) and the connectivity cost behind it ($55,000 upfront plus $6,000 a year for a private 5G build) are the two numbers worth remembering longer than any single vendor’s feature list.
Cattle data software has its own forcing function now: the November 2024 EID rule makes electronic readability a compliance question, not just a convenience feature, for anyone moving covered cattle across state lines. Whichever category brought you here, the durable move is the same — check the checklist, not the sales page, and confirm figures against USDA ERS, GAO, or APHIS directly before budgeting.

 Godrej Agrovet
 Hayleys Agriculture
 Linx Agritech
 Adinet
 Save Your Soils
 GalaxEye Space
 Grandstream Algérie
 XOS Realty
 Geospatial Lab Africa
 Agro La Gándara
 HIPSAC
 ZOL Zimbabwe
 Juligerm
 AdBio
AdBio MISE Maroc
 NWNS
NWNS Red August Group
 Farm Inc
 WeMe Global
 Agrotoken
 Blue BearX
 Insignito
 DnCubed
 Indosistim Teknologi
 Liquify Digital
 CU Foods
 BeyondTech Global
 Rouge VC
 AgroRisk
 Oath Inc
 Esri North East Africa
 MDCV UK
 Etech Consulting Madagascar
 Vestlandsforsking
 WB Dev
 Sama Premium
 Tres Valles
 Blickwinkel
 Agricultural Credit Policy Council
 eKGIS
eKGIS Mostas Tech
 Andex
Andex Deluxe Conseil
 WICO
WICO Chimera Innovation
 SkyHarvest
 Teledarbas
 Exurbia Geospatial
 FieldZero
