

Crop AI · Evidence guide
Crop AI: What It Does, Real Results and When It Pays
Crop AI learns from images, weather, soil and yield records to flag weeds, stress and likely yield. Its clearest field numbers are in spraying: Iowa State measured 43.9% to 90.6% herbicide savings on five soybean fields.
Key takeaways
- Iowa State’s five-field soybean demonstration averaged 76% herbicide savings, or $15.70 per acre, and weed pressure drove the range.
- A maize yield model reached an error of 12% of average yield on data from a 2018 industry challenge (Frontiers in Plant Science, 2019).
- A disease model scored 99.35% on images like its training set and just above 31% on images taken under different conditions (Mohanty et al., 2016).
- In 2023, yield monitors or maps were used on 13% of small US crop farms and 68% of large-scale ones (USDA ERS).
- Test any tool on strips in your own fields, and read who owns the data.
In this article
- What crop AI means in plain terms
- Crop AI uses compared by evidence
- Weed control: where crop AI has the clearest numbers
- Yield prediction: strong in tests, less tested on one field
- Disease and pest detection: check the fine print
- Satellite crop AI: seeing the whole farm
- Water, machinery and other farm uses
- Who uses precision tools today
- What crop AI costs and when it pays
- Risks and limits to plan for
- Crop AI, farm costs and the environment
- Questions to ask any crop AI vendor
- How to start with crop AI on your farm
- FAQ
Crop AI is software that learns from field images, weather, soil and yield records, then flags weeds, stress or likely yield so a grower can act sooner. Its clearest field result so far is in spraying: Iowa State University measured herbicide savings of 43.9% to 90.6% across five soybean fields, and the gap came down to weed pressure.
This guide covers what crop AI does today, how well each use holds up, who has adopted the tools behind it, and what can go wrong. It uses USDA survey data, university trials and peer-reviewed models. A calculator lets you test whether camera-guided spraying would pay on your own acres.
What crop AI means in plain terms
Farm AI usually means machine learning. A model is shown many examples, such as photos of weeds or years of county yields, and it learns patterns that link the inputs to the outcome. A review of machine learning in agriculture sorted crop uses into yield prediction, disease detection, weed detection, crop quality and species recognition, with separate groups for livestock, water and soil.
Three things decide whether a model helps on your farm:
- The data it trained on. A model does well on conditions it has seen, and it can fail on conditions it has not.
- The decision it feeds. A map nobody acts on saves nothing. A nozzle that shuts off by itself saves chemical on the same pass.
- The margin at stake. A tool that cuts a small cost by a large percent can still lose money once you add its yearly charge.
Keep these three in mind as you read the table below. It uses plain labels for how strong the public evidence is, based on the sources in this guide. It does not give a yield gain for each tool, because the studies here do not support one general figure.
Crop AI uses compared by evidence
| Use | What it does | Evidence in this guide | Main limit |
|---|---|---|---|
| Weed spraying | Cameras find weeds and open nozzles over them | University field demonstration, five fields | Savings fall as weed pressure rises |
| Yield forecasts | Models estimate yield from weather, soil and history | Peer-reviewed studies on held-out data | Tested at county or location scale, not on your field |
| Disease photos | Models name a disease from a leaf image | Lab images scored high; other images scored far lower | Accuracy drops on unfamiliar photos |
| Satellite scouting | Models and indices flag weak field zones | Mission designed for a 5-day revisit at the Equator | Cloud cover; shows change, not the cause |
| Irrigation data | Sensors and models guide water timing | Nebraska field records show room to improve | Needs local calibration |
| Autonomous machines | Cameras and models steer tractors | Retrofit kits announced January 2025; limited 2025 supply, full launch planned for 2026 | Limited to certain models and tasks |
Weed control: where crop AI has the clearest numbers
A broadcast pass treats every square foot. A camera-guided sprayer treats what it sees as a weed. In a field demonstration by Iowa State University, a John Deere See and Spray Ultimate machine ran on five conventionally managed soybean fields covering 415 acres in 2024, at the post-emergence pass after a residual program. Average product savings were 76%, worth nearly $6,500, or $15.70 per acre, in reduced herbicide.
Chart
Herbicide saved by a precision spray system
Percent of product saved, five Iowa soybean fields, 415 acres in total
The range matters more than the average. One field saved 90.6% and another saved 43.9%, and the authors tied savings directly to initial weed pressure. A clean field gains a lot. A weedy field gains much less.
The manufacturer’s own wider figure sits lower than the Iowa average. Josh Ladd told Oklahoma Farm Report in December 2025 that growers saw nearly 50% herbicide savings in a wet spring with heavy weeds, on more than 5 million acres. That is a company statement, not an independent trial, but it covers far more ground than five fields.
Weed recognition has also been tested in published work. The DeepWeeds study in Scientific Reports trained two models on eight weed species from northern Australia, photographed in their native settings. They reached average accuracies of 95.1% and 95.7%. Those species and sites were the ones the models were built for, so check any vendor’s results against your own weeds and crop stage.
Before you buy, ask three questions:
- What share of your herbicide bill goes on post-emergence passes? Savings apply to that part, not to a residual program sprayed across the whole field.
- How weedy are your fields at spray time? Use your own scouting notes rather than a brochure average.
- Which crops and row spacings does the system support? This changes between models and software versions.
Always follow the herbicide label and local rules. Spot treatment does not change the label’s rate, buffer or resistance guidance, so ask your agronomist how a lower total volume fits your resistance plan.
Yield prediction: strong in tests, less tested on one field
Yield is the classic crop AI problem, and published results are good when judged on data the model did not train on. In the 2018 Syngenta Crop Challenge study in Frontiers in Plant Science, a deep neural network predicted maize hybrid performance with an error of 12% of average yield. It drew on 2,267 hybrids and 2,247 locations from 2008 to 2016.
A study in PLOS One on Random Forests compared machine learning with a standard regression benchmark. The machine learning model cut the error in each case shown in the chart. For US maize by county over 30 years, its error was 1.13 tons per hectare against 1.94 for regression.
Read those numbers with care. An error of 16.7% on a 180-bushel crop is about 30 bushels, which is useful for a county outlook or a grain buyer but wide for choosing a nitrogen rate on one field. Your own yield maps give any field-level tool local history to work with, so keep clean yield monitor data even before you use AI.
What to use a yield forecast for
- Early grain marketing and storage planning, with the error range in view.
- Finding zones that underperform year after year, so you can test soil or drainage there.
- Comparing a season with past seasons as it develops, rather than treating one number as a promise.
Chart
Prediction error: machine learning vs regression
Error (RMSE) as a percent of average observed yield, on test data; lower is better
Disease and pest detection: check the fine print
Leaf-photo tools can quote high accuracy. One well-known paper shows why such a figure needs context. Mohanty and colleagues trained a model on 54,306 leaf images taken under controlled conditions, covering 14 crops and 26 diseases. It scored 99.35% on held-out images from that same set. On images taken under different conditions, accuracy fell to just above 31%.
That paper dates from 2016, and models have changed since. The lesson still applies: a score earned on similar pictures says little about a muddy leaf at dusk in your field. Use a photo app as a prompt for scouting, then confirm with an extension service or a lab before you spray. Check the product label and local rules before any treatment.
Models can also flag risk, but they do not replace a scout who turns over the leaves and counts insects against an economic threshold.
Satellite crop AI: seeing the whole farm
Satellites give crop AI something a field camera cannot: every acre, on repeat. The European Sentinel-2 mission was designed for a revisit of 5 days at the Equator using its twin satellites. That rhythm lets software compare one field with itself across a season and across earlier years.
Many tools use vegetation indices such as NDVI, which track how plants reflect red and near-infrared light. AI then helps by filtering clouds, separating normal crop stages from real drops, and sorting fields so that you look at the worst first.
Satellite data shows that something changed. It does not name the cause. A weak zone could be nitrogen loss, compaction, an insect problem or a planter fault, so a person still needs to walk to that spot. A good workflow looks like this:
- Check the latest clear image and compare it with the previous one.
- Mark zones that fell behind the rest of the field.
- Scout those zones first, with a soil probe and a camera.
- Record what you found, so that next season’s decisions rest on your own history.
Satellite images also help with water stress mapping, land use records and damage checks after hail or flood. Clouds can leave gaps at the wrong moment, so plan for a few missing dates. Tools such as the Farmonaut Satellite + AI Farm Monitoring System package this imagery with crop health maps and reports. Developers can read the satellite data API notes and the API developer documentation.
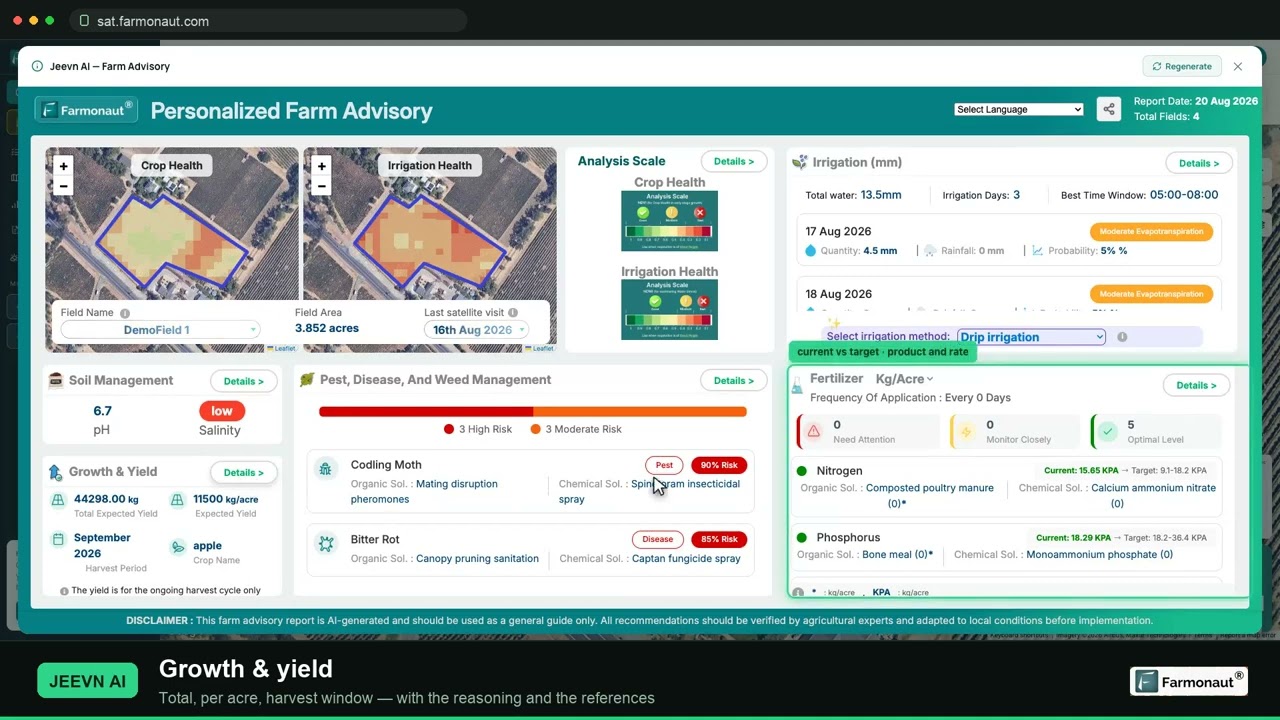
▶ Walkthrough of satellite crop monitoring: reading NDVI, running an AI farm advisory and pulling a field report. · 19:36
Water, machinery and other farm uses
Irrigation. There is real room for better timing. In a University of Nebraska review of irrigators in central Nebraska, about a third were doing a good job, and the other two thirds could have saved money and water without losing yield. In the very dry years of 2020 and 2021, though, 15% to 20% of fields may have been under-watered late in the season, so better data can also mean more water at times. Treat any model’s advice as a check against soil moisture readings.
Autonomy. John Deere announced retrofit autonomy kits in January 2025 that pair camera arrays and machine learning for tractors and tillage tools, according to AgWeb. They fit specific model years, so check your serial number and dealer support first. Simple auto-steer took years to spread: USDA found it on 5.3% of planted corn acres in 2001 and 58% in 2016.
Maintenance, grading and livestock. The same methods can warn of machine faults, sort produce by size and quality, and track animal health. USDA’s survey gives a sense of scale for livestock: wearable technologies ranged from 1% of small farms to 12% of large-scale farms with livestock sales in 2023. Robotic milking reached 19% of large-scale farms that produced milk.
Markets and weather. Models can sort price and forecast data quickly, but they do not remove price risk. Use them as one input and speak to a qualified adviser before making large financial decisions.

▶ How satellites, AI and drones are being used to grow food. · 13:27
Who uses precision tools today
Crop AI rests on earlier precision tools, and their spread shows a clear split by size. USDA’s Economic Research Service reports that yield monitors, yield maps or soil maps were used on 13% of small crop farms and 68% of large-scale ones in 2023. Guidance autosteering ran from 9% to 70%, and variable rate technology from 5% to 45%. Drones were much rarer, at 12% of large-scale family crop farms.
Chart
Precision tools on small and large US crop farms
Percent of crop-producing farms using each tool, 2023; small family vs large-scale family farms
ERS explains this pattern through scale: bigger farms can benefit more from these tools. An earlier ERS report on precision agriculture also shows wide gaps by crop in variable rate use, with corn well ahead of sorghum. Those years differ between crops because USDA surveys each one on its own schedule.
Chart
Variable rate technology by crop
Percent of US planted acres, selected crops; survey year in each label
What crop AI costs and when it pays
Packages change by dealer, acreage and season, so this guide does not quote one price. Get a written quote that includes hardware, subscription, support and any per-acre charge. Then put the numbers into the calculator below. The savings rate is yours to set, using your own weed pressure as your guide.
Beyond the sprayer, the same logic works for any crop AI tool: yearly cost divided by acres gives the amount the tool must return per acre. If a satellite or scouting service charges per acre, ask which decision will change, and how many acres it needs to touch to cover the fee.
Try the numbers for your own farm below.
Calculator
Would camera-guided spraying pay on your acres?
Enter your own acres, herbicide spend, expected savings and quoted yearly cost.
- Herbicide saved, US$ per year: $16,000
- Saved, US$ per acre: 8.00
- Acres needed to break even: 2,000
Example values only, set to break even exactly. They are not benchmarks or forecasts. Prices are examples, use today’s price and your dealer’s written quote. Excludes any yield effect and labor changes.
Risks and limits to plan for
- Data quality. Models repeat the gaps in their training data. Ask where a tool was trained and whether it has been tested on your crop and region.
- Data ownership. Read the contract. The Ag Data Transparent principles in the US rest on the belief that farmers should own data from their operations. In Australia the National Farmers’ Federation’s Farm Data Code gives growers a yardstick for judging provider terms.
- Connectivity. USDA’s 2025 farm technology survey found that 85% of US farms had internet access and 55% used a broadband connection. Ask what still works offline in the field.
- Service support. A farmdoc daily article from January 2026 looks at how precision agriculture shapes demand for farm service technicians. Check who will fix your system at the peak of spraying.
- Skills. Budget time for training and for a season of comparing the tool against your own judgment.
- Environmental claims. Lower input use can reduce a farm’s footprint, as covered in our guide to how farming affects the environment. Measure your own reductions before you report any to a buyer or a program.
Crop AI, farm costs and the environment
Claims about profit and sustainability are easy to make and harder to show. The honest test is what changes on the farm. If a sprayer applies less product, you can read that in your chemical bill. If irrigation timing improves, your pump hours and water records will show it. These are numbers you already keep.
Soil health, biodiversity and food waste are often named as AI benefits too. Models can help sort soil test results, plan rotations or improve storage and transport. The gains depend on the action taken, so treat them as goals to measure rather than results to assume.
Jobs also shift. Some tasks in the cab get automated, while work grows in data handling, calibration and repair. Plan who on your team will own the tool, and what happens when that person is away at the peak of the season.
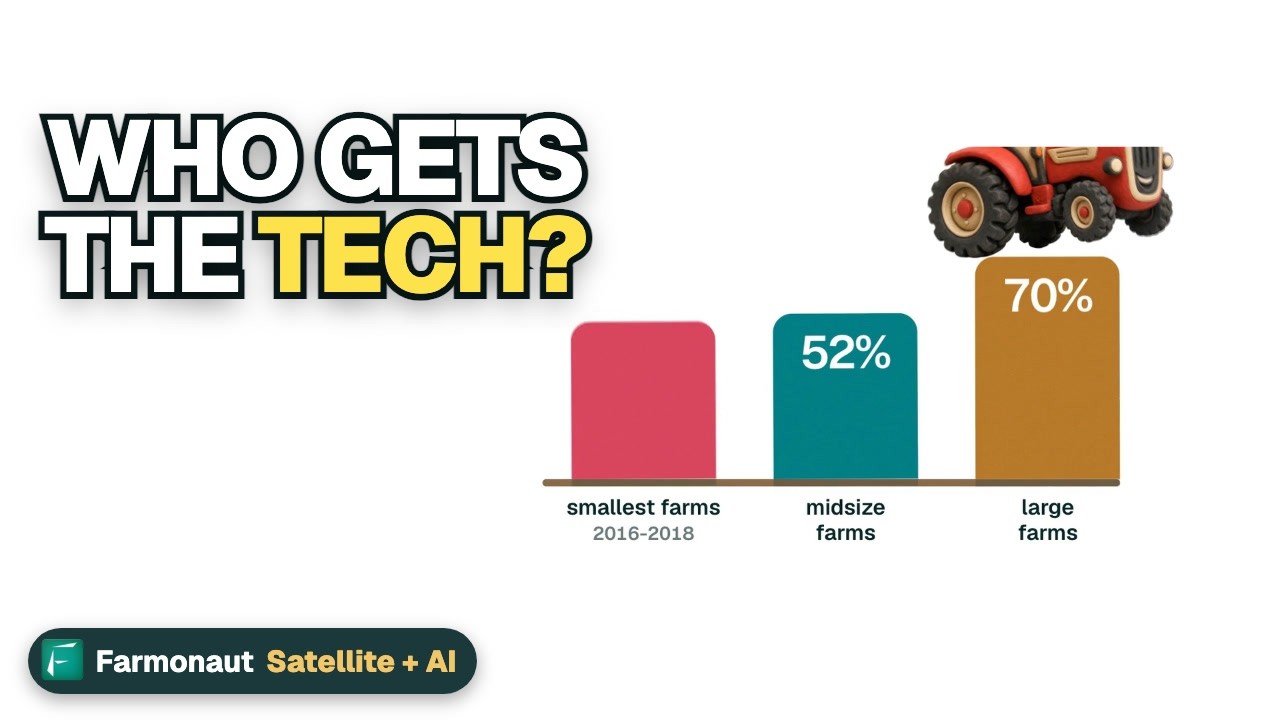
▶ What farm technology means for money, jobs and internet in rural towns. · 3:50
Questions to ask any crop AI vendor
- Which crops, regions and growth stages was the model trained on?
- Do you have independent trial results, and how many fields and seasons do they cover?
- What happens when the model is unsure? Does it warn the user?
- Can I export my data in a standard format, and delete it if I leave?
- What is the full yearly cost, including hardware, support and per-acre charges?
- Who answers the phone during planting and spraying, and how quickly?
A vendor that answers these clearly is easier to compare. A vendor that quotes one accuracy figure with no test conditions has told you little.
How to start with crop AI on your farm
- Name one costly decision. It could be weed control, irrigation timing or where to scout first. Avoid buying a general platform with no target.
- Collect your baseline. Gather two or three years of yield maps, input bills and field notes.
- Run a strip test. Compare the tool with your usual practice on matched strips in the same field for one season.
- Count the full cost. Include subscriptions, training, downtime and support, not just the headline price.
- Keep a person in the loop. Scout before acting on any alert, and write down when the tool was right or wrong.
- Scale slowly. Expand only if the strips show a return you can measure.
Generative models, more sensors and smaller robots are all in development. New tools can be judged by these same steps, so you do not need to predict which one wins.
Related pages on our site: digital farm tools compared; smart farm technologies; precision methods for yield and soil health; AI and big data on farms; farm data analytics trends.
FAQ
What is crop AI?
It is software that learns from images, weather, soil and yield records to support crop decisions. Common uses include weed detection, yield forecasts, disease identification and satellite field monitoring.
Does crop AI increase yields?
It can help, but no single figure applies to all farms. The strongest numbers in this guide concern lower herbicide use and forecast accuracy, not a general yield gain. Test any claim with strips on your own fields.
How accurate is AI crop disease detection?
It depends on the images. One well-known study scored 99.35% on images like its training set and just above 31% on images taken under different conditions. Confirm any result with a scout, an extension service or a lab.
Is crop AI worth it for small farms?
USDA data shows far lower use on small farms, and ERS points to scale as a reason. Per-acre services and scouting tools carry less upfront cost than machinery, so start with one decision and work out the break-even first.
Who owns the data from farm AI tools?
That depends on your contract. Look for clear terms on ownership, sharing and deletion. Ag Data Transparent in the US and the Australian Farm Data Code are useful checklists. Get legal advice on large agreements.
Farmonaut crop monitoring
Check your own fields from space
Add a field to see satellite crop health maps and choose where to scout first.




Keep reading

Sources
- Iowa State University Extension, Precision Spraying Technology (2024): crops.extension.iastate.edu
- USDA ERS, America’s Farms and Ranches at a Glance, EIB-283 (December 2024): ers.usda.gov
- USDA ERS, Precision Agriculture in the Digital Era, EIB-248 (February 2023): ers.usda.gov
- USDA NASS, Technology Use (August 2025): esmis.nal.usda.gov
- Khaki and Wang, Crop Yield Prediction Using Deep Neural Networks, Frontiers in Plant Science (2019): frontiersin.org
- Jeong et al., Random Forests for Global and Regional Crop Yield Predictions, PLOS One (2016): journals.plos.org
- Mohanty et al., Using Deep Learning for Image-Based Plant Disease Detection, Frontiers in Plant Science (2016): frontiersin.org
- Olsen et al., DeepWeeds, Scientific Reports (2019): nature.com
- Liakos et al., Machine Learning in Agriculture: A Review, Sensors (2018): pmc.ncbi.nlm.nih.gov
- Copernicus SentiWiki, Sentinel-2 mission overview: sentiwiki.copernicus.eu
- University of Nebraska CropWatch, farmer irrigation scheduling in central Nebraska (2022): cropwatch.unl.edu
- Ag Data Transparent, Core Principles: agdatatransparent.com
- National Farmers’ Federation, Australian Farm Data Code: nff.org.au
- farmdoc daily, Precision Agriculture and Farm Service Technician Demand (January 2026): farmdocdaily.illinois.edu
- Oklahoma Farm Report, See & Spray interview (December 2025): oklahomafarmreport.com
- AgWeb, John Deere next-generation autonomy kits: agweb.com
Discussion
Questions, corrections or field experience? Share them below. First-time comments are reviewed before they appear, and your email is never published.
No comments yet. Be the first to add a question or your experience.

 TVS Electronics
 BW Pipelines
 WICO
 Gen Chayat
 Chimera Innovation
 Hiteshi Infotech
 SkyHarvest
 Polaris Digitech
 Teledarbas
 Wild Oak Farm
 SFX
 BACF Africa
 Doodlakine
 Exurbia Geospatial
 FieldZero
 Indico Company

 Licence holder · Niger · Gold
 Client · Tanzania · Gold
 Client · Somalia · Gold
 Client & affiliate partner · Ghana · Gold










