

Figures checked September 2026 against US EPA, USDA, FAO and IPBES sources.
Try it: Run your own numbers →
Agriculture affects the environment through six measurable channels: greenhouse gas emissions, fertilizer and pesticide runoff into water, soil erosion, deforestation, freshwater consumption, and biodiversity loss from monoculture. In the United States, agriculture emitted 593.4 million metric tons of CO₂-equivalent in 2022, 9.4% of the national total, according to the EPA greenhouse gas inventory. Worldwide, agrifood systems produced 16.2 billion tonnes of CO₂-equivalent in 2022, 29.7% of all emissions (FAO). About a third of the world’s soils are already degraded (FAO), and land degradation undermines the well-being of at least 3.2 billion people (IPBES).
None of this is abstract. It shows up as nitrogen and phosphorus applied to fields, methane released by rice paddies and cattle, and topsoil that washes off cropland every time it rains hard. The rest of this article breaks down each channel with the actual figures, names the agencies that track them, and shows what’s being done to reduce the numbers—on rice, dairy, cotton, and cocoa farms specifically, since those four crops illustrate the full range of agricultural environmental impact in one place.
Agriculture’s Environmental Footprint, By Number
Before drilling into any single cause, it helps to see the scale of each channel side by side. The verified-figures table in this article links each number to the agency that publishes it.
Figures carry the year they were measured, not the year you’re reading this. Where a source publishes updates on a schedule, that schedule is noted in the section covering it, so you can pull the current number instead of this one.
Agriculture’s Environmental Impact: Verified Figures
Each number below is linked to the body that publishes it. Years are the measurement year.
| Channel | Figure | Scope, year | Source |
|---|---|---|---|
| Greenhouse gases | 593.4 million metric tons CO₂e, 9.4% of US total | US, 2022 | EPA |
| Nitrous oxide | 308.0 million metric tons CO₂e, about 52% of US farm emissions | US, 2022 | EPA |
| Agrifood systems emissions | 16.2 billion tonnes CO₂e, 29.7% of global total | World, 2022 | FAO |
| Fertilizer and pesticides | About 12 million tons nitrogen, 4 million tons phosphorus, 0.5 million tons pesticides a year | Continental US | EPA |
| Cropland erosion | 2.67 tons per acre a year (water) plus 1.96 (wind) | US, 2017 | USDA NRI |
| Degraded soils | About one third | World | FAO |
| People hit by land degradation | At least 3.2 billion | World, 2018 | IPBES |
| Deforestation from farming | Almost 90% | World, 2021 survey | FAO |
| Freshwater withdrawals | 69% go to agriculture | World | FAO AQUASTAT |
Agriculture and Greenhouse Gas Emissions
In the US, agriculture emitted 593.4 million metric tons of CO₂-equivalent in 2022, or 9.4% of total US greenhouse gas emissions, per the EPA inventory. Counted as an economic sector, which adds on-farm energy use, EPA puts agriculture at about 11% (EPA). That’s not evenly split across gases. Nitrous oxide—produced mainly from synthetic fertilizer breaking down in soil and from manure management—made up 308.0 of those 593.4 million tons in 2022, about 52%, per the EPA 2024 GHG Inventory, Chapter 5. The remainder is mostly methane from livestock digestion (enteric fermentation) and manure, plus a small share of CO₂ from urea fertilization and liming.
EPA republishes the full US Inventory of Greenhouse Gas Emissions and Sinks every April at epa.gov/ghgemissions—so a reader checking this in 2027 or later should pull that year’s April release rather than rely on the 2022 figures above. That’s the durable method: the number will change, the publication date and cadence won’t.
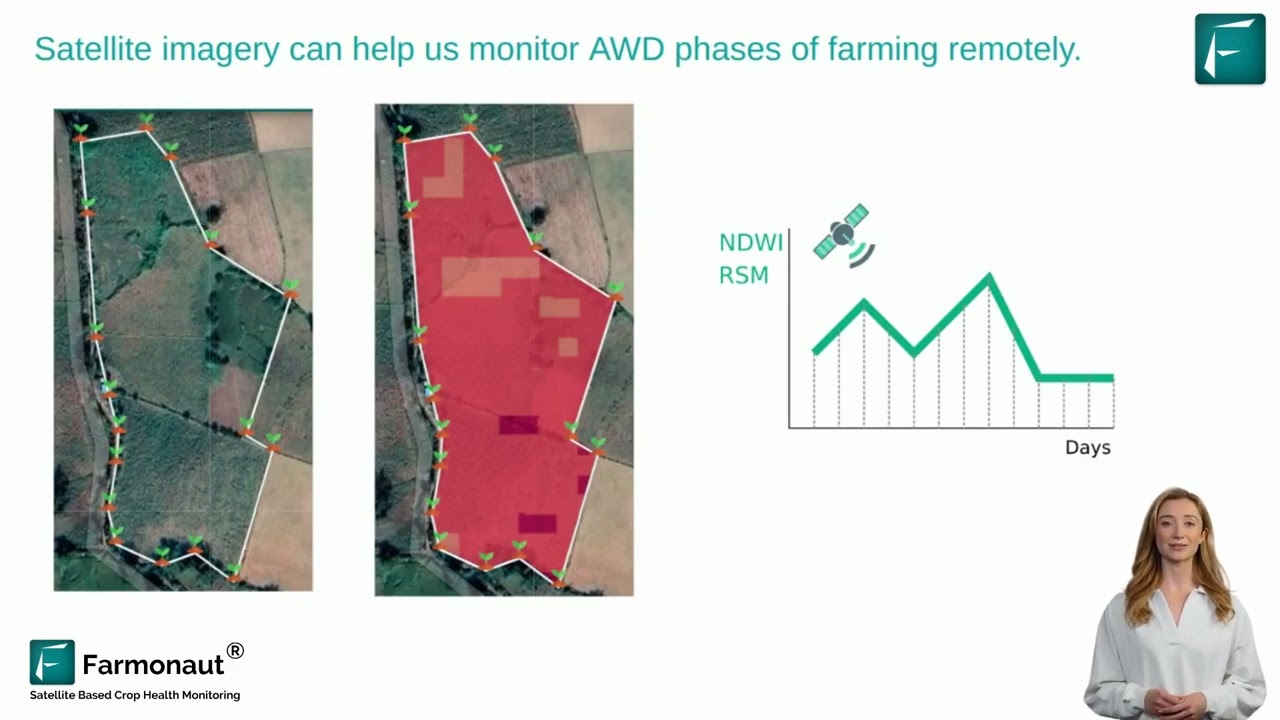
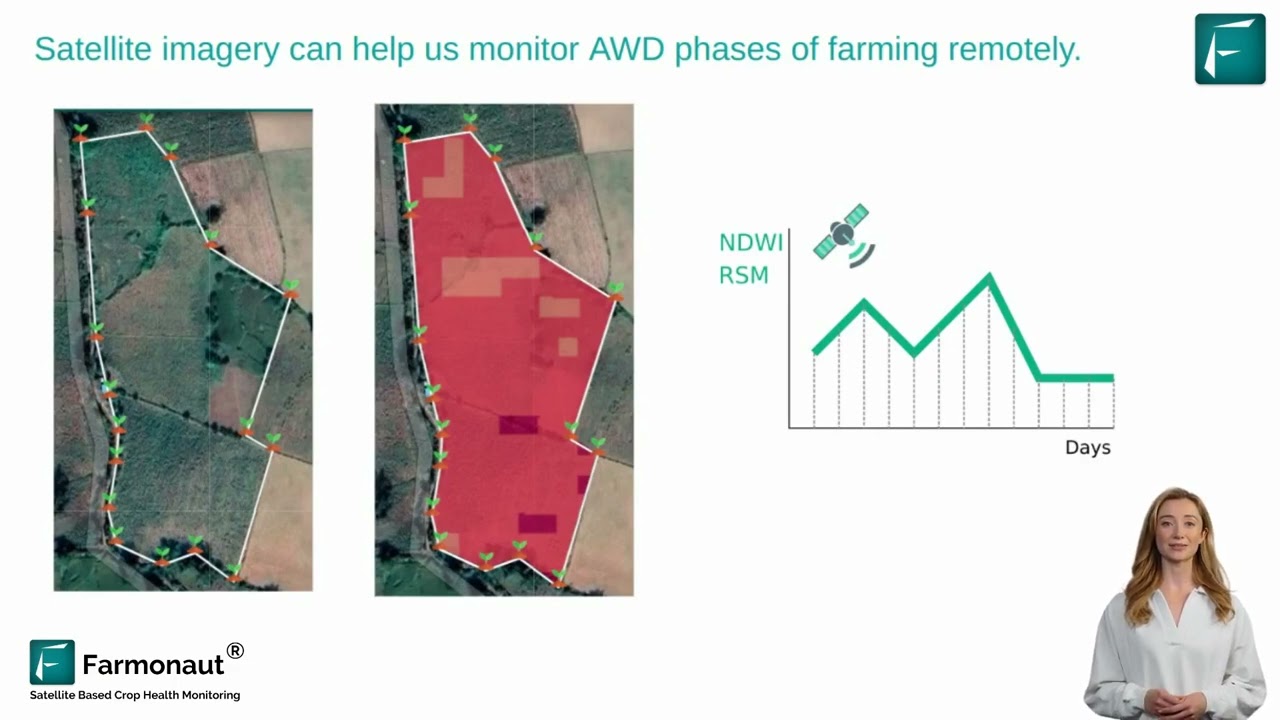
Rice paddies are one of the clearest single-source examples of agricultural methane. Flooded fields create anaerobic (oxygen-free) soil conditions where organic matter decomposes and releases methane instead of CO₂. Because methane traps far more heat per molecule than CO₂ over a 20-year window, rice paddies are treated as a priority target for mitigation in national greenhouse gas inventories, alongside cattle. Alternate Wetting and Drying (AWD)—letting a paddy dry out between floods rather than staying continuously submerged—cuts the time soil spends in that anaerobic state, which is why it appears in USDA and international mitigation guidance as a leading practice for rice-growing regions, including US rice states such as Arkansas, California and Louisiana.
Fertilizer, Pesticides, and Water Pollution
About 12 million tons of nitrogen, 4 million tons of phosphorus fertilizer and half a million tons of pesticides are applied to crops in the continental US each year, according to the EPA nonpoint source agriculture page, which also names agricultural runoff as the leading cause of water-quality impacts on surveyed rivers and streams. Applied at the field level, these inputs raise yields; the environmental cost shows up downstream, when excess nitrogen and phosphorus that crops don’t take up washes into streams, rivers, and eventually larger water bodies.
Once in the water, surplus nutrients feed explosive algae growth. When that algae dies and decomposes, the process consumes dissolved oxygen faster than it’s replaced, creating hypoxic “dead zones” that fish and other aquatic life can’t survive in—the same eutrophication mechanism regulators cite when restricting fertilizer application near sensitive waterways.

On the US side, USDA NASS runs the Agricultural Chemical Usage Survey and publishes detailed commodity- and state-level nitrogen, phosphorus, and pesticide application data at nass.usda.gov (search “Agricultural Chemical Use”). That’s the source to check for a number more current than the EPA totals cited here.
Where Cotton Fits the Pesticide Picture
Cotton is the sharpest illustration of concentrated pesticide use in a single crop: it covers about 2.4% of the world’s cultivated land but used 4.7% of the world’s pesticides and 10% of its insecticides in 2019, according to International Cotton Advisory Committee figures cited by PAN UK. Water use is high too: a Water Footprint Network study put the global average water footprint of a 1 kg pair of jeans at about 10,850 liters, including water needed to dilute pollution. In major producing regions, inefficient flood irrigation compounds the problem by causing waterlogging and salinization, which degrades the same soil the crop depends on.


Integrated Pest Management (IPM) and drip irrigation are the two interventions with the most consistent track record for cutting both numbers at once: IPM reduces blanket pesticide application by targeting only actual pest thresholds, and drip irrigation delivers water directly to the root zone instead of flooding the field, cutting both water waste and the runoff that carries chemical residue into local waterways.
Freshwater Use: How Much Water Agriculture Takes
Agriculture is the largest user of fresh water. At global level, 69% of water withdrawals go to agriculture, 12% to municipalities and 19% to industry, according to FAO AQUASTAT. Agriculture here includes irrigation, livestock watering and aquaculture.
The share varies widely by region. AQUASTAT puts agriculture at 91% of withdrawals in South Asia and more than 80% in Africa and Asia, against about 5% in Western Europe, where industry takes most of the water. Between 1900 and 2010, global water withdrawal grew 630%, faster than population.
Heavy withdrawal causes two problems. Rivers and aquifers are drawn down faster than they refill, and water that returns from fields carries fertilizer, pesticide and sediment with it. The US EPA names agricultural runoff as the leading cause of water-quality impacts on surveyed rivers and streams.
The practical fixes are the same ones that cut runoff: drip or sprinkler irrigation instead of flooding, irrigation scheduled to measured soil moisture or crop stress rather than a calendar, and keeping cover on the soil so rain soaks in instead of running off.
Soil Erosion and Land Degradation
Erosion rates on US cropland fell 35% between 1982 and 2017, but in 2017 cropland still lost an average of 2.67 tons of soil per acre a year to water (sheet and rill) erosion and 1.96 tons to wind, according to the 2017 National Resources Inventory. The National Resources Inventory is conducted on a multi-year cycle rather than annually, so those are the most recent nationally representative figures available; check the NRCS National Resources Inventory pages for whichever cycle has been published most recently when you read this.
Globally, FAO says about a third of soils are already degraded and that erosion could cut crop production by 10% by 2050 (FAO). A separate 2018 assessment by IPBES found that land degradation undermines the well-being of at least 3.2 billion people. The three drivers behind most of that decline are consistent across regions: loss of organic matter from continuous tillage, erosion that strips topsoil faster than it can regenerate, and nutrient depletion from harvesting crops without adequately replenishing the soil.
Monoculture cropping—growing the same crop on the same land year after year, common in both cotton and cocoa systems—accelerates this by depleting the same nutrients repeatedly and leaving soil structure less resilient to wind and rain between growing seasons. Reduced or no-till farming, cover cropping, and crop rotation are the standard countermeasures cited across USDA conservation programs; the common thread is keeping living roots or residue in the soil year-round rather than leaving it bare.

Deforestation and Biodiversity Loss
Agriculture—cropland expansion and pasture combined—drives almost 90% of global deforestation, according to FAO’s 2021 Global Remote Sensing Survey: cropland accounts for more than half of forest loss and livestock grazing for almost 40%. Cocoa is one of the clearest examples: it’s grown mainly in tropical forest zones of West Africa, Southeast Asia, and South America, and expansion of cocoa acreage is frequently achieved by clearing standing forest rather than replanting on already-cleared land.
Clearing forest for cropland does two things at once: it releases the carbon stored in trees and soil, and it removes a carbon sink that would otherwise keep absorbing CO₂ going forward. Smallholder cocoa farms that rely on slash-and-burn clearing compound this—burning destroys soil structure and organic matter on top of the immediate carbon release, which is part of why soil fertility on newly cleared cocoa land often declines within a few growing cycles, pushing farmers to clear further forest rather than restore what they have.
The research gathered for this article didn’t turn up a specific, sourced figure for species decline or habitat-loss rate attributable to agriculture specifically (as opposed to deforestation broadly); if that number matters for your use case, IUCN’s Red List assessments and FAO’s State of the World’s Forests reports are the primary places to look for species- and region-specific data.
What’s Working: Agroforestry and Certification
- Agroforestry: Growing cocoa under native shade trees rather than in cleared monoculture rows maintains wildlife corridors and keeps more of the original forest structure intact.
- Certification programs: Standards such as Rainforest Alliance and Fair Trade give buyers a way to pay a premium for verified non-deforestation practices, creating an economic incentive that pure regulation doesn’t.
- Buffer zones: Leaving intact forest strips around cultivated plots preserves the ecosystem services (pollination, water regulation, pest predators) that surrounding farms depend on.
- Satellite monitoring: Continuous imagery makes it possible to detect illegal forest-edge expansion within days rather than during an annual audit, which is the practical difference between catching encroachment early and finding out a year later.
For growers, NGOs, and governments running reforestation or buffer-zone programs, the Farmonaut Crop Plantation & Forest Advisory tracks whether restoration and buffer planting is actually holding up over time, rather than relying on a one-time site visit.
How Specific Crops Compare: Rice, Dairy, Cotton, Cocoa
Zooming out from any single channel, four crops illustrate how differently environmental impact concentrates depending on what’s being grown. In broad terms, rice concentrates its impact in methane and water, dairy in enteric methane and manure, cotton in pesticides and irrigation water, and cocoa in deforestation and soil loss from clearing.
Dairy: Enteric Fermentation and Manure
Dairy farming’s footprint runs through methane from cattle digestion (enteric fermentation), nitrous oxide and methane from manure decomposition, and the feed-crop inputs—maize, alfalfa—grown to support herds. Because nitrous oxide made up about half of US agricultural GHG emissions in 2022 per the EPA, and part of that traces back to manure and fertilized feed crops, dairy operations sit at the intersection of two of the largest emission categories at once, not just one.
Feed efficiency improvements, anaerobic digesters that capture manure methane and convert it to usable energy, rotational grazing that lets pasture soil recover between cycles, and seaweed-based feed supplements under active testing for methane suppression are the four practices most commonly cited in extension guidance for reducing dairy’s footprint per unit of milk produced.
Farmonaut’s carbon footprinting solution, detailed at the Carbon Footprinting product page, helps livestock operations measure and track emissions against a baseline rather than estimate them after the fact. For operations managing transport and logistics across the dairy value chain, Farmonaut’s fleet management system reduces fuel waste in vehicle routing, which is a smaller but real slice of the sector’s overall emissions.
Calculator: Estimate Your Field’s Annual Nitrogen Runoff Risk
Nitrogen runoff risk scales with how much fertilizer you apply per acre, how much of that your crop actually takes up, and how much rainfall moves the surplus off the field. Enter your own numbers below — this does not use a hardcoded national average.
Run your own numbers
Assumptions: this excludes soil type, tile drainage, cover cropping, and split-application timing, all of which materially change real-world runoff. It scales unused nitrogen (applied minus crop uptake) by a rainfall factor and a slope multiplier to produce a relative risk score, not a regulatory or lab-tested runoff volume. Use it to compare scenarios on your own field, not to benchmark against another farm.
How Farmonaut Helps Reduce These Impacts
Every channel described above—emissions, fertilizer runoff, erosion, deforestation—responds to the same underlying fix: knowing what's happening on a specific field before it becomes a measured loss, rather than after. That's the gap satellite monitoring and precision tools are built to close.
- Satellite-Based Monitoring: Multispectral imagery and AI track crop health, soil moisture, and waterlogging or drought stress across a field, so irrigation and fertilizer application can be adjusted to actual crop need instead of a flat schedule.
- AI Advisory (JEEVN AI): Site-specific recommendations aimed at cutting input costs and the emissions tied to over-application.
- Blockchain Traceability: For food brands, processors, and textile producers, the Traceability system verifies sustainability claims through the supply chain rather than leaving them self-reported.
- Carbon Footprinting: Measures and tracks farm-level emissions against a baseline for ESG reporting and regulatory compliance, at the Carbon Footprinting page.
- Fleet & Resource Management: Reduces diesel use and associated emissions in tractor and irrigation-equipment operation via the Fleet Management product page.
- APIs and Integrations: Satellite and weather data can be integrated directly into third-party platforms via the API, documented at the API Developer Docs.

Cotton, Traceability, and Sustainable Sourcing
For textile companies needing to verify that cotton in their supply chain was grown under lower-input practices, the same Farmonaut Traceability system ties field-level monitoring data to the finished product, which is the practical difference between a sustainability claim and a sustainability record. For cocoa specifically, growers can also draw on the sustainable cocoa farming techniques guide covering seven practices that reduce the deforestation and soil-loss risks described above.
Access Farmonaut's Tools



FAQ
How does agriculture affect the environment overall?
Through six main channels: greenhouse gas emissions (9.4% of the US total in 2022, per EPA), fertilizer and pesticide runoff into waterways, soil erosion (2.67 tons per acre a year by water on US cropland in 2017), deforestation (agriculture drives almost 90% of it globally, per FAO), freshwater use (69% of global withdrawals, per FAO AQUASTAT), and biodiversity loss from monoculture cropping.
What percentage of US greenhouse gas emissions come from agriculture?
9.4% in 2022, or 593.4 million metric tons of CO₂-equivalent, according to the EPA greenhouse gas inventory. Counted as an economic sector, which adds on-farm energy use, EPA puts agriculture at about 11%. EPA republishes updated figures every April; check the current release rather than assume this figure still holds.
What are the main effects of farming on soil?
Erosion, loss of organic matter, and nutrient depletion. US cultivated cropland lost 1.6 billion tons of soil to water and wind erosion in 2012, and 18% of it was still experiencing water-driven erosion as of 2017 (USDA National Resources Inventory). Globally, FAO estimates 75% of soils are in fair, poor, or very poor condition.
How much fertilizer and pesticide does US agriculture use each year?
About 12 million tons of nitrogen, 4 million tons of phosphorus fertilizer and 0.5 million tons of pesticides a year across continental US crops, per the EPA. For a state- or commodity-level breakdown, see the USDA NASS Agricultural Chemical Use surveys.
Does agriculture cause deforestation?
Yes—agriculture (cropland expansion and pasture combined) drives almost 90% of global deforestation, according to FAO's 2021 Remote Sensing Survey. Cropland causes more than half of forest loss and livestock grazing almost 40%; in South America, grazing accounts for almost three quarters.
Can satellite technology reduce agriculture's environmental footprint?
Yes. Satellite imagery enables real-time crop and soil monitoring, detection of nutrient deficiencies, drought stress, and pest pressure, letting growers apply water, fertilizer, and pesticide only where and when the crop actually needs it—directly reducing the runoff and emissions tied to over-application.
Which crops have the largest environmental footprint?
It depends on the channel measured. Cattle are the largest source of agricultural methane: beef cattle made up 71% and dairy cattle 25% of US enteric methane in 2022, per EPA. Flooded rice adds a smaller methane share; cotton is pesticide-intensive, using about 10% of global insecticides on 2.4% of cultivated land in 2019; cocoa expansion is linked to tropical forest clearing.




Conclusion
Agriculture's environmental impact isn't one number — it's six measurable channels, each with its own agency tracking it, its own publication schedule, and its own fix already in use somewhere. US agriculture emitted 593.4 million metric tons of CO₂-equivalent in 2022 (9.4% of the national total), applies about 16 million tons of nitrogen and phosphorus fertilizer a year, still loses several tons of soil per cropland acre each year, and sits inside a global food system where agriculture drives almost 90% of deforestation. None of those figures are static, and none of them are hidden: EPA, USDA and FAO publish them on a recurring schedule, cited throughout this piece specifically so the numbers can be checked and updated rather than taken on faith.
The fixes that move those numbers are already documented and in use: Alternate Wetting and Drying in rice, feed efficiency and manure management in dairy, drip irrigation and Integrated Pest Management in cotton, agroforestry and certification in cocoa. What connects all of them is measurement at the field level — knowing nitrogen uptake, soil moisture, and canopy stress before an input decision, not after a runoff event or a yield loss. That's the layer satellite monitoring and precision tools are built to add.

 Geospatial Lab Africa
 KhetiBuddy
 Agro La Gándara
 Global Agrifood
 HIPSAC
 ZOL Zimbabwe
 Juligerm
 AdBio
AdBio MISE Maroc
 NWNS
NWNS Red August Group
 Farm Inc
 WeMe Global
 Agrotoken
 Blue BearX
 Insignito
 Croptimum
 DnCubed
 Field Capacity
 Indosistim Teknologi
