

Reviewed September 2026 against USDA Economic Research Service and the Association of Equipment Manufacturers (AEM).
Try it: Run your own numbers →
Farm automation is not a future promise in the United States—it is already running on most large crop operations. USDA Economic Research Service data put GPS guidance and autosteering on 70% of large-scale crop farms and 52% of midsize crop farms in 2023, and a 2025 USDA update shows those figures still hold at 68% and 50% respectively. This article walks through what automation in agriculture actually looks like on US farms today, what it costs, what it saves, and how to decide what to automate next on your own operation.
Table of Contents
- Farm Automation Adoption: What USDA’s Numbers Actually Show
- 7 Automation Systems Used on US Farms
- Comparison Table: Farm Automation Technologies & Impact
- Calculator: Estimate Your Farm’s Automation ROI
- Satellite-Based Automation: Where Farmonaut Fits
- Automation by Farm Size: A Practical Roadmap
- Video Spotlight: Farm Automation in Action
- Farmonaut Tech Solutions, Apps & API Links
- FAQ: Farm Automation Systems
- Where Farm Automation Adoption Goes From Here
Farm Automation Adoption: What USDA’s Numbers Actually Show
Ask “how common is farm automation, really?” and most articles answer with adjectives. USDA answers with counts. In 2023, USDA ERS reported that 27% of US farms had adopted some form of precision agriculture technology (USDA ERS, Precision Agriculture Adoption Rates). That is not evenly spread: adoption clusters hard by farm size and by crop. GPS guidance and autosteering—the single most widely used farm automation system—was already on 58% of US corn acres back in 2016 (USDA ERS Charts of Note), and by 2023 that had become 70% of large-scale crop farms and 52% of midsize crop farms overall, per USDA’s chart-of-note update (pubid tracked at chartId=110550). The 2025 edition of USDA’s America’s Farms and Ranches at a Glance shows those adoption rates holding steady at 68% (large-scale) and 50% (midsize), alongside a broadband connectivity figure of 55% of US farms in 2025 (USDA, America’s Farms and Ranches at a Glance: 2024 Edition).
Livestock automation tells a narrower story. Robotic milking reached only 6% of US milk production by 2021, but on mid-sized dairies of 150–499 head, 13% had already adopted robotic milkers (USDA ERS Charts of Note)—a size band where the labor math works out differently than on either very small or very large operations. That gap between “widespread on row crops” and “narrow on dairy” is the most useful single fact in this article: automation adoption is not one number, it is a size-and-sector-specific number, and any claim that skips that distinction is worth distrusting.
These figures update on USDA’s own schedule, not a fixed annual date. GPS guidance and autosteering numbers are refreshed periodically in USDA ERS’s Charts of Note series (ers.usda.gov/data-products/charts-of-note), and broader technology-use rates appear in USDA NASS’s annual “Agricultural Technology Use” survey, published each spring at nass.usda.gov. If you’re citing an adoption percentage for a grant application, a board presentation, or a lender, pull the current release rather than reusing the figures above past their vintage.
7 Automation Systems Used on US Farms
These are the seven categories of automation in farming most commonly deployed on US operations today, ordered roughly by how widely each has been adopted.
-
1. GPS Guidance and Autosteering
This is the most-adopted farm equipment automation category by a wide margin. USDA ERS data shows 70% of large-scale crop farms and 52% of midsize crop farms running guidance/autosteering systems in 2023, holding at 68% and 50% in the 2025 update (USDA, America’s Farms and Ranches at a Glance). On corn specifically, USDA ERS clocked 58% of acres under GPS guidance as early as 2016 (USDA ERS Charts of Note)—meaning this technology crossed the majority-adoption threshold on America’s largest row crop close to a decade before most of the other categories on this list.
- 🚜 Reduces overlap and skips in planting, spraying, and tillage passes
- 📈 Fastest-adopted category of any farm automation system tracked by USDA
- Try it: Run your own numbers

Discover how fleet analytics extend guidance-system data into full operations: Farmonaut’s fleet management platform uses telemetry and satellite data to track equipment, streamline operations, and optimize machinery use.
-
2. Variable-Rate Technology (VRT) for Inputs
VRT applies fertilizer, seed, or crop protection at a rate that changes across the field rather than a flat rate for the whole pass. AEM’s 2023 study quantified the payoff directly: farms managing 1,000 acres with VRT saved an average of $20,000 annually on fertilizer costs, alongside an 8% reduction in fertilizer application and a 9% reduction in herbicide application compared with flat-rate practice (Association of Equipment Manufacturers).
- 💰 $20,000/year in fertilizer savings per 1,000 acres, per AEM’s 2023 figures
- 📉 8% less fertilizer, 9% less herbicide applied for the same or better yield outcome

Farmonaut’s carbon footprinting and traceability tools layer satellite imagery, AI, and blockchain on top of VRT data to document exactly how much input actually went on the field.
-
3. Drone-Based Crop Surveillance
Multispectral drone imagery flags pest pressure, water stress, and nutrient deficiency at a resolution ground scouting misses, and lets a crew treat only the affected acres instead of the whole field.
- 🚁 Covers hundreds of acres per flight versus walking transects
- 💡 Enables site-specific treatment, which is what drives the input reductions AEM measured under VRT above

-
4. Autonomous and GPS-Guided Field Machinery
Beyond basic autosteering, a growing share of large-scale operations run semi-autonomous tractors and combines for plowing, seeding, and harvest passes, cutting the operator-hours needed per acre during the narrow planting and harvest windows when timing drives yield.
- 🕒 Extends effective work hours during critical planting/harvest windows without adding labor
- 🎯 Consistency gains compound with the guidance-system adoption already covered above
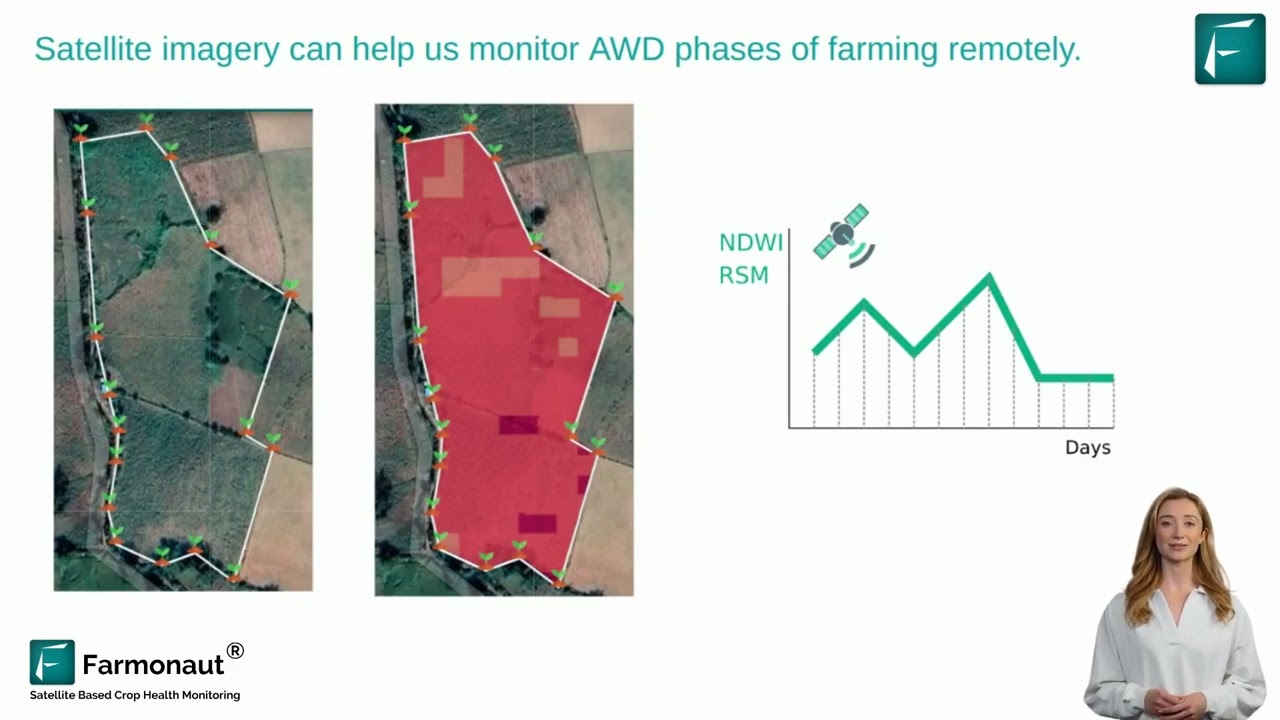
Pair machinery automation with large-scale farm management solutions for a single dashboard view of every pass across every field.
-
5. Robotic Milking Systems
Robotic milkers remain the clearest example of automation that is real but narrow: 6% of US milk production ran through robotic systems in 2021, concentrated on mid-sized dairies where 13% of 150–499 head operations had adopted them (USDA ERS Charts of Note). That size-specific concentration is the story: robotic milking solves a labor-scheduling problem that hits mid-sized dairies hardest, since they are too large for an owner-operator to milk alone and too small to run multiple shifts of hired labor economically.
- 🐄 13% adoption on 150–499 head dairies versus 6% sector-wide
- ⏱ Removes fixed milking-shift labor, the specific bottleneck this farm size faces
-
6. AI-Driven Advisory Platforms
Software that combines satellite imagery, weather forecasts, and soil data to recommend sowing, irrigation, and fertilization timing is the fastest-growing category by connectivity dependency: it requires the broadband access that reached 55% of US farms in 2025 (USDA, America’s Farms and Ranches at a Glance), which is also the practical ceiling on how fast this category can grow until rural connectivity closes the remaining 45% gap.
- 📡 55% broadband coverage on US farms in 2025 is the binding constraint on this category’s growth
- 🌟 Compounds with VRT by turning imagery into an actual rate map instead of a static report

Integrate advisory data via API: Farmonaut’s Satellite Weather API feeds predictive analytics directly into farm management software.
-
7. Blockchain Traceability and Supply Chain Documentation
Traceability systems record input use and provenance at each supply-chain step, which increasingly matters for buyers who require documented practice data rather than a grower’s word for it.
- 🔍 Traces input use against the VRT and drone-treatment records above, rather than as a standalone system
- 🔑 Supports buyer documentation requirements that are becoming standard in some procurement contracts

Learn more about traceability solutions by Farmonaut.
Comparison Table: Farm Automation Technologies & Impact
| Automation System | US Adoption Rate | Measured Financial or Input Impact | Source & Vintage |
|---|---|---|---|
| GPS Guidance / Autosteering (large-scale crop farms) | 68% (2025) | Reduces input overlap on planting/spraying passes | USDA, pubid=110559 |
| GPS Guidance / Autosteering (midsize crop farms) | 50% (2025) | Same category, smaller-scale adoption | USDA, pubid=110559 |
| Variable-Rate Technology (fertilizer) | Component of 27% precision ag adoption (2023) | $20,000/year fertilizer savings per 1,000 acres; 8% less fertilizer applied | AEM, 2023 |
| Variable-Rate Technology (herbicide) | Component of 27% precision ag adoption (2023) | 9% reduction in herbicide application | AEM, 2023 |
| Yield-driven automation (general precision ag) | 27% of US farms (2023) | $66,000 additional annual revenue per 1,000 corn acres from a 5% yield gain | AEM, 2023 |
| Robotic Milking (all US dairy) | 6% of milk production (2021) | Removes fixed milking-shift labor requirement | USDA ERS, 114194 |
| Robotic Milking (150-499 head dairies) | 13% (2021) | Concentrated on the labor-scheduling pinch point of mid-sized herds | USDA ERS, 114194 |
| Farm Broadband Connectivity | 55% of US farms (2025) | Practical ceiling on AI-advisory and cloud-based automation adoption | USDA, pubid=110559 |
Calculator: Estimate Your Farm’s Automation ROI
The figures above are national averages; your own acreage, current input spend, and yield are what actually determine payback. Use the calculator below to scale AEM’s 2023 per-1,000-acre benchmarks to your operation.
Run your own numbers
Assumptions: yield-gain revenue and VRT savings scale linearly from AEM’s 2023 per-1,000-acre benchmarks ($66,000 revenue at a 5% yield gain; $20,000 fertilizer savings under VRT). It excludes financing costs, equipment maintenance, subscription fees, and crop-price volatility—adjust the revenue input to reflect your own crop and local price if it differs from the benchmark.
Satellite-Based Automation: Where Farmonaut Fits
Not every farm can justify the capital cost of autonomous machinery or robotic milkers. Satellite-based monitoring is the automation layer that scales down to smallholders and up to multi-state operations without a matching jump in hardware spend. Farmonaut’s platform applies this layer specifically:
- 🌍 Satellite Technology: Real-time crop health assessments (NDVI), soil condition analysis, and environmental impact monitoring.
- 🤖 Jeevn AI Advisory: Farm-specific recommendations driven by machine learning and weather forecasting.
- 🔗 Blockchain Traceability: Supply chain documentation for crop provenance.
- 🛠️ Fleet & Resource Management: Oversight of machinery, logistics, and resource allocation.
- 🛰️ Environmental Impact Monitoring: Tracking of carbon emissions and other environmental metrics.
A developer API is also available so partners can integrate satellite and weather data directly into their own farm management software.
Automation by Farm Size: A Practical Roadmap
USDA’s split between large-scale (68%) and midsize (50%) guidance adoption, and between 6% sector-wide and 13% mid-sized-dairy robotic milking adoption, both point to the same lesson: automation adoption should follow farm size and labor bottleneck, not a generic checklist. For large commercial farms, full-suite automation across guidance, VRT, and fleet telemetry is already the majority practice. For smaller operations, modular subscription tools—such as remote crop verification for loan and insurance purposes—provide a lower-capital entry point into the same data layer.
Automation Adoption Roadmap by Scale
- 1️⃣ Start with satellite or IoT-based crop monitoring—no hardware purchase required
- 2️⃣ Add GPS guidance/autosteering if row-crop acreage justifies it—already majority-adopted at your farm size per USDA data above
- 3️⃣ Layer in variable-rate technology once monitoring data is reliable enough to build a rate map from
- 4️⃣ Add drones or autonomous machinery as scale and labor-shortage pressure justify the capital cost
- 5️⃣ Add traceability documentation if buyers or certification programs require it
Video Spotlight: Farm Automation in Action
These videos show the automation categories above in practical use:


Farmonaut Tech Solutions, Apps & API Links
- ✔ Fleet Management: Track agricultural machinery and logistics with satellite-linked analytics.
- ✔ Carbon Footprinting: Monitor environmental impact and certification data.
- ✔ Traceability: Blockchain-based provenance for agricultural produce.
- ✔ Large Scale Farm Management: Multi-field satellite and AI-driven monitoring.
- ✔ API Developer Docs: Satellite, weather, and analytics integration.
FAQ: Farm Automation Systems
Q1: What percentage of US farms use automation?
27% of US farms had adopted some form of precision agriculture technology as of 2023, per USDA ERS (pubid=105893). Adoption is much higher for specific technologies on specific farm sizes—68% of large-scale crop farms use GPS guidance/autosteering as of the 2025 USDA update.
Q2: Is farm automation only for large-scale farms?
No, but adoption does skew that way for capital-intensive systems: USDA’s 2025 data show 68% adoption of guidance systems on large-scale crop farms versus 50% on midsize farms. Lower-capital options—satellite monitoring, subscription-based advisory tools—are used across farm sizes and do not require the same equipment investment.
Q3: What is the ROI on farm automation technology?
AEM’s 2023 study found $66,000 in additional annual revenue per 1,000 corn acres from a 5% yield increase, plus $20,000 in annual fertilizer savings per 1,000 acres under variable-rate technology (Association of Equipment Manufacturers). Use the calculator above to scale these to your own acreage.
Q4: How common are robotic milking systems in the US?
6% of US milk production came from robotic milking systems in 2021, concentrated on mid-sized dairies: 13% of 150–499 head operations had adopted them by that year (USDA ERS Charts of Note).
Q5: Does farm automation reduce fertilizer and pesticide use?
AEM’s 2023 study measured an 8% reduction in fertilizer application and a 9% reduction in herbicide application on farms using precision agriculture and variable-rate technology, compared with flat-rate practice.
Q6: What’s holding back automated agriculture system adoption in the US?
Broadband connectivity is one measurable constraint: only 55% of US farms had a broadband connection in 2025, per USDA. Cloud-based advisory and monitoring tools depend on that connectivity, which caps how fast this category can grow independent of hardware cost.
Where Farm Automation Adoption Goes From Here
The USDA and AEM figures above describe a specific moment—2021 for dairy robotics, 2023 for precision-ag adoption and AEM’s cost study, 2025 for the latest guidance-system and broadband numbers. What will change these numbers going forward is broadband buildout (currently the binding constraint on AI-advisory adoption at 55% coverage) and the ongoing cost curve of GPS and sensor hardware relative to labor cost, which is what has already pushed autosteering past 50% adoption on midsize crop farms. Track the current figures at USDA ERS’s Charts of Note series and NASS’s annual Agricultural Technology Use survey rather than treating any single year’s numbers as fixed.
For your own operation, the actionable path is the roadmap above: start with the lowest-capital monitoring layer, add guidance and variable-rate systems once acreage justifies the investment, and use the calculator to check payback before committing capital to any single system.
Farmonaut Subscription Options
Flexible subscription plans provide access to satellite data and IoT insights for automated farm monitoring.

 Dirks Bros Farms
 Red August Group
 Farm Inc
 WeMe Global
 Pixxel
 Agrotoken
 Blue BearX
 Insignito
 Croptimum
 DnCubed
 Field Capacity
 Indosistim Teknologi
 Liquify Digital
 CU Foods
 BeyondTech Global
 Rouge VC
 AgroGreen Dynamics
 AgroRisk
 Oath Inc
