

Farm machinery · Market data
Haying and Forage Machinery Market: Size and US Demand
Market Research Future sizes the global haying and forage machinery market at $20.4 billion to $22.0 billion for 2025. Other firms count fewer machines and land far lower. Here are the forecasts side by side, US tractor sales and hay stocks for 2026, and a calculator for baler capacity.
Key takeaways
- Market Research Future: $20.43 billion in 2025 to $25.0 billion by 2035; its broader agricultural report: $22.0 billion to $31.52 billion.
- Narrower studies are lower: Global Market Insights $13.2 billion and Future Market Insights $14.2 billion by 2035.
- AEM: US tractor sales fell 16.4% and combine sales 10.9% in September 2026; year to date down 12.6% and 9.4%.
- USDA NASS: 23.3 million tons of hay on US farms on May 1, 2026, down 3% on a year earlier.
- USDA ERS forecasts 2026 net farm income at $158.4 billion, down 5.5% after inflation, which weighs on new machine buying.
In this article
- How big is the agricultural haying and forage machinery market?
- US demand right now: tractor and combine sales
- US hay supply: what USDA's stocks report shows
- Equipment inside the market and how to size it
- Buying new or used: what the numbers mean for your farm
- Forage quality: why tested hay is worth more
- Precision agriculture tools for tracking the season
- Storage, pests and weather risk after baling
- Pasture management and the forage analysis market
- How to track this market over time
- FAQ
The global agricultural haying and forage machinery market was worth about $20 billion to $22 billion in 2025, according to two Market Research Future reports. Forecasts for 2035 run from $13 billion to $32 billion, because each research firm counts different machines. Below we compare the main estimates side by side, show what US sales and hay stocks say about demand right now, and give a calculator to check whether one baler can clear your fields before the weather turns.
Every figure on this page carries its date and its source. Market reports are refreshed often, so use the method here as much as the numbers.
How big is the agricultural haying and forage machinery market?
“Haying and forage machinery,” “hay making machinery” and “hay forage equipment” all describe one group of machines: mowers and mower-conditioners, rakes, tedders, balers and forage harvesters. The size you see depends on the publisher and on whether silage equipment, spare parts and tractors used for haying are counted.
| Report | 2024 or 2025 size | 2035 forecast | Growth per year |
|---|---|---|---|
| MRFR haying and forage | $20.02B (2024), $20.43B (2025) | $25.0B | 2.04% |
| MRFR agricultural haying | $21.22B (2024), $22.0B (2025) | $31.52B | 3.66% |
| Global Market Insights | $7.70B (2025) | $13.20B | 5.9% (2026–2035) |
| Future Market Insights | $9.5B (2025) | $14.2B | 4.1% |
The two Market Research Future reports give $20.02 billion for 2024 rising to $25.0 billion by 2035 (haying and forage machinery report), and $21.22 billion for 2024 rising to $31.52 billion by 2035 (agricultural haying and forage machinery report). Narrower studies come in much lower. Global Market Insights puts haying and forage equipment at $7.70 billion in 2025 and $13.20 billion by 2035. Future Market Insights gives $9.5 billion in 2025 and $14.2 billion by 2035.
So the gap is a definition gap, not a typo. If you quote one number, quote the publisher and the year with it. If you compare years, stay inside one publisher’s series.
Is there a United States figure?
The public summaries of these reports do not give a stand-alone United States size. They group the US with Canada and Mexico as North America. The closest public, US-only measure of demand is the monthly retail sales count from the Association of Equipment Manufacturers (AEM), covered in the next section.
Sub-segments: balers, mowers and forage harvesters
Searches for a “hay forage baling equipment market” or a “hay forage harvesting equipment market” point to slices of the same reports, not separate studies. The detailed splits by machine type sit behind each publisher’s paid report, so check the date of any split you see quoted elsewhere. Self-propelled forage harvesters are among the costliest machines in the group, so a few large units can move a regional total.
Chart
2035 forecasts for haying and forage machinery
US$ billion, global, by publisher and report definition
US demand right now: tractor and combine sales
AEM publishes a monthly US Ag Tractor and Combine Report built from member retail sales. It does not count balers or mowers, but tractors pull most hay tools, so it is a good early signal for the haying side of the market.
The trend in 2026 has been down. AEM reported that US combine sales fell 25.3% and farm tractor sales fell 9.1% year over year in March 2026. In September 2026, tractor sales fell 16.4% to 15,024 units and combine sales fell 10.9% to 369 units, RFD-TV reported from AEM data. Year to date through September, tractors were down 12.6% and combines down 9.4%.
Every tractor size class fell in September. Four-wheel-drive tractors dropped the most, and the 40 to 100 horsepower class, which pulls many mid-size balers and mower-conditioners, fell 18.7%.
Farm income explains much of this. The USDA Economic Research Service forecasts 2026 net farm income at $158.4 billion, down $9.1 billion (5.5%) from 2025 after adjusting for inflation. When margins tighten, many farms keep older machines longer and buy used.
Is there a harvester production forecast?
No US agency publishes a unit-by-unit harvester production forecast. Use AEM’s monthly retail numbers as a leading sign. For maker-level views, read the quarterly outlooks that Deere & Company, AGCO and CNH Industrial give with their earnings results.
Chart
US sales change, September 2026 vs September 2025
Percent change in retail units, by machine class
US hay supply: what USDA’s stocks report shows
Hay on hand shapes how hard machines must work next season. USDA’s National Agricultural Statistics Service (NASS) reported 23.3 million tons of hay on US farms on May 1, 2026, down 3% from May 1, 2025. Disappearance from December 1, 2025 to May 1, 2026 was 58.4 million tons, up 2%.
The national number hides big state swings. Texas fell from 3.0 million to 2.0 million tons, while Kansas and Oklahoma both rose sharply. Low carryover in a state means growers there have less room to miss a good cutting window, so mower and baler capacity matters more.
NASS reports May 1 hay stocks in its May Crop Production report and December 1 stocks in its January Crop Production report. Check the latest release before you reuse the May figure.
Chart
Hay stocks on farms, May 1: selected states
Thousand tons, eight large hay-holding states
Equipment inside the market and how to size it
Each machine in the hay chain has one job and one bottleneck:
- Mowers and mower-conditioners: set how many acres go down per day. Conditioning crimps stems so they dry faster.
- Tedders and rakes: spread and turn the swath to speed drying, then gather it into a windrow for the baler.
- Balers: round, small square or large square. Throughput, in bales or tons per hour, often decides whether the field is cleared before rain.
- Forage harvesters: pull-type or self-propelled, used for silage and haylage. They need trucks and packing gear sized to match.
On the silage side, the well-tested targets are corn silage at about 30–35% whole-plant dry matter, a short chop length, fast filling and packing, and an airtight cover. All of that depends on the harvester and packing equipment matching the acreage and the weather window. A good harvest week is short, so equipment capacity is often the real limit, not acres.
Use the calculator below to compare your baler’s capacity with the bales your field will make. The defaults are examples only, set close to break-even, so change every number to match your farm.
Try the numbers for your own farm below.
Calculator
Can one baler clear your hay before the weather turns?
Enter your acres, yield, bale weight and baler speed.
- Bales the field will make: 800 bales
- Bales your baler can make in the window: 720 bales
- Baling days needed: 3.3 days
Example values only, set near break-even; replace each with your own. Assumes one baler at a steady rate. It leaves out mowing, raking, breakdowns and re-drying after rain, so treat it as a capacity check, not a schedule.
Buying new or used: what the numbers mean for your farm
Weak new-machine sales change the deal for buyers. With fewer new tractors and combines moving in 2026, buyers may find dealers more willing to negotiate. That can help a farm that needs one more baler or a wider mower for a short cutting window.
Before you buy, work out your real bottleneck. If the baler sits idle while hay dries, a faster mower-conditioner or a tedder may add more capacity than a new baler. If hay is ready but rain comes before you finish, baler throughput is the limit, which the calculator above can show. Custom operators are another option when the gap is a few days a year. For financing or tax questions on a purchase, get professional advice.
Forage quality: why tested hay is worth more
Tested hay is easier to price fairly than hay judged by looks. Relative Feed Value (RFV) is the older index, built from fiber values, with mature alfalfa set at 100. Relative Forage Quality (RFQ) adds fiber digestibility, so it works better for grass hay as well as legumes. The Texas and Southwestern Cattle Raisers Association notes that RFV only really applies to alfalfa hay fed to dairy cows, while RFQ also accounts for fiber digestibility.
Looks can mislead. In a Penn State Extension exercise, people ranked four bales by eye, and the bale judged best on appearance had the lowest RFV of the group. Test before you price.
The National Forage Testing Association runs the lab check. Over 150 laboratories take part in its certification program each year. If you buy or sell on RFQ or RFV, ask whether the lab holds current certification. Sampling error is often larger than lab error, so take cores from many bales in each lot.
Mold toxins such as vomitoxin (DON) can make a load unsellable even when its RFQ is high. Feed limits differ by animal type, so check FDA guidance and your state extension service, and get a vet or nutritionist’s advice before feeding a suspect lot.
Precision agriculture tools for tracking the season
Market data tells you where the industry is going. Field data tells you when to cut. Four tools are most useful for hay and forage work:
- Vegetation health maps: NDVI from satellites flags stress or patchy growth in a stand before it shows from the cab.
- Soil moisture estimates: help plan irrigation and cutting without a probe in every field.
- Weather forecasts: let you plan mowing, raking and baling around a drying window.
- Zone maps: show which parts of a field pull down average quality, so you can manage them apart.
The Farmonaut Satellite + AI Farm Monitoring System gives these maps for fields you draw once, on web, Android or iOS through the app. For developers, our satellite data API and API developer docs show how to pull the same data into farm software.
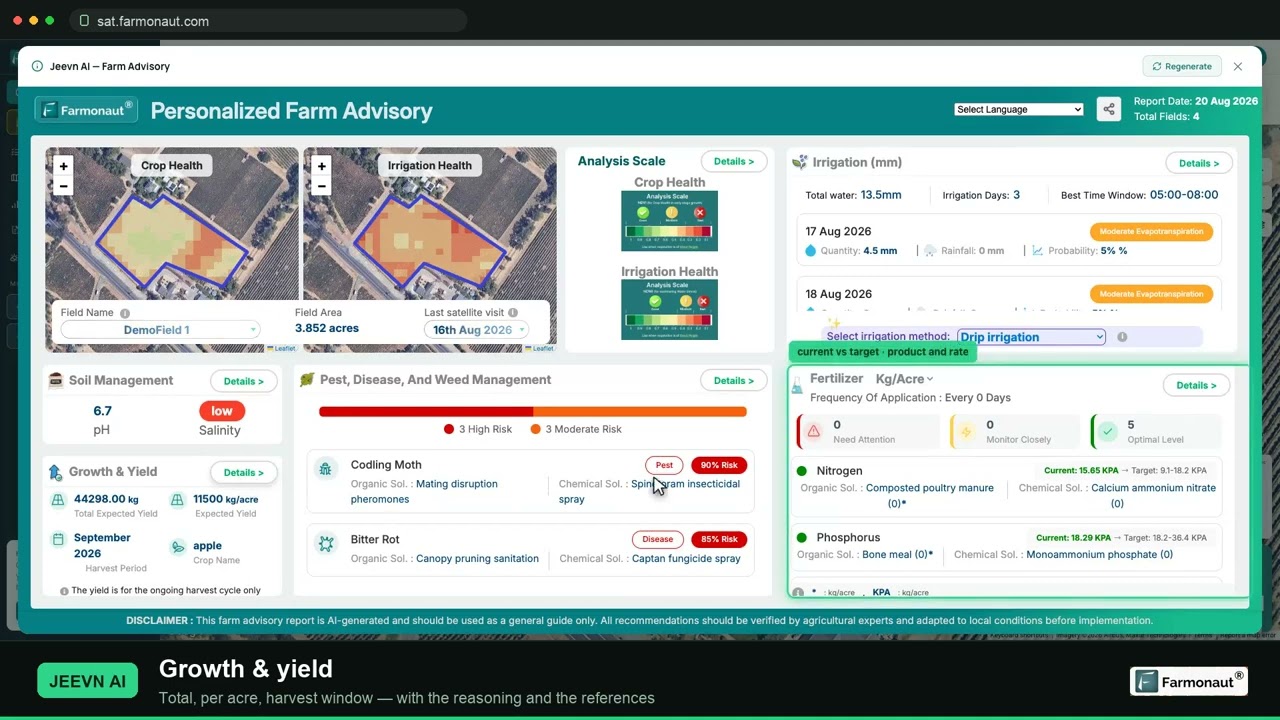
▶ How to read satellite NDVI maps and spot crop stress early, a walkthrough on a real field. · 19:36
Storage, pests and weather risk after baling
Good hay can lose value fast in storage. A checklist that holds in any season:
- Cover it: a roof or tarp keeps rain and sun off the stack.
- Lift it: pallets or a gravel base stop bales wicking moisture from the ground.
- Let it breathe: leave gaps for airflow to limit mold.
- First in, first out: feed older hay first.
- Check often: look for heating, mold, rodents and insects. Our guide to rat and ant infestation covers barn pests.
Hay baled too wet can heat and, in bad cases, catch fire. Probe new stacks for temperature in the first weeks after baling.
Frost brings its own risk in the field. Sorghum and sudangrass can build up prussic acid after a frost, which is a grazing hazard for livestock. Late-fall frosts can also weaken perennial stands, which shows up as lower yield the next spring. Satellite maps help you see which paddocks were hit.
Pasture management and the forage analysis market
Unlike machinery, forage testing has no widely quoted billion-dollar market size in the reports above. The useful numbers for a farm are the certified-lab count and how often you sample. Pull a sample from every hay or silage lot you cut.
Grazing choices feed straight into what gets tested:
- Rotational grazing: move animals before a paddock is overgrazed so regrowth can recover. See rotational grazing benefits.
- Species choice: match grasses and legumes to your climate and your livestock’s needs.
- Soil fertility: test soil and apply nutrients to keep yield and protein up. Follow the label and local rules.
- Weed control: keep weeds from crowding out the forage you sell. Read our integrated weed management steps.
- Grazing pressure: satellite vegetation data shows which paddocks need rest.

▶ Six plain steps to start precision farming without buying a robot. · 4:18
How to track this market over time
To keep this page useful next year, repeat the same checks rather than trusting any single figure:
- Read AEM’s latest monthly tractor and combine report for the US trend.
- Check the next NASS Crop Production report for hay stocks (May 1 stocks in May, December 1 stocks in January) and hay production.
- Note the USDA farm income forecast, since buying follows margins.
- Pick one market-research publisher whose definition matches your question, and compare only within its series.
For the wider data side of farming, see our overview of agriculture analytics market trends.
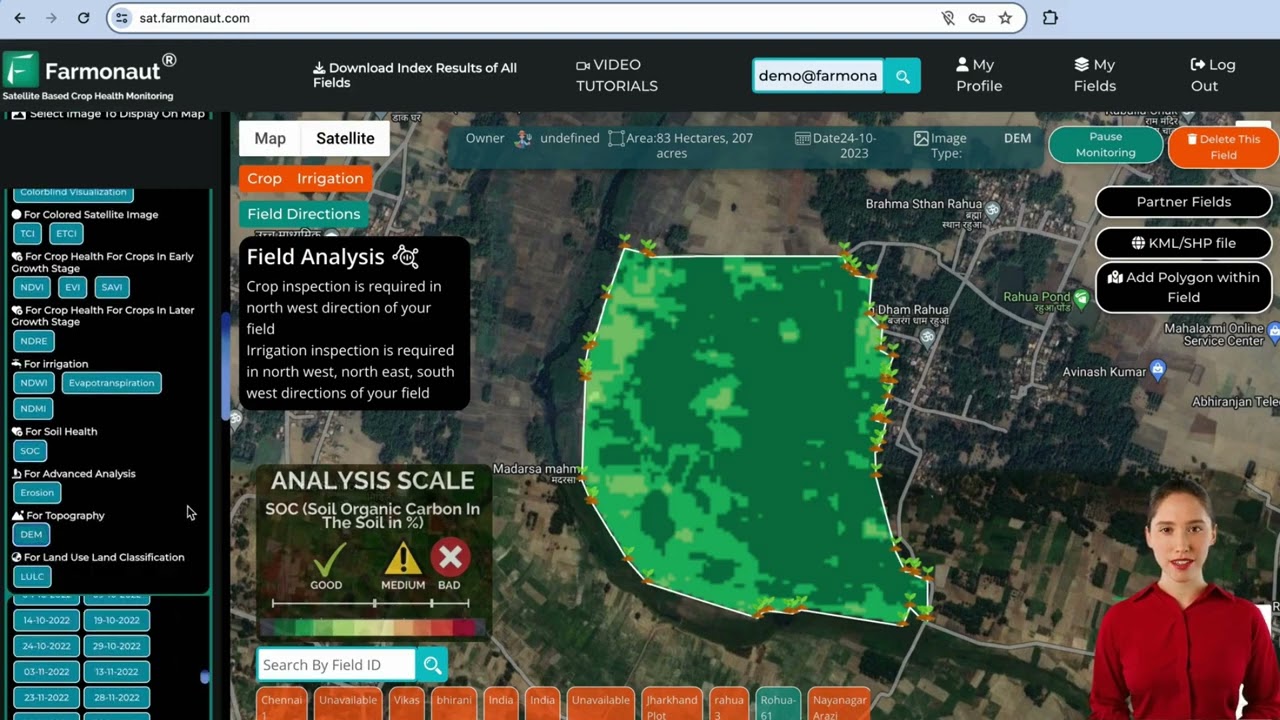
▶ A tutorial on the Farmonaut web app for satellite field monitoring. · 8:02
FAQ
What is the haying and forage machinery market worth?
Market Research Future put it at $20.43 billion for 2025, rising to $25.0 billion by 2035. Its broader agricultural haying report gives $22.0 billion for 2025 and $31.52 billion by 2035.
Why do the estimates differ so much?
Publishers count different machines. Each report draws the line differently, for example on silage, wrapping and transport equipment. Compare years within one publisher’s series.
Is hay making machinery a different market?
No. It is another name for the same group: mowers, conditioners, rakes, tedders, balers and forage harvesters.
Is there a US-only market size?
The public report summaries group the US into North America. AEM’s monthly US retail sales are the best public US-only demand signal.
Are US equipment sales rising or falling?
Falling in 2026. Through September, AEM data showed US tractor sales down 12.6% and combine sales down 9.4% from a year earlier.
Farmonaut crop monitoring
Watch your hay fields from space
Draw your hay and pasture fields once and Farmonaut shows satellite vegetation and moisture maps through the season, on web, Android or iOS.




Sources
- Market Research Future, Haying and Forage Machinery Market report (accessed November 2026): marketresearchfuture.com
- Market Research Future, Agricultural Haying and Forage Machinery Market report (accessed November 2026): marketresearchfuture.com
- Global Market Insights, Haying and Forage Equipment Market (accessed November 2026): gminsights.com
- Future Market Insights, Haying and Forage Equipment Market (accessed November 2026): futuremarketinsights.com
- AEM, US Ag Tractor and Combine Reports (monthly): aem.org
- AEM, US and Canadian agricultural tractor and combine sales decline in March 2026: aem.org
- RFD-TV, Tractor and combine sales fall across North America (AEM September 2026 data): rfdtv.com
- USDA ERS, Highlights from the farm income forecast (2026): ers.usda.gov
- USDA NASS, Crop Production, May 12, 2026 (hay stocks): esmis.nal.usda.gov
- Texas and Southwestern Cattle Raisers Association, The basics of forage quality: tscra.org
- Penn State Extension, Forage quality in perspective: extension.psu.edu
- National Forage Testing Association, Certification: foragetesting.org
Discussion
Questions, corrections or field experience? Share them below. First-time comments are reviewed before they appear, and your email is never published.
No comments yet. Be the first to add a question or your experience.

 Global Launch Base
 Elders
 Agritein
 Delicio
 WB Dev
 Sama Premium
 Prochecker
 Tres Valles
 LACOS Geoinformation
 Magrifly
 LatConnect 60
 WebsEdge
 Blickwinkel
 Agricultural Credit Policy Council
 Marei Nursery
 eKGIS
 Mostas Tech
 Andex
 FCF India

 Exploration consultancy · South Africa · Gold
 Licence holder · Niger · Gold
 Licence holder · Nigeria · Gold + lithium
 Client · Tanzania · Gold
 Client · Somalia · Gold
 Client & affiliate partner · Ghana · Gold










